“I can say here definitively, the K-shaped economy is over” (Bessent, CNBC, 2026-08-04). On the flow — wage growth by tier — the 2025 divergence was real: a +2.11-point step at 2025, certified by HAC, classical, a 4,000-draw year-block bootstrap (100% positive), and the annual-unit Welch test alike. It reads +0.1 as of August 2026. On the stock — wealth shares — nothing turned: the top 1%’s share is 1.0 point higher than 2019 and 8.8 points higher than 1989.
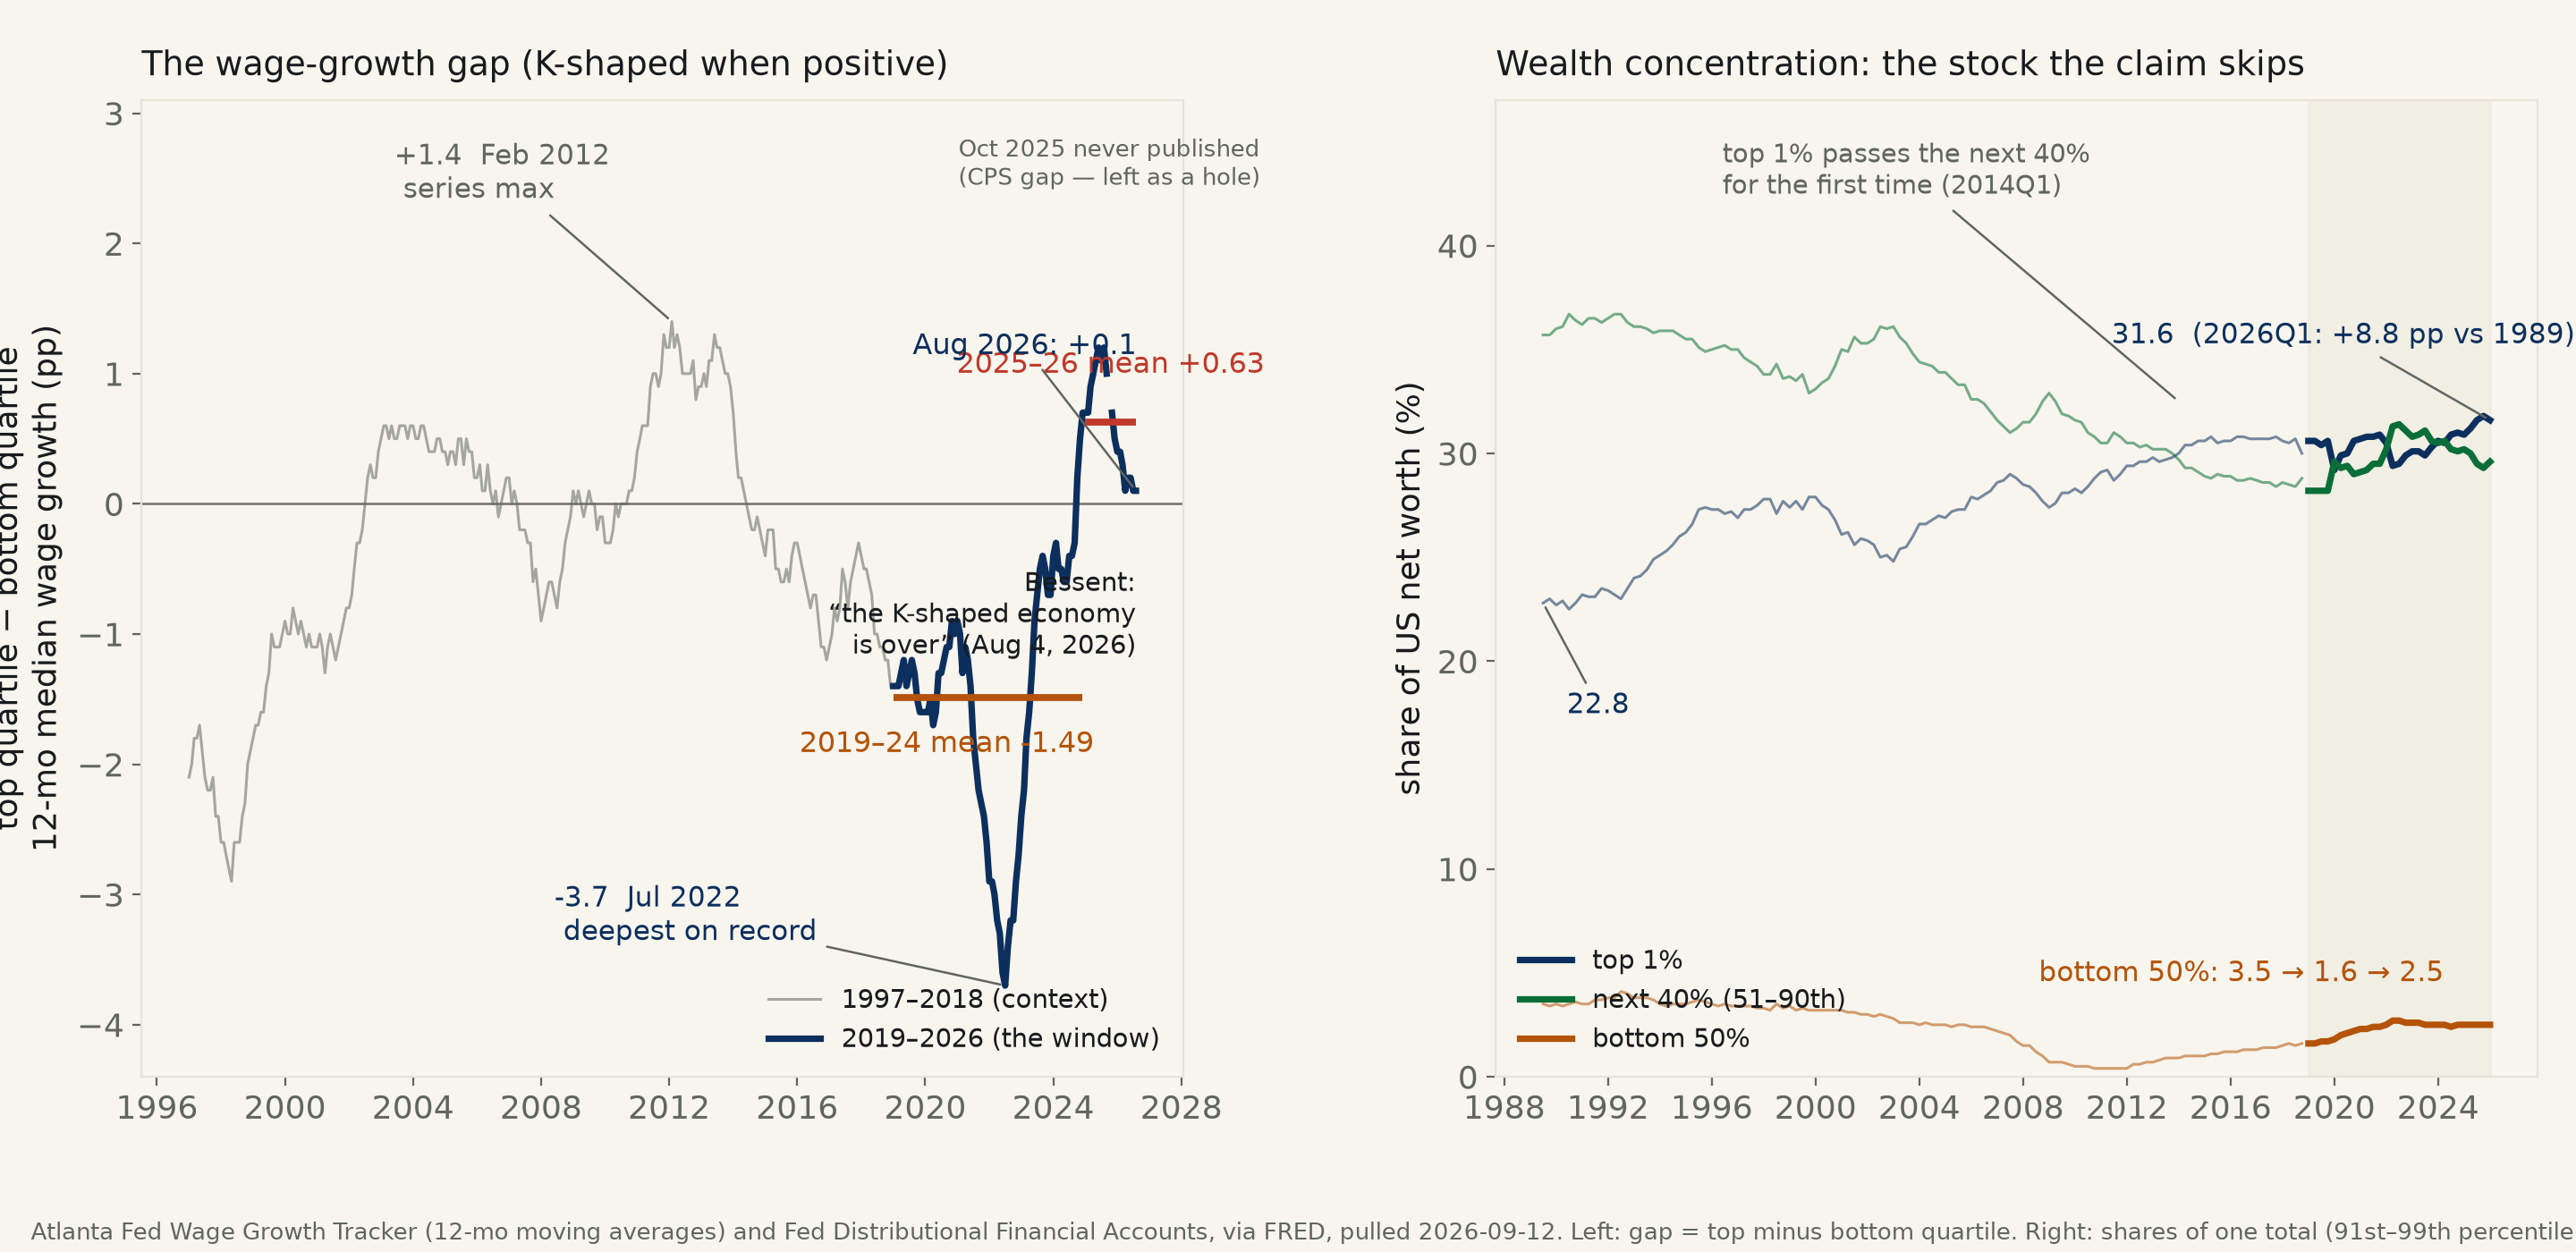
The claim, verbatim: “I can say here definitively, the K-shaped economy is over” — Treasury Secretary Scott Bessent, CNBC, August 4, 2026 (PBS NewsHour, Aug 12, which defines the term as “high-income and low-income households moving in different directions for several metrics”). Two of those metrics resolve in public monthly and quarterly data, and they are different instruments: a flow — whose wages are growing faster — and a stock — who holds the wealth. This run tests both and pools neither: the wage series is the Atlanta Fed Wage Growth Tracker’s 12-month moving average of median hourly wage growth for the top quartile (76th–100th wage percentile) minus the bottom quartile (1st–25th), monthly since 1997; the wealth series is the Fed’s Distributional Financial Accounts shares of net worth, quarterly since 1989. Both pulled fresh 2026-09-12, keyless, from FRED. Positive gap = top growing faster = the K direction.
The era the claim inherits was running the K backwards. From 2019-01 to 2024-12 the gap’s mean is -1.49 points — bottom-quartile wages growing a point and a half per year faster than top-quartile — 95% CI [-2.19, -0.79] under NW-HAC(13), classical [-1.72, -1.25], p=7.0×10⁻⁵, n=72 months. The extreme is in the table: July 2022, −3.7 — bottom-quartile median hourly growth of 7.6% against the top’s 3.9%, the deepest reading in all 355 months of the series — the tight post-pandemic labor market compressing wages from below. On the flow metric, the “K-shaped economy” of 2021–24 commentary was already inverted before anyone declared it over.
Then 2025, and the step is real by every method this desk owns. The gap crossed zero in October 2024, averaged +0.92 across 2025 (peak +1.2 in June and August; top quartile 4.8% against 3.6%), and the era contrast — 2025–26 mean minus 2019–24 mean — is +2.11 points, NW-HAC(13) CI [1.39, 2.83], classical [1.65, 2.57], and 100.0% of 4,000 stratified year-block bootstrap draws positive (CI [1.27, 2.94]). The formal interaction test at 2025-01 puts the level jump at +2.19 points, HAC CI [0.73, 3.65]; the step model net of trend says +1.62 [0.13, 3.11] and still excludes zero with the split moved three months in either direction; and collapsing to the honest annual unit — each calendar year one observation, 2025–26 (mean +0.57) vs 2019–24 (mean −1.49) — the Welch interval is [+0.58, +3.53], p=0.019, excluding zero at the power floor. Four ways, one answer: the level of the wage-growth gap stepped up by about two points at 2025.
What is not certified: the trend. The interaction’s slope-change coefficient is −0.79 pts/yr, and the three error models disagree about it — NW-HAC(13) excludes zero ([−1.09, −0.50], p=1.4×10⁻⁷); classical OLS contains it ([−1.61, +0.02], p=0.055); the year-block bootstrap contains it ([−1.32, +0.17], 5.6% of draws positive). Reported as an unresolved disagreement, not rounded to the HAC answer — on a 19-month hump-shaped post era the HAC long-run variance is the fragile one. The certified fact is a level step, not a new slope; the pre-2025 slope is itself indistinguishable from zero (+0.14 [−0.14, +0.43]) because the pre era is U-shaped, and a straight line was never the right tool for it.
And in 29 years of context, the 2025 ‘K’ was ordinary. The same annual-unit Welch test run against all 28 prior years instead of just 2019–24: 2025–26 (+0.57) minus 1997–2024 (−0.57) is +1.14, CI [−0.88, +3.16], p=0.12 — contains zero. The gap’s all-time high is +1.4 (February 2012); 2011–2013 averaged +0.99; 34.1% of all months since 1997 are positive. The two-point step is certified relative to 2019–24 — and 2019–24, not 2025, is the outlier: three extraordinary reverse-K years, followed by a reversion to the series’ ordinary small positive tilt.
The closing is a fact about levels, and only that. From the +1.2 peak to August 2026: +0.1 — top quartile 3.8% against 3.7%, one-tenth of a point from equal growth, in the very month Bessent declared the K over. The 2026 year-to-date mean is +0.23 (nominal CI [0.11, 0.35] — but 8 months of a 12-month moving average carry less than one independent year of information, and the desk does not certify intervals that thin in either direction). The within-2026 slope is −0.54 pts/yr on classical errors only ([−0.86, −0.23], p=0.006); no honest HAC exists at n=8. So on the claim’s own metric — growth rates — the August 2026 reading is equal-growth within a tenth of a point, and the desk can say that much. Whether the divergence has closed or is still closing is not distinguishable on the data that exist; and converging rates, wherever they settle, stop a gap widening without returning any of the ground already lost or gained. The rate series says nothing about levels, by construction.
The wealth side never turned at all. Over the identical window, 2019Q1 to 2026Q1 (the DFA’s latest published quarter): the top 1% share of net worth went 30.6% → 31.6% — up 1.0 point, slope +0.147 pts/yr, 95% CI [+0.015, +0.279], excluding zero. The bottom 50% went 1.6% → 2.5% (+0.9, CI [+0.055, +0.190], excluding zero — a real rise off a base of 1.6, landing 2020–21 and holding; still a share 12.6× smaller than the top 1%’s). Shares sum to one total, so someone lost: the omitted 91st–99th percentile band, down 3.3 points (39.6 → 36.3) — the window’s redistribution ran from the upper-middle to both ends, not from the top to the bottom. The long arc is unchanged: 22.8% in 1989Q3 → 31.6% in 2026Q1, +8.8 points, +0.210 pts/yr, CI [+0.174, +0.245], p=6×10⁻³¹ across 147 quarters — a 37-year climb that first lifted the top 1% past the entire next-40% band in 2014Q1. “Over” as an economy-wide claim would need this line to bend the other way. It did not; if it moved at all, it moved up.
What survives contact with the table. Four statements are certified: (1) 2019–24, bottom-quartile wage growth beat top-quartile by 1.49 pts/yr on average — the reverse of K; (2) the gap stepped up about 2.1 points at 2025 — four methods agree; (3) it reads +0.1 as of August 2026 — equal growth within a tenth of a point, though the closing itself cannot be certified as a trend on 8 months of a moving average; (4) the top 1%’s wealth share is 1.0 point higher than 2019 and 8.8 points higher than 1989 — no reversal, anywhere, in the stock the “K” was originally drawn around. The Secretary’s sentence is defensible on the flow, on the narrow reading his argument invokes, for the single latest month. As a claim about the economy’s shape — rates converged, wealth structure untouched — it is half a claim. The K he declared over was, on this desk’s arithmetic, mostly an upside-down K for three years, briefly a right-side-up one for a year at a magnitude last seen in 2012, and — where it was always most visibly a K, in the wealth shares — still exactly as K-shaped as the quarter before he said it.
The quotation was longer than the sentence this run tested. PBS NewsHour’s Aug. 12 write-up carries the fuller passage from the same Aug. 4 CNBC interview. “I got sick of hearing about this K-shaped economy,” Bessent said, and then: “I can say here definitively, the K-shaped economy is over.” On what replaced it: “We’re seeing more of a ‘C economy,’” he said. “Where the lower end of wage earners are finally calling it back, just like they did in President Trump’s first term.” (The desk also holds an automated-speech-recognition receipt of the CNBC audio, “Bessent: A Deal with Iran,” timestamped 00:36:53–00:37:07, reading the same words — a receipt, not a citation; every word quoted here is PBS’s published text.) The fuller sentence upgrades the claim’s specificity. “Over” could mean the two arms converged; “C” means the lower arm now rises faster. That is a reversal claim, and it is checkable against two series: this run’s own, and the one the Secretary cited.
On this run’s series, the reversal count is 0 of 18. Since the 2025 turn — 2025-01 through 2026-08, the 18 published months of the fitted post era, October 2025 still a hole — not one month shows bottom-quartile median wage growth above top-quartile. The gap’s floor for the entire post era is +0.1 (July and August 2026); its last negative month was September 2024 (−0.3), before the zero-crossing certified above. On matched-worker wage growth, “the lower end of wage earners calling it back” is, as of the latest published month, a tenth of a point from a tie, on the top’s side.
The 5.5 percent is real, and it is a different instrument. The same PBS piece attributes the number to the Secretary directly: “Citing the Bureau of Labor Statistics, Bessent said data shows ‘the bottom quartile of wage earners have had, year over year, 5.5% wage gains. And that’s three times more than the top quartile.’” Before adopting or dismissing a figure that does not match this run’s series, the desk went looking for the series that produces it. It exists, to the decimal: usual weekly nominal earnings of full-time wage and salary workers (16+), first quartile, $806 in 2025Q2 → $850 in 2026Q2 = +5.46% — the 5.5. Third quartile over the identical two quarters: $1,887 → $1,915 = +1.48%, so “three times more” is, at 3.7×, an understatement of his own series. PBS’s text prints no top-quartile figure at all, only the “three times” ratio; the series itself puts the top quartile at +1.5. Nothing was mis-paired: the number is the BLS quartile-of-levels cut, quoted correctly.
Both instruments are built on the same Current Population Survey; they are not the same measurement. The BLS quartile compares the 25th and 75th percentiles of the earnings-level distribution — everyone employed this quarter against everyone employed a year ago, whoever they turn out to be. The Atlanta Fed tracker follows individual workers matched twelve months apart and reports each bin’s median growth. The first moves when the workforce’s composition moves; the second is built not to. Limit 3 above anticipated exactly this divergence. And the BLS cut’s own history is why one quarter of it cannot carry a shape-of-the-economy claim: first-quartile growth exceeded third-quartile in 45 of 101 quarters since 2001 — 45 percent, near a coin flip — with 2026Q2’s +3.98-point gap the second-widest of those 101, behind 2021Q4 (+4.04) and just ahead of 2017Q3 (+3.89), both squarely inside the years the K-shaped framing describes. On this cut the economy read “C” in 2017 and 2021, and in all three published quarters of 2025 — the very year the matched-worker series certifies as the top-ahead year. One quarter earlier, the same BLS series printed +2.95 against +0.84; quarterly CPS cross-sections move like that.
Corroboration, none of it this desk’s. The same PBS piece carries three independent versions of this page’s finding. Peter Orszag, CEO of Lazard, on CNBC: “I think that declaring the death of a K-shaped economy is a little bit premature.” Deon Strickland, financial services professor at Wake Forest, to PBS: “I would say the probability is higher for the continuation of a K than the ascent of a C.” Mark Mathews, chief economist for the National Retail Federation, writing in July: “The K-shape persists, but lower-income consumers have increased their spending versus last year.”
What changes, and what does not. The verdict above stands as published. The update adds three facts to the record. The claim is sharper than the sentence originally tested — a reversal, and on matched-worker growth the reversal count is 0 of 18 months, minimum gap +0.1. The Secretary’s 5.5 percent is a real, correctly cited reading of the BLS quartile-of-levels cut — an instrument whose own history has read “C” nearly half the time since 2001, including the K’s loudest years. And nothing in the new information touches the wealth half, which was never in dispute: the top 1% share of net worth closed 2026Q1 at 31.6 percent, one point above 2019. If the economy’s shape changed, the stock has not registered it.
| Quarter | First quartile ($/wk) | First-quartile YoY | Third quartile ($/wk) | Third-quartile YoY | Gap (first − third) |
|---|---|---|---|---|---|
| 2017Q3 — reference | 575 | +5.31 | 1,357 | +1.42 | +3.89 |
| 2021Q4 — reference | 697 | +6.57 | 1,578 | +2.53 | +4.04 |
| 2025Q1 | 814 | +5.44 | 1,895 | +4.58 | +0.86 |
| 2025Q2 | 806 | +3.87 | 1,887 | +2.78 | +1.09 |
| 2025Q3 | 818 | +3.54 | 1,898 | +2.15 | +1.39 |
| 2025Q4 | — | — | — | — | never published (CPS collection gap) |
| 2026Q1 | 838 | +2.95 | 1,911 | +0.84 | +2.10 |
| 2026Q2 — the quoted quarter | 850 | +5.46 | 1,915 | +1.48 | +3.98 |
Update sources, pulled 2026-09-13: FRED keyless fredgraph.csv mirrors of BLS LEUSD series LEU0252911300Q (first quartile) and LEU0252911400Q (third quartile), usual weekly nominal earnings of full-time wage and salary workers 16+, not seasonally adjusted; year-over-year is same-quarter prior year, the only comparison the unadjusted series supports. 2025Q4 is absent at source — the same October 2025 CPS collection gap that holes the wage-tracker series above. The two reference rows are the only quarters since 2001 with a first-minus-third gap at or above 2026Q2’s. The Atlanta Fed tracker quartiles were re-pulled the same day and read 3.8 / 3.7 for August 2026 — unchanged from this run’s frozen corpus, no revision. The BLS quarterly release carrying 2026Q2 was published July 21, 2026 — the vintage available to the Secretary on August 4.
t is centered at the split date so the D coefficient is the vertical jump at 2025-01. HAC bandwidth 13 covers the moving average’s 11-month overlap. The bootstrap resamples calendar-year blocks with replacement, stratified 6 pre-era blocks from 2019–2024 and 2 post-era from 2025–2026 so every draw is estimable; the post era being 2 blocks is itself the honest power ceiling. The slope-change coefficient’s three error models disagree — the one row of this table the desk does not certify.
| Fit | Slope / shift | 95% CI | R² | p | n / SE | Reads as |
|---|---|---|---|---|---|---|
| M1 — one trend, 2019-01–2026-08 | +0.34 pts/yr | [0.14, 0.54] | 0.367 | 0.0011 | 91 / NW-HAC(13) | excludes 0 — the dominant fact of the window is recovery from the 2022 trough |
| M2 — interaction, split 2025-01: level jump D | +2.19 pts | [0.73, 3.65] | 0.529 | 0.0033 | 91 / NW-HAC(13) | excludes 0 (classical [1.33, 3.04]) — the certified break |
| M2 — interaction, slope change t×D | -0.79 pts/yr | [-1.09, -0.50] | 0.529 | 1.4e-07 | 91 / NW-HAC(13) | method disagreement: classical CI [-1.61, +0.02] (p=0.055) and the bootstrap below contain zero — not certifiable |
| M3 — step model: level shift D (net of trend) | +1.62 pts | [0.13, 3.11] | 0.509 | 0.0332 | 91 / NW-HAC(13) | excludes 0; classical [0.98, 2.26]; split moved to 2024-10 (+1.96) or 2024-07 (+2.04) — both still exclude 0 |
| pre-2025 slope alone, 2019-01–2024-12 | +0.14 pts/yr | [-0.14, +0.43] | 0.066 | 0.327 | 72 / NW-HAC(13) | contains 0 — the pre era is U-shaped (down to −3.7, back up), a straight line is the wrong tool |
| post-2025 slope alone, 2025-01–2026-08 | -0.65 pts/yr | [-0.91, -0.39] | 0.672 | 1.5e-06 | 19 / NW-HAC(13) | excludes 0 — the post era declines on net (up to the 2025 peak, then down) |
| within-2026 slope, 2026-01–08 | -0.54 pts/yr | [-0.86, -0.23] | — | 0.0056 | 8 / classical only | not certifiable: 8 points of a 12-month MA carry <1 independent year; no honest HAC exists at n=8 |
| Statistic | Point estimate | Bootstrap 95% CI | Draws > 0 | Reads as |
|---|---|---|---|---|
| era-mean difference, 2025+ vs 2019–24 | +2.11 pts | [1.27, 2.94] | 100.0% | excludes 0 — every one of 4,000 draws positive |
| M3 level shift D | +1.62 pts | [-0.06, +5.60] | 97.0% | near-miss: sign share clears 95%, percentile interval touches 0 by 0.06 — the era-mean row is the robust form of the same test |
| M2 slope change t×D | -0.79 pts/yr | [-1.32, +0.17] | 5.6% | contains 0 — agrees with classical, against HAC |
| Comparison | Diff | Welch 95% CI | t | p | n | Reads as |
|---|---|---|---|---|---|---|
| 2025–26 vs 2019–24 (the wage window) | +2.06 | [+0.58, +3.53] | 3.9 | 0.019 | 2 / 6 | excludes 0 at the power floor |
| 2025–26 vs all 1997–2024 | +1.14 | [−0.88, +3.16] | 2.9 | 0.12 | 2 / 28 | contains 0 — the hump is ordinary in 29 years |
| annual-step interaction (level jump / slope change) | +1.92 / −0.84 | [−2.01, +5.85] / [−4.97, +3.29] | — | 0.25 / 0.60 | 8 | both contain 0 — run 537’s lesson: 8 points cannot carry an interaction |
| Wealth fit (own units, not pooled with wages) | Slope | 95% CI | R² | p | n / SE | Reads as |
|---|---|---|---|---|---|---|
| top 1% share, 2019Q1–2026Q1 | +0.147 pts/yr | [0.01, 0.28] | 0.245 | 0.0294 | 29 / NW-HAC(4) | excludes 0 — the top share drifted up, not down: +1.0 pt over the window |
| next 40% share, same window | +0.250 pts/yr | [0.02, 0.48] | 0.312 | 0.0329 | 29 / NW-HAC(4) | excludes 0 — +1.4 pts |
| bottom 50% share, same window | +0.122 pts/yr | [0.05, 0.19] | 0.603 | 0.0004 | 29 / NW-HAC(4) | excludes 0 — +0.9 pts off a base of 1.6 (to 2.5%); the window’s gains landed 2020–21 and held |
| top 1% share, full history 1989Q3–2026Q1 | +0.210 pts/yr | [0.17, 0.24] | 0.830 | 6.0e-31 | 147 / NW-HAC(4) | excludes 0 by a mile — 22.8% (1989Q3) → 31.6% (2026Q1), +8.8 pts; passed the next-40% band in 2014Q1 |
| Year | Top quartile (mean) | Bottom quartile (mean) | Gap (top − bottom) | Months |
|---|---|---|---|---|
| 1997 | 3.69 | 5.75 | -2.06 | 12 |
| 1998 | 4.36 | 6.86 | -2.50 | 12 |
| 1999 | 4.77 | 6.14 | -1.37 | 12 |
| 2000 | 4.68 | 5.67 | -0.98 | 12 |
| 2001 | 4.89 | 5.95 | -1.06 | 12 |
| 2002 | 4.78 | 4.91 | -0.12 | 12 |
| 2003 | 4.03 | 3.48 | +0.56 | 12 |
| 2004 | 3.62 | 3.12 | +0.49 | 12 |
| 2005 | 3.83 | 3.45 | +0.38 | 12 |
| 2006 | 3.92 | 3.80 | +0.12 | 12 |
| 2007 | 4.07 | 4.29 | -0.23 | 12 |
| 2008 | 3.97 | 4.54 | -0.57 | 12 |
| 2009 | 3.54 | 3.56 | -0.02 | 12 |
| 2010 | 2.16 | 2.22 | -0.07 | 12 |
| 2011 | 2.30 | 1.47 | +0.83 | 12 |
| 2012 | 2.28 | 1.18 | +1.09 | 12 |
| 2013 | 2.46 | 1.40 | +1.06 | 12 |
| 2014 | 2.17 | 2.12 | +0.04 | 12 |
| 2015 | 2.81 | 3.22 | -0.42 | 12 |
| 2016 | 3.08 | 3.82 | -0.75 | 12 |
| 2017 | 3.32 | 4.02 | -0.69 | 12 |
| 2018 | 3.06 | 3.95 | -0.89 | 12 |
| 2019 | 3.09 | 4.48 | -1.38 | 12 |
| 2020 | 3.17 | 4.49 | -1.32 | 12 |
| 2021 | 2.90 | 4.58 | -1.68 | 12 |
| 2022 | 3.95 | 7.12 | -3.17 | 12 |
| 2023 | 5.38 | 6.52 | -1.14 | 12 |
| 2024 | 4.92 | 5.14 | -0.22 | 12 |
| 2025 | 4.66 | 3.75 | +0.92 | 11 |
| 2026 | 3.80 | 3.58 | +0.22 | 8 |
Means of published months. October 2025 was never published (the CPS collection gap) and is absent, not interpolated — 2025 shows 11 months. 2026 runs through August. The full monthly series and both source CSVs are published below.
| Month | Top quartile | Bottom quartile | Gap |
|---|---|---|---|
| 2019-01 | 3.10 | 4.50 | -1.40 |
| 2019-02 | 3.10 | 4.50 | -1.40 |
| 2019-03 | 3.00 | 4.40 | -1.40 |
| 2019-04 | 3.10 | 4.40 | -1.30 |
| 2019-05 | 3.20 | 4.40 | -1.20 |
| 2019-06 | 3.10 | 4.50 | -1.40 |
| 2019-07 | 3.20 | 4.50 | -1.30 |
| 2019-08 | 3.20 | 4.40 | -1.20 |
| 2019-09 | 3.20 | 4.50 | -1.30 |
| 2019-10 | 3.00 | 4.50 | -1.50 |
| 2019-11 | 2.90 | 4.50 | -1.60 |
| 2019-12 | 3.00 | 4.60 | -1.60 |
| 2020-01 | 3.00 | 4.60 | -1.60 |
| 2020-02 | 3.00 | 4.60 | -1.60 |
| 2020-03 | 3.10 | 4.60 | -1.50 |
| 2020-04 | 3.00 | 4.70 | -1.70 |
| 2020-05 | 3.10 | 4.70 | -1.60 |
| 2020-06 | 3.20 | 4.50 | -1.30 |
| 2020-07 | 3.20 | 4.50 | -1.30 |
| 2020-08 | 3.20 | 4.40 | -1.20 |
| 2020-09 | 3.20 | 4.30 | -1.10 |
| 2020-10 | 3.30 | 4.40 | -1.10 |
| 2020-11 | 3.40 | 4.30 | -0.90 |
| 2020-12 | 3.30 | 4.30 | -1.00 |
| 2021-01 | 3.20 | 4.10 | -0.90 |
| 2021-02 | 3.20 | 4.20 | -1.00 |
| 2021-03 | 3.00 | 4.30 | -1.30 |
| 2021-04 | 3.00 | 4.10 | -1.10 |
| 2021-05 | 2.90 | 4.10 | -1.20 |
| 2021-06 | 2.90 | 4.30 | -1.40 |
| 2021-07 | 2.80 | 4.60 | -1.80 |
| 2021-08 | 2.80 | 4.80 | -2.00 |
| 2021-09 | 2.70 | 4.90 | -2.20 |
| 2021-10 | 2.70 | 5.00 | -2.30 |
| 2021-11 | 2.70 | 5.10 | -2.40 |
| 2021-12 | 2.90 | 5.50 | -2.60 |
| 2022-01 | 3.00 | 5.90 | -2.90 |
| 2022-02 | 3.20 | 6.10 | -2.90 |
| 2022-03 | 3.40 | 6.40 | -3.00 |
| 2022-04 | 3.50 | 6.70 | -3.20 |
| 2022-05 | 3.70 | 7.00 | -3.30 |
| 2022-06 | 3.80 | 7.40 | -3.60 |
| 2022-07 | 3.90 | 7.60 | -3.70 |
| 2022-08 | 4.20 | 7.60 | -3.40 |
| 2022-09 | 4.40 | 7.60 | -3.20 |
| 2022-10 | 4.60 | 7.80 | -3.20 |
| 2022-11 | 4.80 | 7.70 | -2.90 |
| 2022-12 | 4.90 | 7.60 | -2.70 |
| 2023-01 | 5.00 | 7.40 | -2.40 |
| 2023-02 | 5.10 | 7.30 | -2.20 |
| 2023-03 | 5.40 | 7.20 | -1.80 |
| 2023-04 | 5.40 | 7.00 | -1.60 |
| 2023-05 | 5.50 | 6.80 | -1.30 |
| 2023-06 | 5.60 | 6.50 | -0.90 |
| 2023-07 | 5.60 | 6.30 | -0.70 |
| 2023-08 | 5.60 | 6.10 | -0.50 |
| 2023-09 | 5.50 | 5.90 | -0.40 |
| 2023-10 | 5.40 | 5.90 | -0.50 |
| 2023-11 | 5.30 | 6.00 | -0.70 |
| 2023-12 | 5.20 | 5.90 | -0.70 |
| 2024-01 | 5.30 | 5.70 | -0.40 |
| 2024-02 | 5.20 | 5.50 | -0.30 |
| 2024-03 | 4.90 | 5.40 | -0.50 |
| 2024-04 | 5.00 | 5.50 | -0.50 |
| 2024-05 | 4.80 | 5.40 | -0.60 |
| 2024-06 | 4.70 | 5.30 | -0.60 |
| 2024-07 | 4.70 | 5.10 | -0.40 |
| 2024-08 | 4.70 | 5.10 | -0.40 |
| 2024-09 | 4.80 | 5.10 | -0.30 |
| 2024-10 | 5.00 | 4.80 | +0.20 |
| 2024-11 | 5.00 | 4.50 | +0.50 |
| 2024-12 | 5.00 | 4.30 | +0.70 |
| 2025-01 | 4.90 | 4.20 | +0.70 |
| 2025-02 | 4.90 | 4.20 | +0.70 |
| 2025-03 | 5.00 | 4.10 | +0.90 |
| 2025-04 | 4.80 | 3.80 | +1.00 |
| 2025-05 | 4.80 | 3.70 | +1.10 |
| 2025-06 | 4.80 | 3.60 | +1.20 |
| 2025-07 | 4.70 | 3.60 | +1.10 |
| 2025-08 | 4.60 | 3.40 | +1.20 |
| 2025-09 | 4.50 | 3.50 | +1.00 |
| 2025-11 | 4.30 | 3.60 | +0.70 |
| 2025-12 | 4.00 | 3.50 | +0.50 |
| 2026-01 | 3.90 | 3.50 | +0.40 |
| 2026-02 | 3.90 | 3.50 | +0.40 |
| 2026-03 | 3.80 | 3.50 | +0.30 |
| 2026-04 | 3.70 | 3.60 | +0.10 |
| 2026-05 | 3.70 | 3.50 | +0.20 |
| 2026-06 | 3.80 | 3.60 | +0.20 |
| 2026-07 | 3.80 | 3.70 | +0.10 |
| 2026-08 | 3.80 | 3.70 | +0.10 |
| Quarter | Top 1% | Next 40% | Bottom 50% | Implied 91st–99th |
|---|---|---|---|---|
| 2019Q1 | 30.60 | 28.20 | 1.60 | 39.60 |
| 2019Q2 | 30.60 | 28.20 | 1.60 | 39.60 |
| 2019Q3 | 30.40 | 28.20 | 1.70 | 39.70 |
| 2019Q4 | 30.60 | 28.20 | 1.70 | 39.50 |
| 2020Q1 | 29.20 | 29.60 | 1.80 | 39.40 |
| 2020Q2 | 29.90 | 29.30 | 2.00 | 38.80 |
| 2020Q3 | 30.00 | 29.40 | 2.10 | 38.50 |
| 2020Q4 | 30.60 | 29.00 | 2.20 | 38.20 |
| 2021Q1 | 30.70 | 29.10 | 2.30 | 37.90 |
| 2021Q2 | 30.80 | 29.20 | 2.30 | 37.70 |
| 2021Q3 | 30.80 | 29.50 | 2.40 | 37.30 |
| 2021Q4 | 30.90 | 29.50 | 2.40 | 37.20 |
| 2022Q1 | 30.50 | 30.20 | 2.50 | 36.80 |
| 2022Q2 | 29.40 | 31.30 | 2.70 | 36.60 |
| 2022Q3 | 29.50 | 31.40 | 2.70 | 36.40 |
| 2022Q4 | 29.90 | 31.10 | 2.60 | 36.40 |
| 2023Q1 | 30.10 | 30.80 | 2.60 | 36.50 |
| 2023Q2 | 30.10 | 30.90 | 2.60 | 36.40 |
| 2023Q3 | 29.90 | 31.10 | 2.50 | 36.50 |
| 2023Q4 | 30.30 | 30.60 | 2.50 | 36.60 |
| 2024Q1 | 30.60 | 30.50 | 2.50 | 36.40 |
| 2024Q2 | 30.50 | 30.60 | 2.50 | 36.40 |
| 2024Q3 | 30.90 | 30.20 | 2.40 | 36.50 |
| 2024Q4 | 31.00 | 30.10 | 2.50 | 36.40 |
| 2025Q1 | 30.90 | 30.20 | 2.50 | 36.40 |
| 2025Q2 | 31.20 | 30.00 | 2.50 | 36.30 |
| 2025Q3 | 31.60 | 29.50 | 2.50 | 36.40 |
| 2025Q4 | 31.80 | 29.30 | 2.50 | 36.40 |
| 2026Q1 | 31.60 | 29.60 | 2.50 | 36.30 |
The implied 91st–99th column is 100 minus the three published shares — a sanity check, not a fourth source: it sits in [33.9, 40.1] every quarter since 1989, confirming the three series are shares of one total.
Method. Sources: FRED keyless fredgraph.csv pulls, 2026-09-12 — FRBATLWGT12MMUMHWGWD76WP (“12-Month Moving Average of Unweighted Median Hourly Wage Growth: Wage Distribution: 76th to 100th Wage Percentile”), FRBATLWGT12MMUMHWGWD1WP (same, 1st to 25th), WFRBST01134 / WFRBSN40188 / WFRBSB50215 (DFA shares of net worth held by the top 1%, 50th–90th, and bottom 50%). Gap = top minus bottom quartile, points. The tracker follows individual workers matched in the CPS 12 months apart and bins them on the prior-year wage distribution — “bottom quartile” means workers who were low-paid a year ago; the published series is already the 12-month moving average and is used as published, not re-smoothed. Window 2019-01–2026-08 (n=91 published months; October 2025 absent at source and left as a hole — the gap line is drawn in two segments so the hole stays visible). Split at 2025-01: the first month of the new administration, and within three months of the data’s own first positive month (2024-10) — the split was therefore located partly by looking, which makes the interaction p-values somewhat optimistic; the 2024-07 and 2024-10 split sensitivities are reported and do not change any verdict. Because each month of a 12-month MA shares 11 underlying observations with its neighbor, every headline number carries three error models: classical OLS, Newey-West HAC (bandwidth 13; 24 as sensitivity, which moved nothing reported), and the stratified year-block bootstrap. The wealth fits are quarterly, NW-HAC(4), and are never pooled with the monthly wage fit — different unit, different frequency.
Limits, stated plainly. 1. The post era is two years old. 19 monthly points, 2 year-blocks, 8 months of 2026: every “is the narrowing real” question is underpowered by an order of magnitude, and the desk reports the closing as a level fact while declining to certify it as a trend. 2. The MA is the series. The unsmoothed monthly tracker medians by quartile are not published on FRED (the desk tried two candidate IDs; both miss), so the serial correlation cannot be designed away — only corrected for, three ways, as above. 3. What the tracker is not. Hourly-wage job-stayers in the CPS: it excludes the self-employed and salaried-only earners, and a median of individual growth rates is not the growth of any wage bill — the level gap between quartiles is a different measurement this run does not make. 4. The wealth data end at 2026Q1 (the DFA’s publication lag), two quarters before the statement being tested. 5. Shares are zero-sum: the three published series must sum against the omitted 91st–99th band, whose residual move (−3.3 points over the window) is arithmetic, not an independent finding. 6. No attribution. The desk certifies when the gap moved, not why — nothing here assigns the 2025 step to policy, labor-market cooling, or composition, and the claim’s other arms (spending, employment by income) are not tested.
Download the monthly wage data (CSV, 355 rows) · the quarterly wealth data (CSV, 147 rows) · stats-539.json
