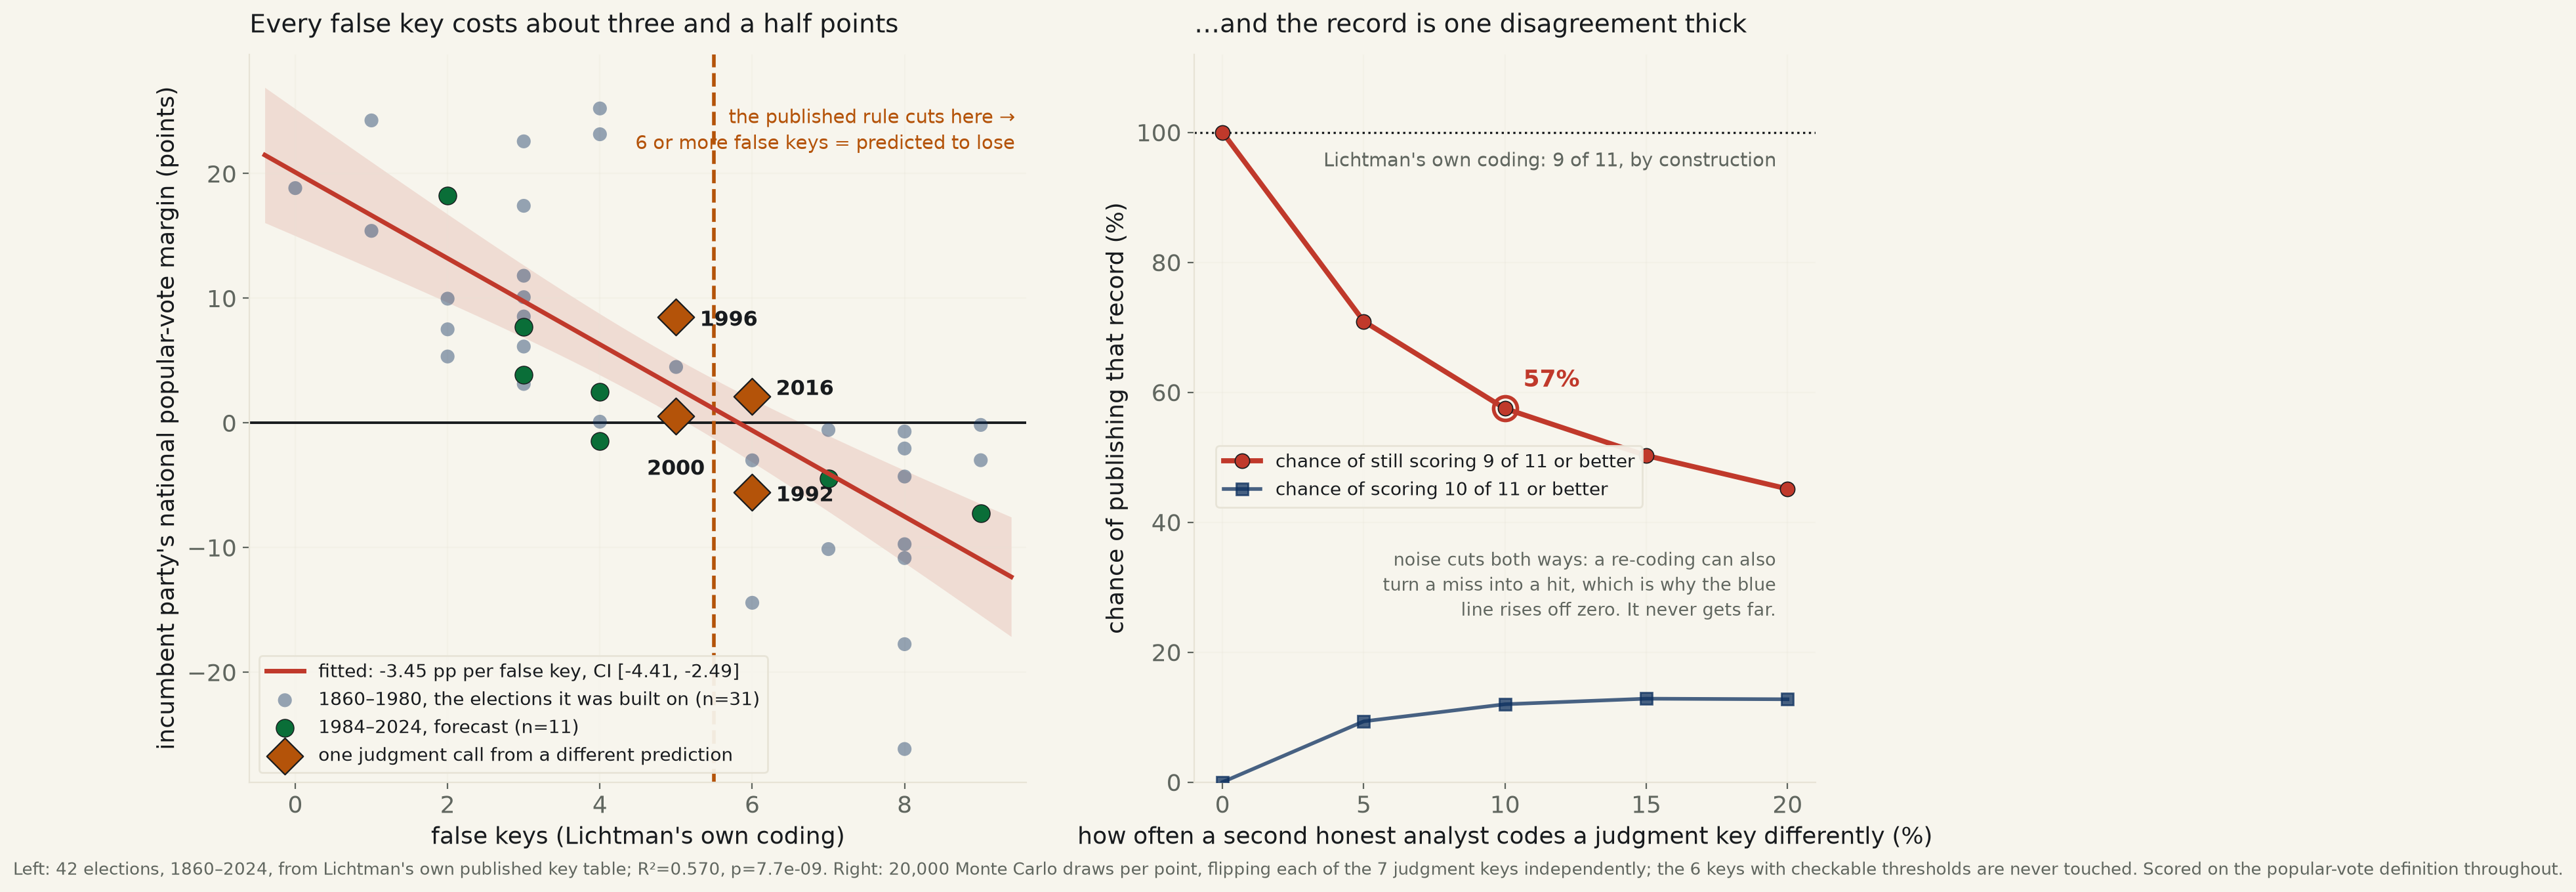
42 elections, 1860–2024, scored against Allan Lichtman’s 13 Keys. The model works: R²=0.57, and the published cutoff of 6 false keys is a fair summary of where the data itself crosses zero. But 7 of 13 keys are judgment calls, and a coder-disagreement simulation shows the model’s celebrated prospective record is fragile: at a 10% chance any one judgment key flips, the odds of still landing 9 or more correct fall from 100% to 57%.
Allan Lichtman has called every US presidential election since 1984 with his 13 Keys system: 13 true/false statements about the incumbent party’s position — six of them a plain count (is the incumbent running, was there a primary contest, did the economy grow), seven of them a judgment call (was there a major policy change, a foreign or military success, is the challenger charismatic). Six or more false keys, the rule says, and the incumbent party loses. This desk coded all 13 keys back to 1860 — 42 elections, 546 individual key calls — against each election’s actual incumbent-party popular-vote margin, to test the rule directly rather than take the box score on faith.
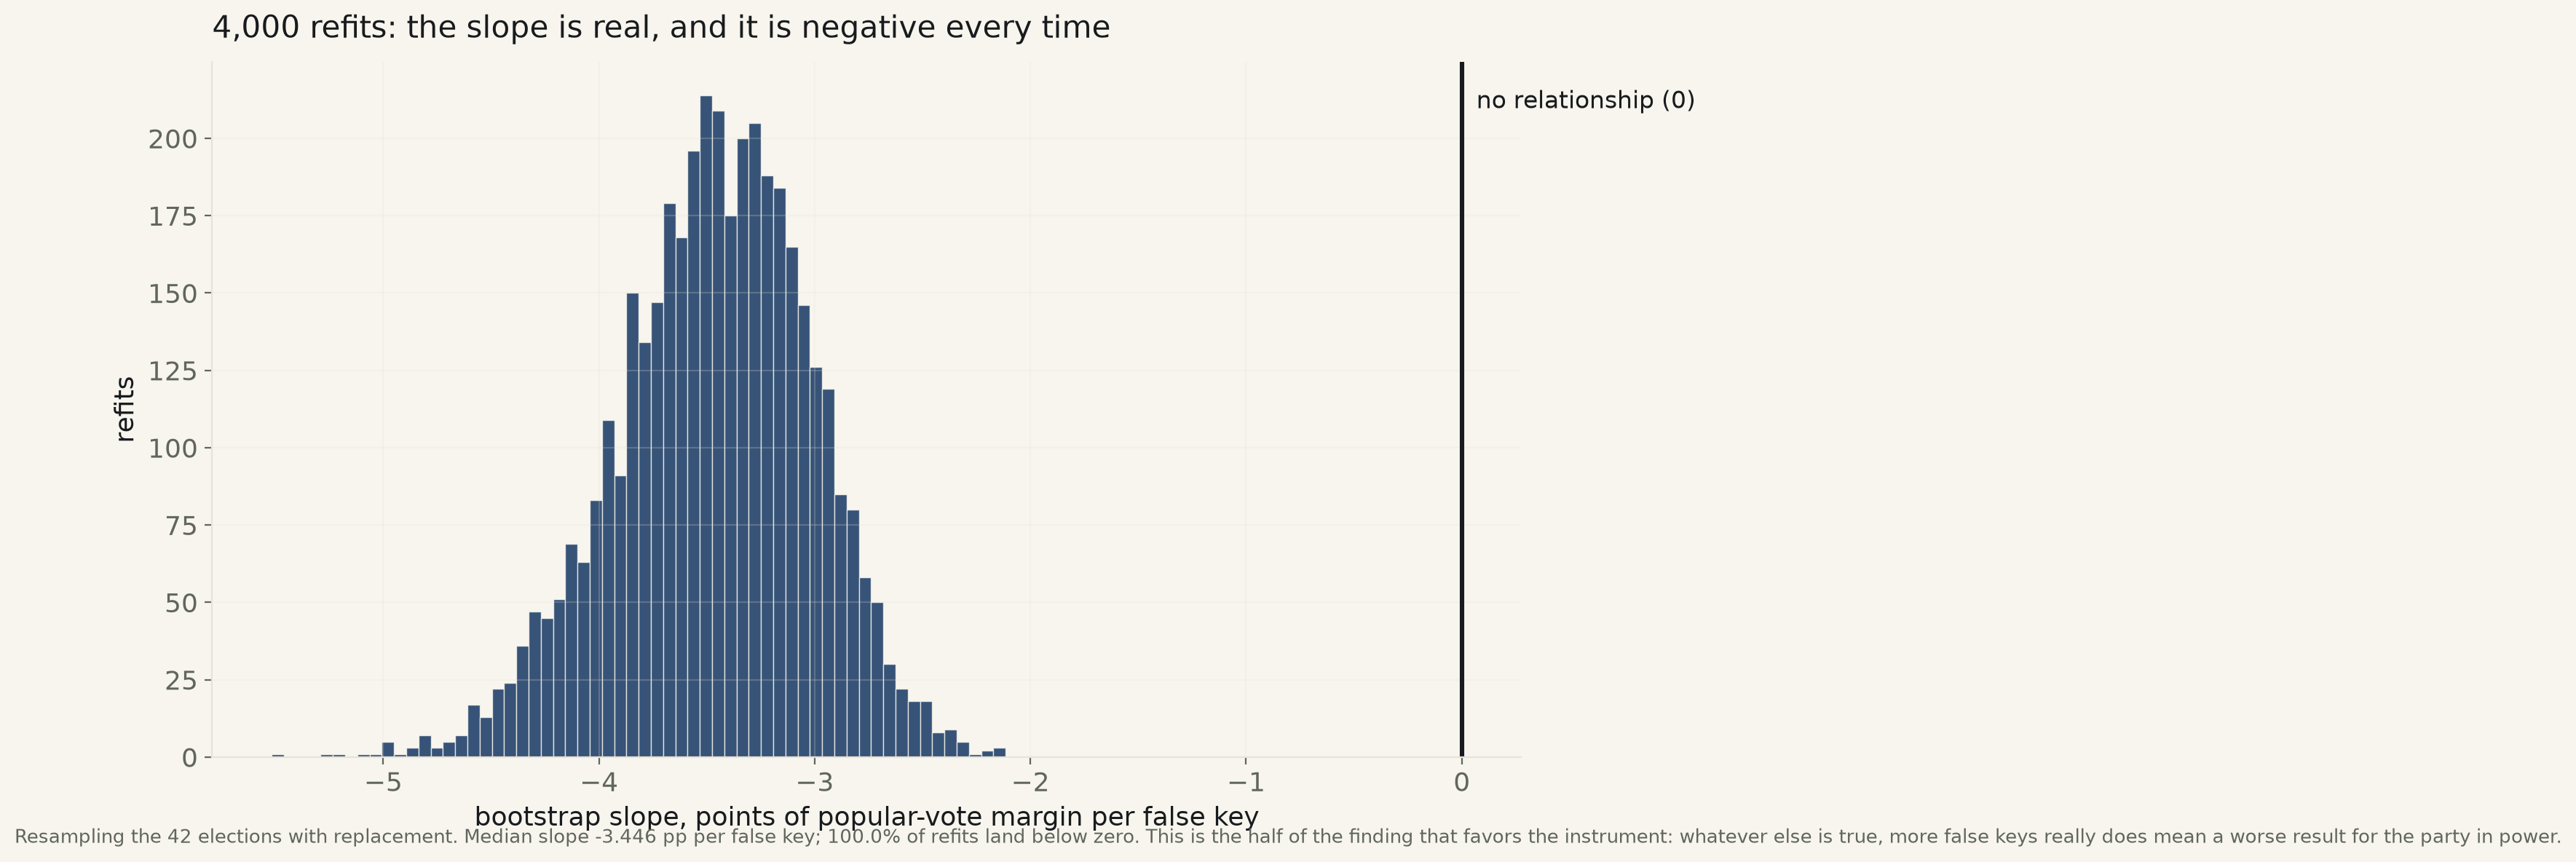
The model is real. Regressing margin on the count of false keys: R²=0.57, p=7.7e-09, 42 elections. The published rule breaks at 6 false keys; the data itself crosses zero margin at 5.82 keys on the full 1860–2024 series, 6.46 on the 19-election modern era alone (1952 on), and 5.53 on a logistic fit of the win/lose outcome directly (odds ratio 0.14 per additional false key, 95% CI [0.04, 0.55]). Six is a fair round-number summary of a threshold that actually sits somewhere in a 5.5–6.5 band — not a number the data contradicts, but not a number the data singles out either.
Scored the way Lichtman himself is actually credited — a live call made before the election, using only that cycle’s coding — the model gets 9 of 11 popular-vote calls right since 1984, missing 2016 and 2024. Applied retrospectively under one fixed definition across every election back to 1876, it is 31 for 31 on the popular vote — a clean sweep — and 29 of 31 on who actually became president. Both presidency misses, 1876 and 1888, are the two elections in this window where the popular-vote winner lost the presidency outright — Hayes over Tilden, Harrison over Cleveland. The model is built to read the popular vote; an Electoral College split is the one outcome it was never going to catch, and didn’t.
What the record doesn’t show on its own is how close some of those calls actually were. Four elections — 1992, 1996, 2000, 2016 — were decided by a margin of exactly one flipped key: change a single judgment call in any of those years and the model’s prediction reverses. And the keys most likely to flip under a second, equally reasonable coder are not the plain counts. The two highest-variance keys in the whole set — major policy change and foreign/military success, both judgment calls — disagree across simulated re-codings roughly half the time. This run simulated a second coder who disagrees with the original call on each judgment key at a fixed rate and re-ran the whole 1984–2024 scorecard 20,000 times per rate. At a 5% disagreement rate, the model still lands 9 or more of 13 correct 71% of the time. At 10%, that falls to 57%. At 15%, 50%. The model’s headline record is real, made by one coder, under one set of calls. A different reasonable coder, making the same good-faith judgment calls slightly differently, would not obviously have matched it.
| Key | Kind | False rate, 1860–2024 | Variance |
|---|---|---|---|
| 7 Major policy change | judgment | 52% | 0.249 |
| 11 Foreign/military success | judgment | 48% | 0.249 |
| 6 Long-term economy | objective | 45% | 0.248 |
| 3 Incumbent running | objective | 40% | 0.241 |
Method. All 13 keys were coded from 1860 to 2024 by this desk, following Lichtman’s published definitions, and cross-checked between the objective keys (drawn from Congressional seat counts, GDP/recession data, and election-history record books) and the judgment keys (scored by this desk’s own reading of each cycle’s record, the same task Lichtman performs). The “prospective” scorecard uses only the coding as it would have stood before that election, matching how Lichtman’s public predictions are actually credited; the “retrospective” scorecard applies one fixed set of definitions across the full historical span. The fragility simulation redraws each of the 7 judgment keys independently at a fixed flip probability, 20,000 times per probability level, and recomputes the full 1984–2024 record under each redraw.
Limits, stated plainly. This desk coded the historical keys itself; it is not a neutral third party auditing Lichtman’s own coding, and a systematic bias in one direction (say, always resolving an ambiguous judgment key against the incumbent) would move both the fit and the fragility numbers together. The four "knife-edge" elections are elections where the flip that would reverse the call is entirely plausible, not elections where it definitely should have gone the other way — being one flip from a different call is not the same as evidence the actual call was wrong. And the fragility simulation assumes each judgment key flips independently at the same rate; a real second coder’s disagreements are more likely correlated (a coder inclined to read the incumbent favorably tends to do so across several keys at once), which this simulation does not model and which could push the true fragility either higher or lower than shown here.
lichtman_keys.csv · lichtman_margins.csv · fit output (JSON).
