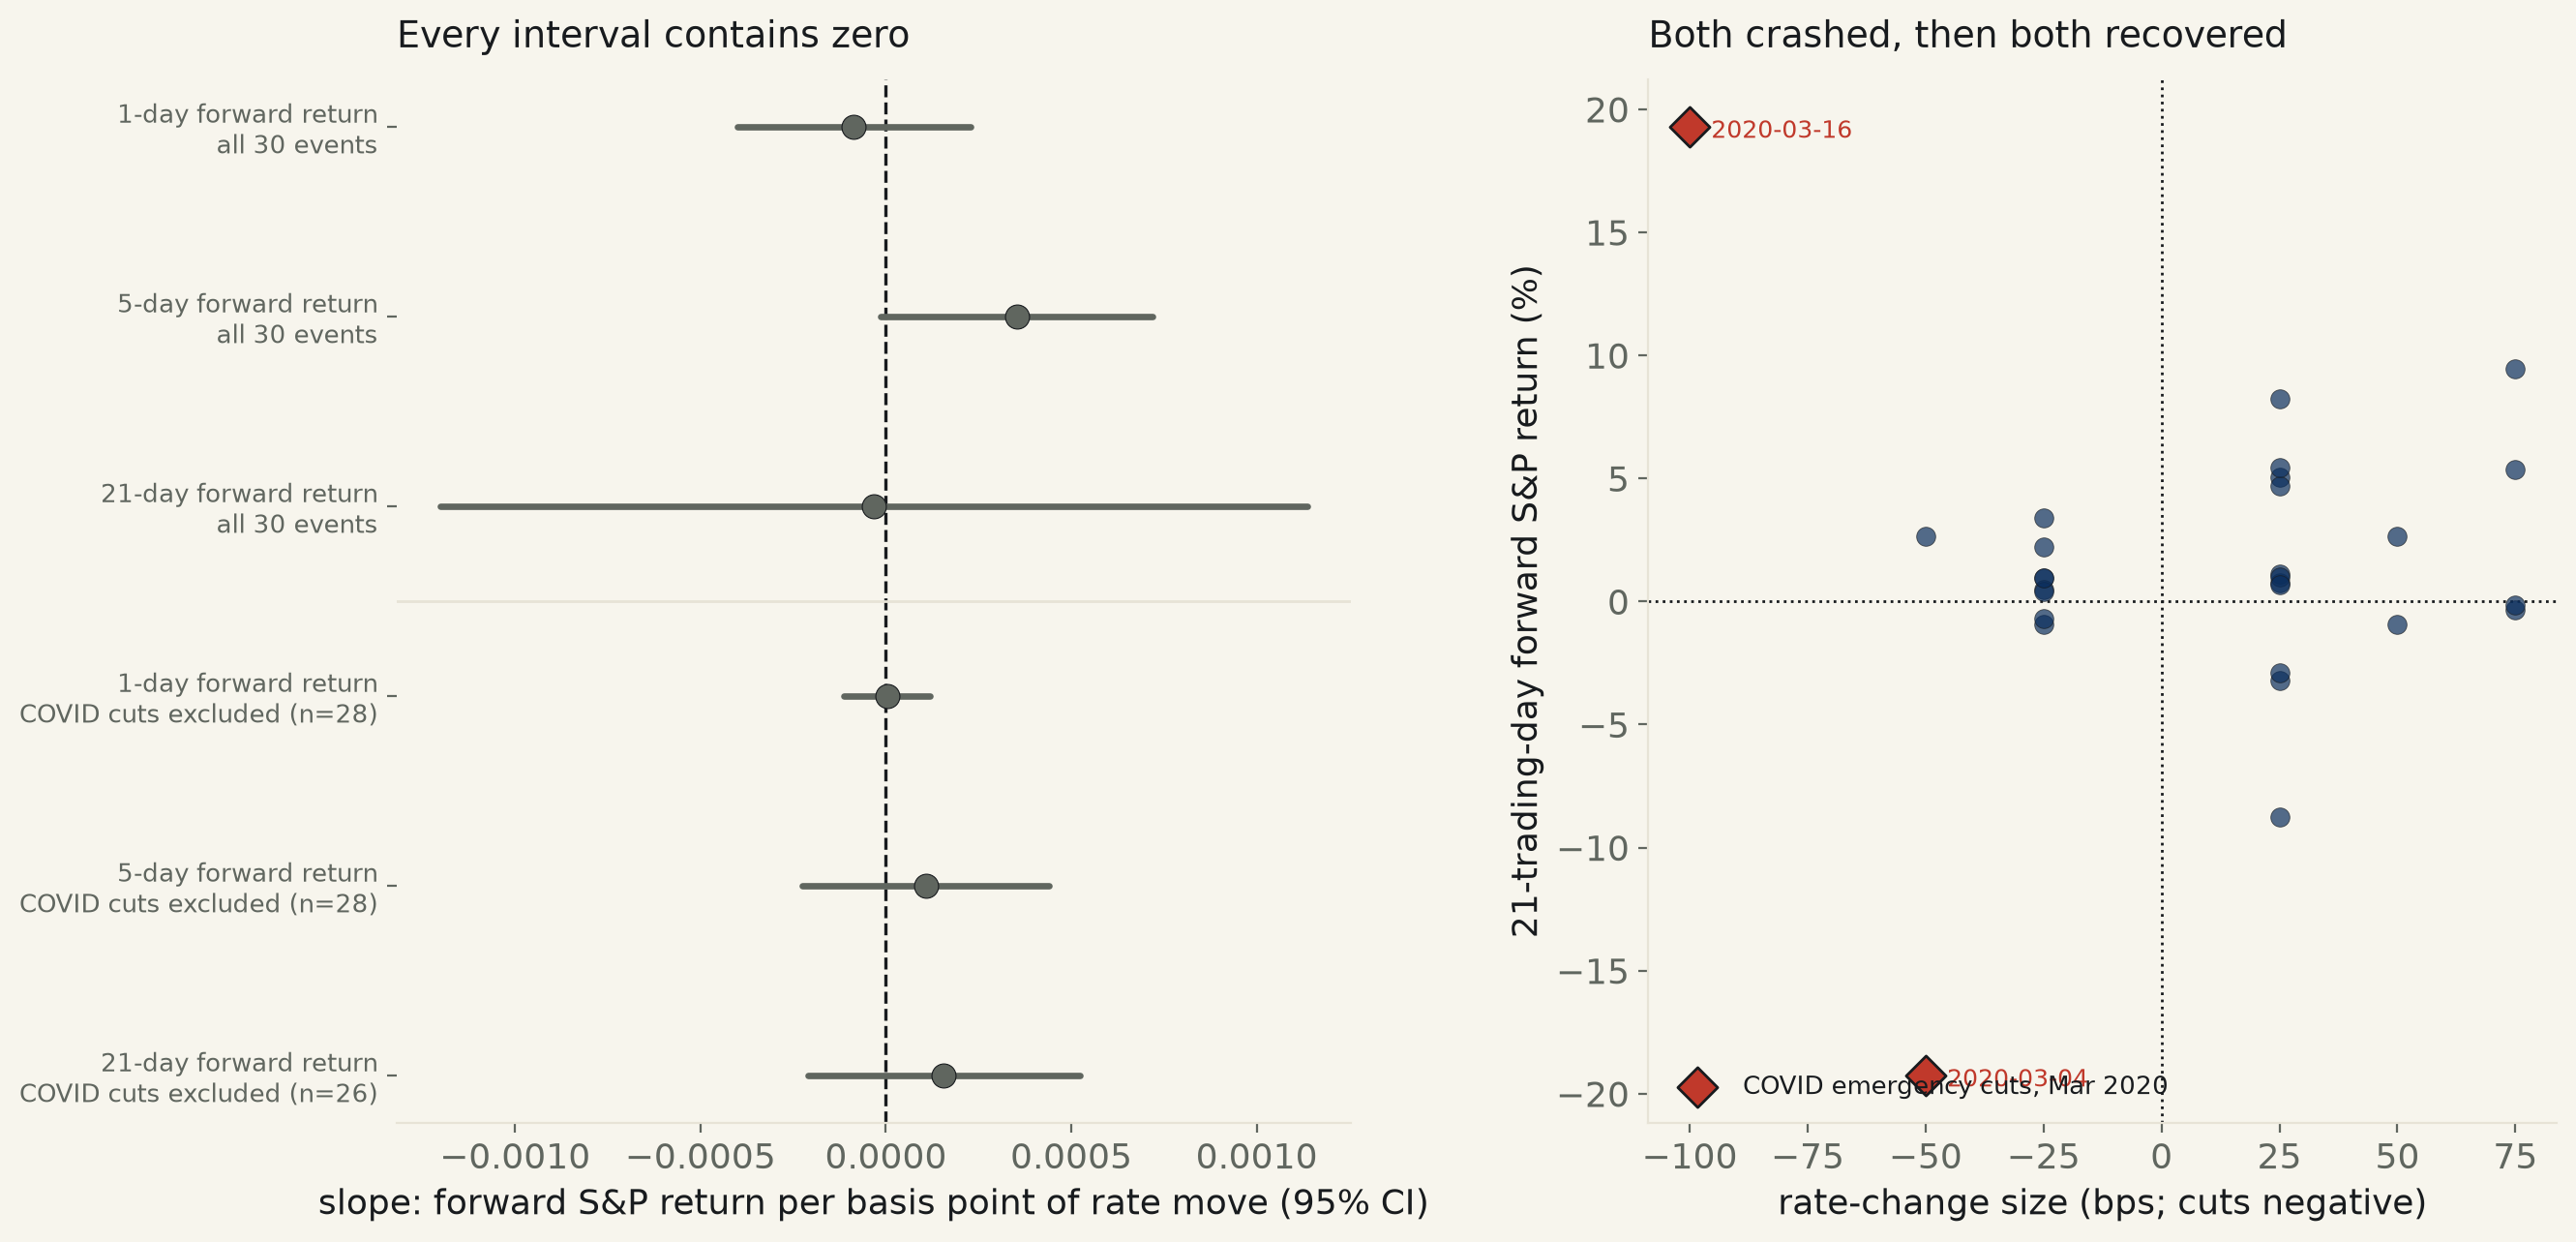
30 Fed rate-change decisions since 2016 (19 hikes, 11 cuts), read directly off FRED's own daily federal-funds target-range series, paired with S&P 500 forward returns at 1, 5, and 21 trading days. No horizon shows a cut predicting a bigger rally — every confidence interval contains zero. The closest thing to a signal (5-day, p=0.06) runs in the wrong direction and turns out to be two data points from a single week in March 2020.

"The Fed put" is the market's own shorthand for a belief, not a hedge fund's model: that the Federal Reserve cutting interest rates reliably rescues stock prices, so equities can lean on the central bank whenever things get bad enough. It is testable directly, because the Fed's own daily record of its federal-funds target range (FRED's DFEDTARU/DFEDTARL, published since it began targeting a range in December 2008) marks the exact date of every rate decision, and every level change in that series is a real, dated, public event — not a hand-typed calendar that could mistranscribe a meeting date. Paired with FRED's own S&P 500 daily closes (coverage begins 2016-08-12), that gives 30 rate-change decisions to test — 19 hikes and 11 cuts, 2016-12-14 to 2025-12-11 — each with the market's own trading-day-aligned forward return at three horizons: 1, 5, and 21 trading days out.
None of the three horizons shows a cut predicting a bigger rally. The 1-day slope is -0.000086 (95% CI [-0.000400, +0.000229], p=0.59) and the 21-day slope is -0.000033 (CI [-0.001202, +0.001136], p=0.96) — both dead center on zero. The 5-day horizon comes closest to significance (slope +0.000353, CI [-0.000014, +0.000719], p=0.059) — still contains zero by this desk's rule — and its sign runs against the folklore: a positive slope means bigger hikes (not bigger cuts) were followed by better 5-day returns in this sample, the opposite of what a Fed put would predict.
That near-miss does not survive its own two biggest points. The two emergency cuts of March 2020 — 50 bps on the 4th, then 100 bps on the 16th, as the market was already in COVID-crash freefall — are the most extreme rate moves and the most extreme forward returns in the whole sample: the March 4th cut was followed by a -19.3% 21-day return (the market kept falling before it found a bottom), the March 16th cut by a +19.3% 21-day return (the rebound). Exclude just those two dates and every slope collapses further toward zero and further from significance: 5-day slope +0.000108, CI [-0.000225, +0.000440], p=0.53. The one specification that came close to a finding was two data points from a single week of a global pandemic, not a general rule about rate cuts.
A simpler, cruder comparison — ignore the size of the move, just ask whether the 20 trading days after a cut differ from the 20 after a hike — tells the same story. Mean return after cuts vs after hikes: +0.27% vs +0.00% at 1 day (p=0.72), -1.90% vs +0.25% at 5 days (p=0.15), +0.86% vs +1.65% at 21 days (p=0.78). Every gap's confidence interval contains zero.
| specification (return per bps of rate move) | slope | 95% CI | p | n | verdict |
|---|---|---|---|---|---|
| 1-trading-day forward return, all events | -0.000086 | [-0.000400, +0.000229] | 0.59 | 30 | contains 0 |
| 5-trading-day forward return, all events | +0.000353 | [-0.000014, +0.000719] | 0.06 | 30 | contains 0 |
| 21-trading-day forward return, all events | -0.000033 | [-0.001202, +0.001136] | 0.96 | 28 | contains 0 |
| 1-trading-day forward return, COVID cuts excluded | +0.000003 | [-0.000113, +0.000119] | 0.96 | 28 | contains 0 |
| 5-trading-day forward return, COVID cuts excluded | +0.000108 | [-0.000225, +0.000440] | 0.53 | 28 | contains 0 |
| 21-trading-day forward return, COVID cuts excluded | +0.000156 | [-0.000211, +0.000524] | 0.40 | 26 | contains 0 |
| horizon | mean, after cuts | mean, after hikes | gap | 95% CI | p |
|---|---|---|---|---|---|
| 1-trading-day forward return | +0.27% | +0.00% | +0.27 pts | [-1.31, +1.85] pts | 0.72 |
| 5-trading-day forward return | -1.90% | +0.25% | -2.15 pts | [-5.14, +0.84] pts | 0.15 |
| 21-trading-day forward return | +0.86% | +1.65% | -0.80 pts | [-6.93, +5.33] pts | 0.78 |
Method. Event dates are not hand-curated: they are every date on which FRED's DFEDTARU or DFEDTARL (the Fed's own published upper/lower target-range bounds, daily since 2008-12-16) changed level, restricted to 2016-01-01 onward so every event falls inside FRED's own SP500 coverage window (starts 2016-08-12). Forward returns are computed by anchoring to the first S&P trading day on or after the event date, then reading the close k trading days later (k=1, 5, 21); events too close to the end of the S&P series to have a full 21-day forward window are dropped from that horizon only (n falls from 30 to 28 at k=21). All slope regressions are OLS with heteroscedasticity-robust (HC3) standard errors, this desk's house method.
Limits, stated plainly. n=30 rate-change events (11 cuts) is a small sample for detecting anything but a large effect, and this run cannot rule out a real but modest Fed-put effect this data is simply underpowered to see — it can only say that none of six specifications finds one. This tests target-range changes, not FOMC meetings that held rates steady (a "hold" carries information too, particularly a hold after a hiking cycle, and is not part of this design). The 2016–2026 window is one that includes exactly one systemic-crisis rate-cut episode (COVID, March 2020); a longer sample spanning more crisis and non-crisis cutting cycles (2001, 2007-08) would test the claim more thoroughly but would require a pre-2016 S&P daily series this run did not pull. And an event study cannot separate "the cut helped" from "the cut and a dozen other things happened in the same month" — it can only say whether, across 30 independent decisions, bigger cuts are reliably followed by bigger rallies, and in this data they are not.
fed_target_rate.csv · sp500_fred_daily.csv · fit output (JSON).
