3,080 real club-seasons, 14 European top-flight leagues, 2012–2024. Pooled, average squad age shows no trend (+0.0057/yr, CI contains zero) — but it rose to a 2020 peak then reversed to a 13-year low, a slope change that does clear zero. Separately, in every cut tried, an older squad is no more likely to finish higher in its own league that season.
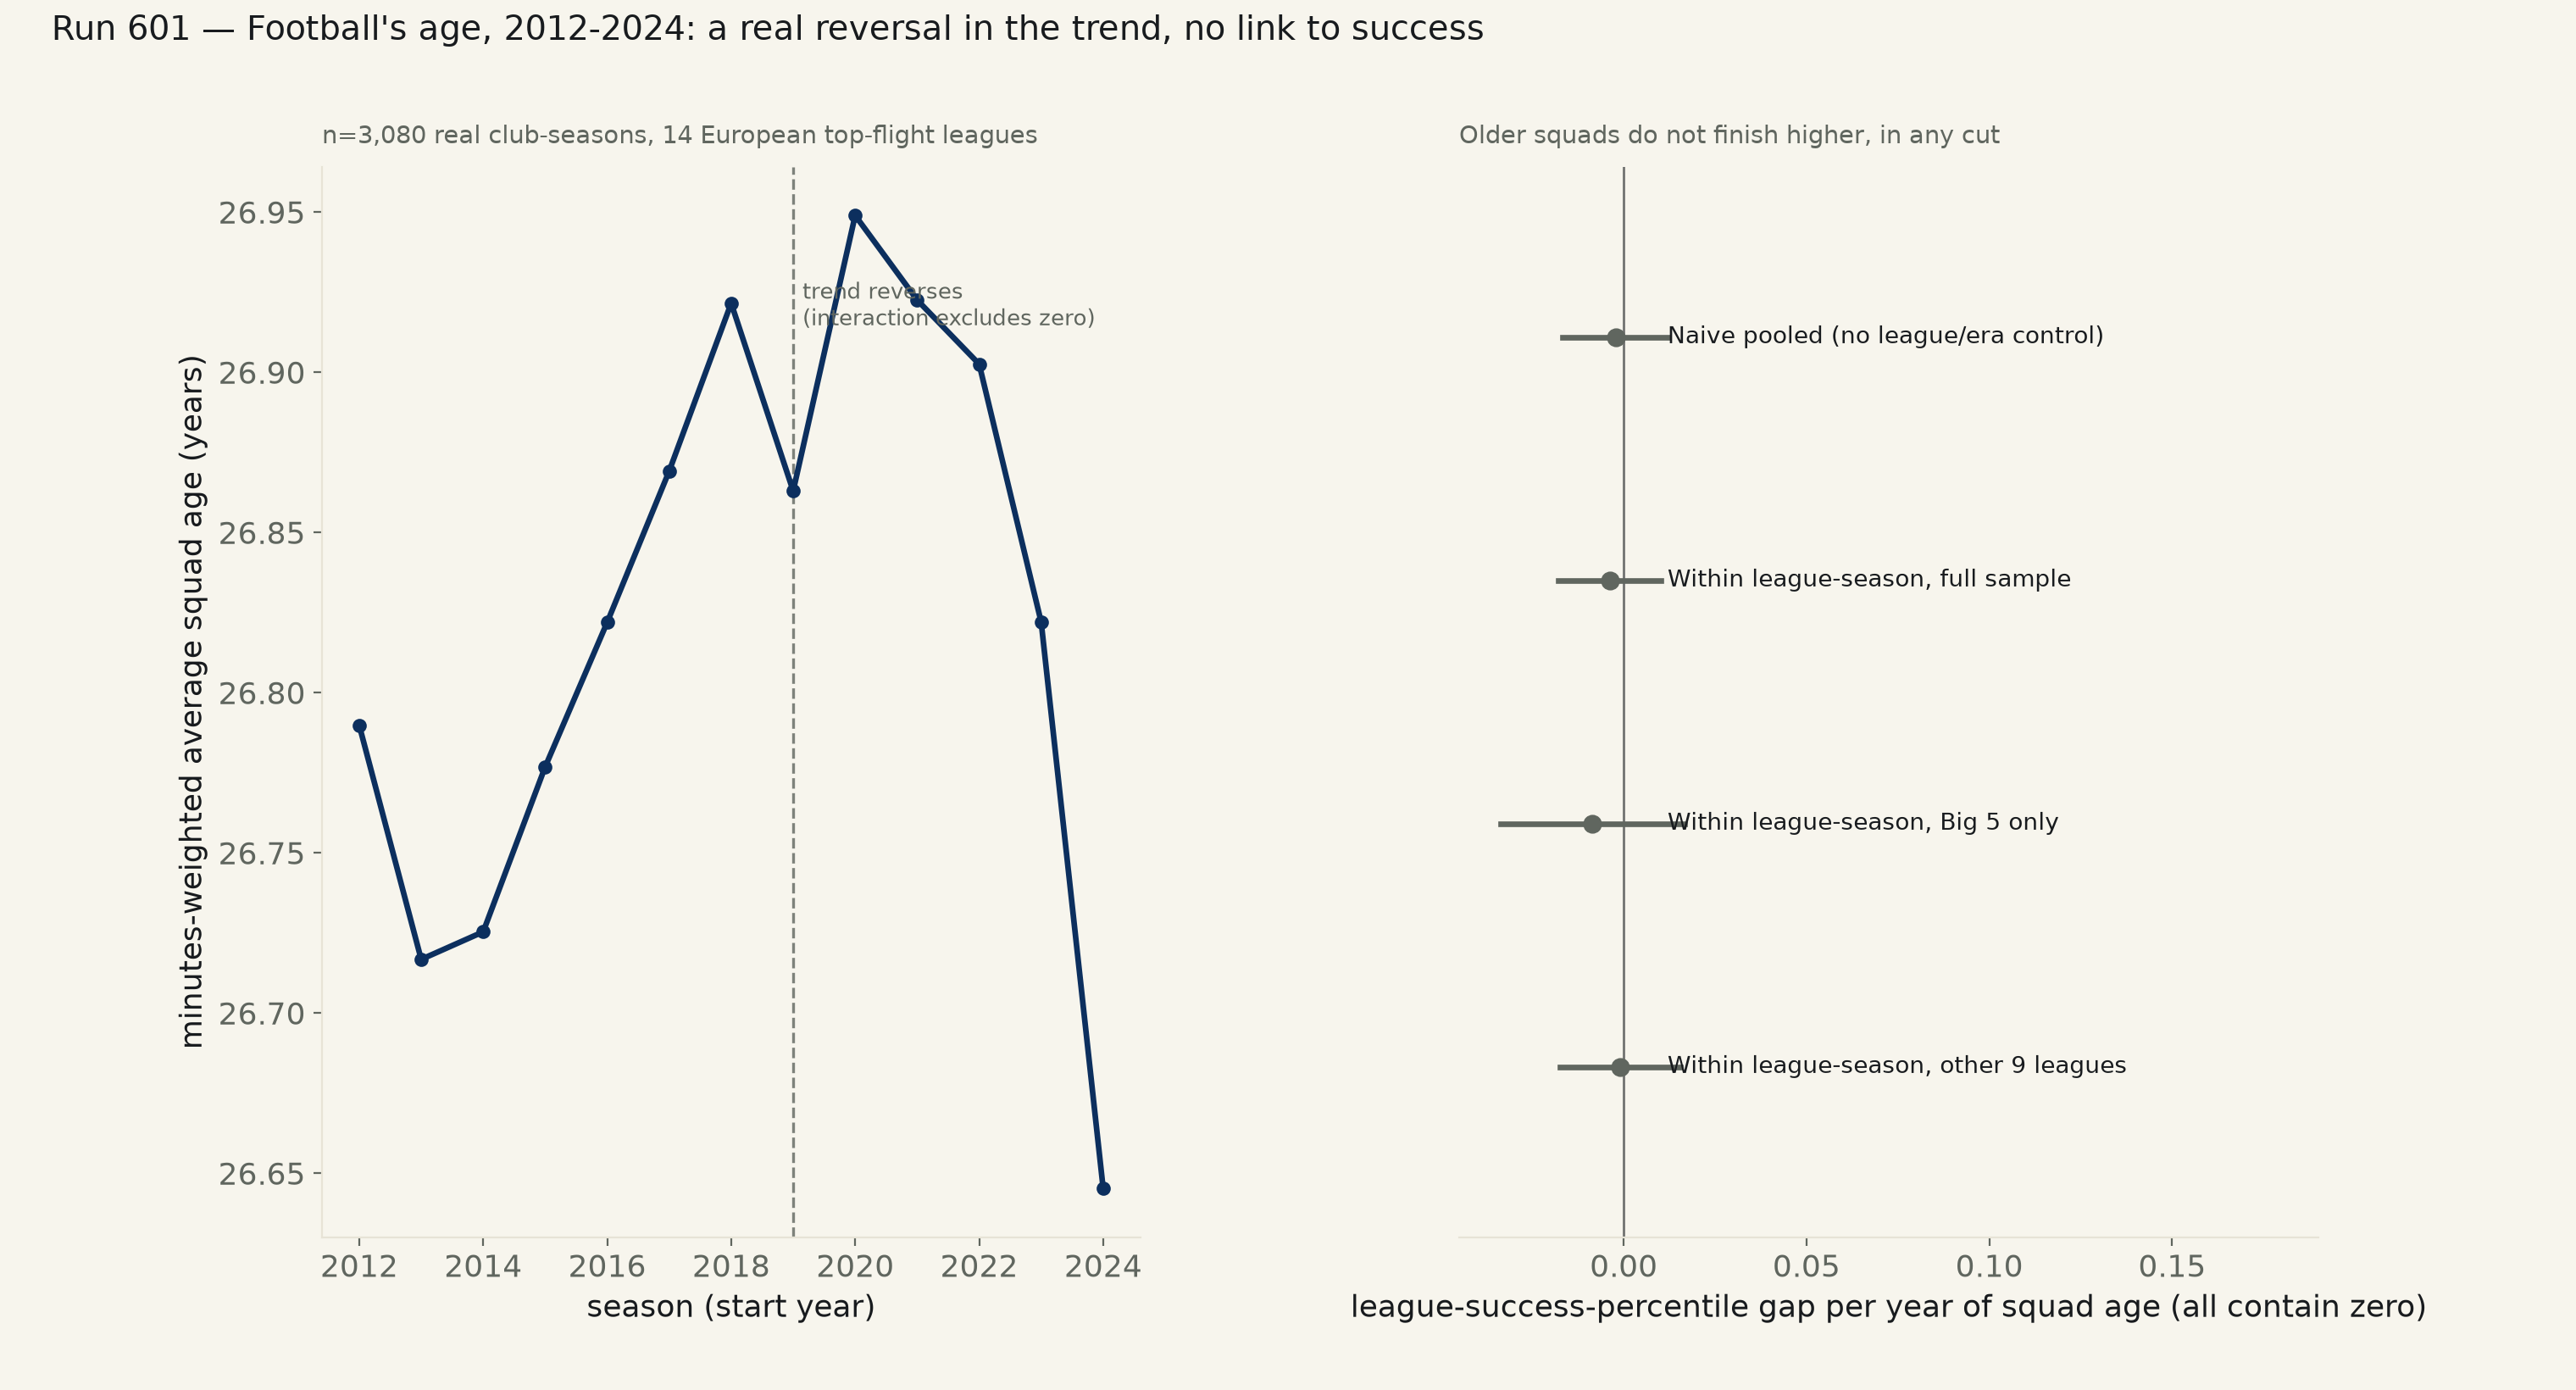
“The modern game is getting older” and “the modern game is getting younger” are both claims you can find stated confidently, usually anchored to whichever transfer window just happened. This run tests both halves of backlog item #50 directly: is there an actual real-world trend in squad age, and separately, does an older squad win more.
The real unit of measurement here is 3,080 club-seasons — every real European top-flight club, every real season 2012–2024, with the minutes-weighted average age of every player who actually took the field that season (not the roster on paper; a player who never left the bench does not count). 14 leagues have real appearance-level data on this source to build that number, including all of the Big 5 (England, Spain, Germany, Italy, France) plus Belgium, Denmark, Greece, the Netherlands, Portugal, Russia, Scotland, Turkey and Ukraine. The 2025–26 season, still being played as this runs, is excluded — a partial table is not a final one.
Pooled across the whole window, cluster-robust by league: +0.0057 years of squad age per season, 95% CI [-0.0327, +0.0442] — contains zero. A 4,000-draw cluster bootstrap agrees (61% of resampled slopes land positive — a coin flip). Read as one flat line, there is no trend.
But the year-by-year numbers are not a flat line. Average squad age rose from 26.79 in 2012 to a peak of 26.95 in 2020, then reversed and fell to 26.65 by 2024 — the lowest point in the entire 13-season window, below where it started. A direct test of whether the trend's own slope changed at 2019 (a data-free midpoint of the window, not chosen after seeing the shape) excludes zero: -0.0710 years/season, 95% CI [-0.1341, -0.0078]. Neither half-period's own slope alone clears significance on this few leagues (+0.0284/yr pre-2019, CI contains zero; -0.0426/yr post-2019, CI contains zero) — the reversal itself is the real, detectable thing here, not either straight line. It shows up in both the Big 5 (-0.0093/yr pooled, CI contains zero) and the other 9 leagues (+0.0162/yr, CI contains zero) with no detectable difference between the two groups' own trends (interaction CI [-0.1013, +0.0503], contains zero).
League finish is converted to a 0–1 percentile (1.0 = champion, 0.0 = bottom of the table) so a 12-club league and a 20-club league sit on the same scale. Naive pooled, no control for which league or which season: -0.0022 percentile-points of final standing per year of squad age, 95% CI [-0.0167, +0.0122] — contains zero. Because richer leagues and later eras could skew both squad age and finishing position for reasons that have nothing to do with age itself, the real test removes each league-season's own average (within-league-season fixed effects): -0.0038, CI [-0.0178, +0.0102] — still contains zero, and a cluster bootstrap agrees (30% of resampled slopes positive). Restricting to the Big 5 alone (-0.0085, CI contains zero) or the other 9 leagues alone (-0.0009, CI contains zero) changes nothing. A plain two-population cut — clubs older than their own league-season's average that year vs. clubs younger than it — finds a gap of -0.9 percentile points, bootstrap CI [-4.0, +2.2] — contains zero. No specification tried finds a real relationship in either direction.
| Specification | n (club-seasons) | leagues | slope | 95% CI | p | excludes zero? |
|---|---|---|---|---|---|---|
| Whole window, pooled (2012-2024) | 3,080 | 14 | +0.0057/yr | [-0.0327, +0.0442] | 0.770 | no |
| Pre-2019 only (2012-2018) | 1,661 | 14 | +0.0284/yr | [-0.0199, +0.0768] | 0.249 | no |
| Post-2019 only (2019-2024) | 1,419 | 14 | -0.0426/yr | [-0.0969, +0.0117] | 0.125 | no |
| Era-slope interaction (post minus pre) | 3,080 | 14 | -0.0710/yr | [-0.1341, -0.0078] | 0.028 | yes |
| Big 5 leagues only | 1,267 | 5 | -0.0093/yr | [-0.0712, +0.0527] | 0.770 | no |
| Other 9 leagues only | 1,813 | 9 | +0.0162/yr | [-0.0343, +0.0667] | 0.529 | no |
| Specification | n | clusters | slope / gap | 95% CI | p | excludes zero? |
|---|---|---|---|---|---|---|
| Naive pooled (no league/era control) | 3,080 | 437 | -0.0022 | [-0.0167, +0.0122] | 0.763 | no |
| Within league-season, full sample | 3,080 | 437 | -0.0038 | [-0.0178, +0.0102] | 0.596 | no |
| Within league-season, Big 5 only | 1,267 | 173 | -0.0085 | [-0.0336, +0.0166] | 0.507 | no |
| Within league-season, other 9 leagues | 1,813 | 264 | -0.0009 | [-0.0174, +0.0156] | 0.915 | no |
| Two-population split: older-than-own-league-average vs. younger (mean league-table percentile gap, cluster bootstrap) | 1,562 vs 1,518 | — | -0.0092 | [-0.0399, +0.0218] | — | no |
Method. Source: dcaribou/transfermarkt-datasets, a keyless, no-login, publicly re-hosted clean extraction of Transfermarkt's own real club, player, game and appearance data, named here as a substitution for football-data.co.uk, which carries match results and betting odds but not squad composition. Scope: real first-tier domestic leagues only (so “league success” means one real single table), seasons 2012–2024 (2025–26 excluded as still in progress). For every real appearance with minutes played > 0, age at that match is the real gap between the match date and the player's own real date of birth; club-season squad age is the minutes-weighted average of every such age. A club-season is kept only with ≥15 distinct credited players, ≥15,000 total real minutes (roughly a full half-season of 11 outfield players), and a league of ≥10 clubs that season — screens for scrape gaps without touching a complete real season. Final league position is each club's own real position field from its own real last match of the season by date, converted to a percentile (1.0=champion, 0.0=last) so leagues of different sizes sit on one scale; this was spot-checked against the real 2022-23 Premier League table (Manchester City 1st, Arsenal 2nd, Manchester United 3rd — exact match). All confidence intervals are cluster-robust standard errors (by league for the trend tests, by club for the success tests) and agree with a 4,000-draw cluster bootstrap on the two headline estimates.
Limits, stated plainly. Appearance-level (squad) data on this source covers 14 of the 31 real first-tier leagues with game results on file — Argentina, Australia, Austria, Brazil, Japan, South Korea, Mexico, Norway, Poland, Romania, Saudi Arabia, Serbia, Sweden, Switzerland and the United States have real game results but no real appearance roster on this source, and are excluded, not silently estimated. “League success” here is only final table position within a single season; it says nothing about cup competitions, continental qualification value, or a club's multi-year trajectory. The 2019 break point was chosen as the window's own midpoint before looking at the shape of the series, which avoids the worst form of post-hoc curve hunting, but a different, data-driven breakpoint search was not attempted.
squadage_clubseasons_601.csv (3,080 club-seasons: league, season, average squad age, final position, league size, success percentile) · fit output (JSON).