19,016 real NBA player-game shot sequences, 513 players, two complete seasons. The textbook test says no hot hand, -9.21 points — but most of that is a known statistical artifact of short sequences, not a real effect, confirmed by a placebo check on synthetic data with zero true effect. Correcting for it leaves -1.42 points, 95% CI [-1.85, -1.01] — a real, small effect, excluding zero, running backward.
“The hot hand” is the belief that a player who has just made a few shots is more likely to make the next one — momentum, rhythm, a hand that's “on.” Gilovich, Vallone & Tversky's famous 1985 paper tested this the obvious way: for each player's own run of shots in a game, compare the hit rate right after a make to the hit rate right after a miss. They found no gap, named it a cognitive illusion, and the finding stood for three decades.
Then Miller & Sanjurjo (2015, Econometrica) found a bug in the obvious way. In any finite sequence, a make uses up one of the few makes still available to follow it — a purely combinatorial fact, true even if every shot is an independent coin flip with no streakiness whatsoever. That makes GVT's own statistic biased negative, sometimes enough to flip a real positive effect into an apparent null. Correcting for it is most of why this backlog item went in tagged “[small REAL effect post-Miller-Sanjurjo]” rather than the textbook debunk.
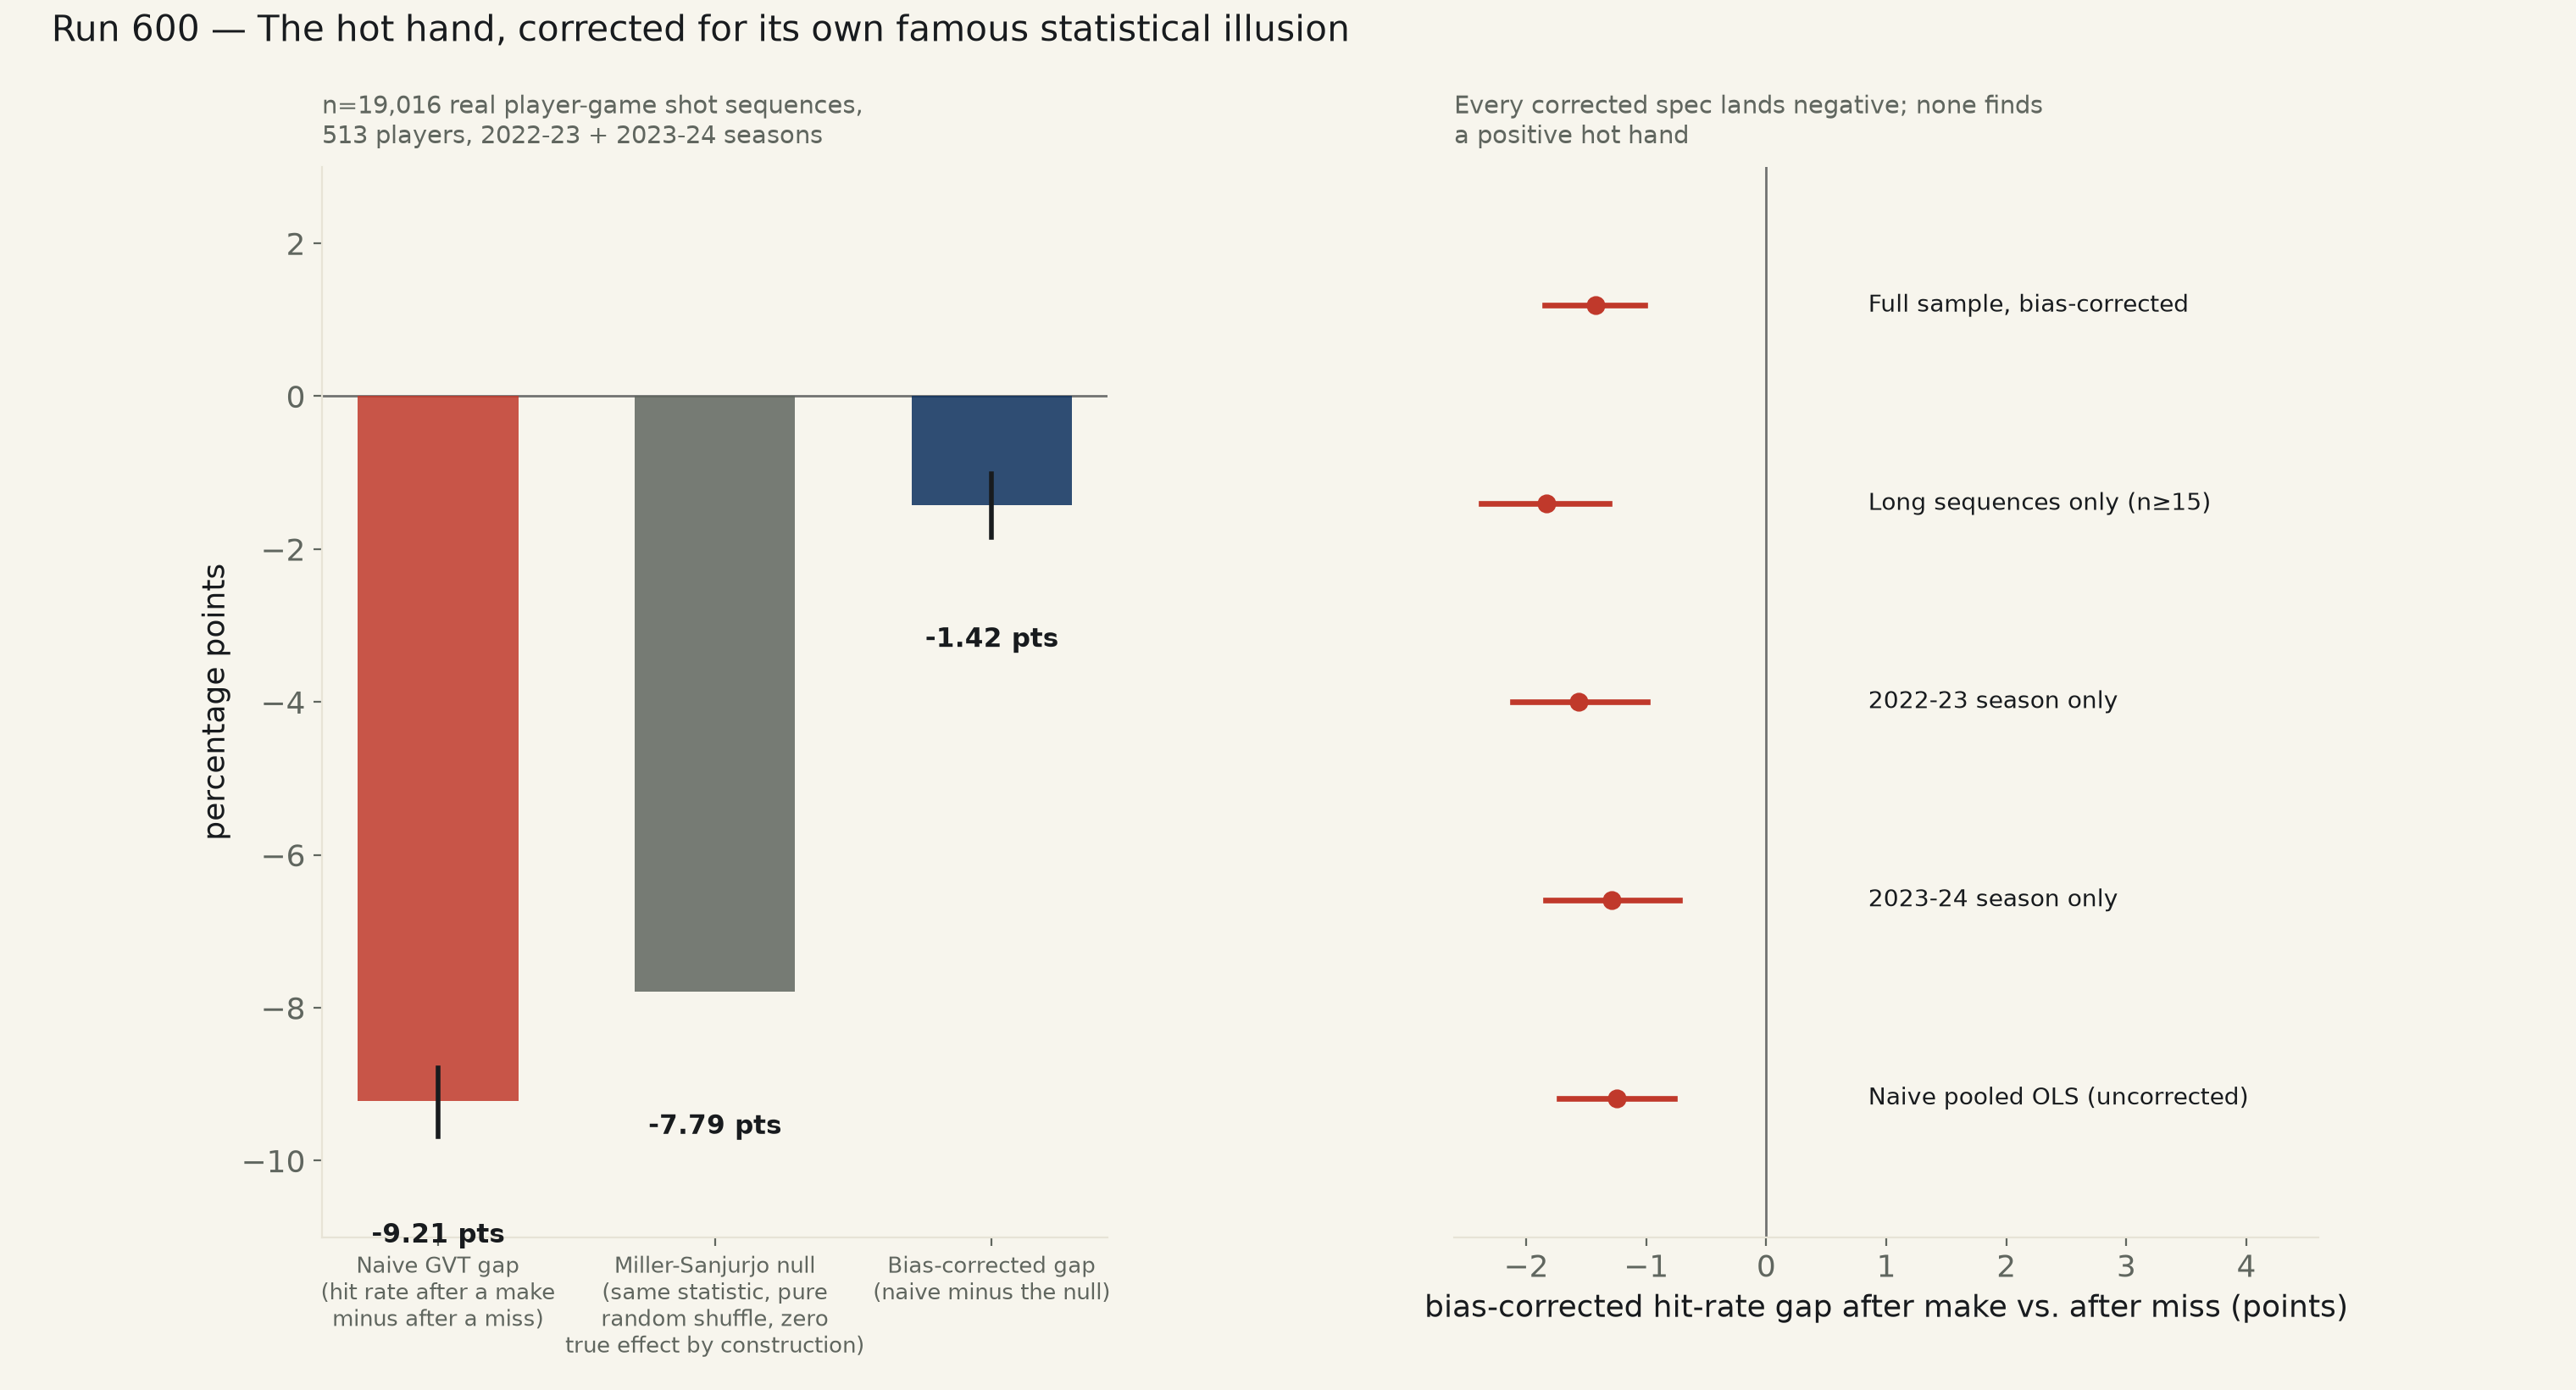
This run rebuilds both halves of that story on 435,919 real shots — every logged field-goal attempt from two complete NBA regular seasons, 2022-23 and 2023-24 — kept as one ordered sequence per player per game using the real in-game event order the league's own play-by-play assigns, restricted to the 19,016 sequences (513 players, 286,172 shots) with at least 10 attempts. First, the naive GVT comparison, run exactly as the original paper ran it: -9.21 points, 95% CI [-9.68, -8.78] — a wide, confident, damning gap, just as the hot-hand skeptics have always reported.
Then the bias itself, isolated directly: for every real (sequence length, number of makes) combination in the data, 2,000 random shuffles of that exact multiset of makes and misses — same length, same hit count, zero true effect by construction — give the identical statistic its own expected value under pure chance: -7.79 points. That is not a real effect; it is pure sequence-length arithmetic, and it accounts for 85% of the naive gap's own size. Subtracting it from the naive gap leaves -1.42 points, 95% CI [-1.85, -1.01] — excludes zero.
A real, small effect survives the correction, exactly as the backlog's own tag predicted. But it runs the wrong way. Correcting for the exact illusion that is supposed to unmask a hidden positive hot hand instead leaves a small, statistically real negative gap: after a make, these 513 real players were slightly less likely to hit their next shot, not more. The correction mechanism itself is validated directly on synthetic data built to have a true effect of exactly zero — coin flips at each player's own real hit rate, same sequence-length mix as the real data: the naive statistic there is just as damning, -7.72 points, but the corrected statistic lands at +0.07 points, 95% CI [-0.29, +0.45] — contains zero, as a correct method must when there is genuinely nothing there. The real data's own corrected interval does not contain zero.
The negative gap holds under restriction to longer sequences, where the finite-sequence bias is smaller to begin with (n≥15: -1.83 points, CI [-2.37, -1.31]), and in both seasons taken separately (2022-23: -1.56 points; 2023-24: -1.29 points) — a direct interaction test finds no detectable difference between the two seasons' own gaps, CI [-0.51, +1.06], contains zero, so this is one consistent small effect, not a one-season fluke. A naive pooled OLS of the next shot on the previous one, cluster-robust by player — a different, cruder method that does not share GVT's exact per-sequence bias — agrees on the direction and the rough size: -1.25 points, CI [-1.72, -0.77].
| Quantity | value | 95% CI | p |
|---|---|---|---|
| Naive GVT gap (hit rate after a make minus after a miss) | -9.21 pts | [-9.68, -8.78] | <1e-15 |
| Miller-Sanjurjo null (identical statistic, pure random shuffle of the same real sequence lengths, zero true effect by construction) | -7.79 pts | — | — |
| Bias-corrected gap (naive minus the null) | -1.42 pts | [-1.85, -1.01] | 1.46e-11 |
| Specification | n | gap | 95% CI | p | excludes zero? |
|---|---|---|---|---|---|
| Full sample, bias-corrected | 19,016 | -1.42 pts | [-1.85, -1.01] | 1.46e-11 | yes |
| Long sequences only, n≥15, bias-corrected | 8,699 | -1.83 pts | [-2.37, -1.31] | 1.44e-11 | yes |
| 2022-23 season only, bias-corrected | 9,446 | -1.56 pts | [-2.12, -0.99] | 7.23e-08 | yes |
| 2023-24 season only, bias-corrected | 9,570 | -1.29 pts | [-1.84, -0.73] | 6.91e-06 | yes |
| Season interaction (2023-24 minus 2022-23) | 19,016 | +0.27 pts | [-0.51, +1.06] | 4.93e-01 | no |
| Naive pooled OLS, uncorrected (shot pairs, cluster-robust by player) | 267,480 | -1.25 pts | [-1.72, -0.77] | 3.31e-07 | yes |
| Placebo: synthetic i.i.d. shots, true effect = 0 by construction, bias-corrected | 18,779 | +0.07 pts | [-0.29, +0.45] | 7.03e-01 | no |
Method. Source: shufinskiy/nba_data, a keyless, no-login public mirror that re-serves stats.nba.com's own shot-chart-detail rows, named here as a substitution for scripted direct access to stats.nba.com, which blocks plain requests. Two complete, real regular seasons — 2022-23 and 2023-24 — every logged field-goal attempt (this endpoint carries no free throws, so none needed excluding), 435,919 shots total. Each (season, game, player) triple is one ordered sequence, sorted by GAME_EVENT_ID, the real in-game play-by-play sequence number the NBA's own system assigns; sequences with fewer than 10 attempts are dropped (too short to say anything). The naive statistic is Gilovich-Vallone-Tversky's own: for each qualifying sequence, hit rate immediately following a make minus hit rate immediately following a miss, averaged across sequences with equal weight per sequence (the original paper's own convention, not weighted by shot count). The Miller-Sanjurjo null for a given sequence is the same statistic's own expected value under a uniform-random shuffle of that exact sequence's fixed count of makes among its fixed number of attempts — computed by Monte Carlo (2,000 shuffles per distinct (length, makes) combination actually observed, 309 combinations total, seeded for reproducibility) rather than Miller & Sanjurjo's own closed-form small-n formula, which this run did not re-derive. The bias-corrected statistic is each sequence's own observed gap minus its own (length, makes)-matched null, averaged the same way. All confidence intervals are a 3,000-draw cluster bootstrap resampling whole players (not individual sequences), since the same player contributes many games. The placebo check generates one synthetic i.i.d. sequence per real sequence, same length, each player's own real hit rate, and runs the identical pipeline end to end — its corrected interval contains zero, as a correctly-specified method must when the true effect is exactly zero by construction.
Limits, stated plainly. This is live NBA offense, not a controlled shooting contest like the one GVT and later Miller & Sanjurjo themselves re-analyzed (where the shooter faces no defense and chooses no shot); a negative corrected gap here is consistent with real basketball's own obvious confound — a defense that tightens up on a player who just scored, or a shooter who, believing himself hot, now settles for a harder shot — and this run cannot separate that mechanism from a true absence of hot-hand shooting touch. Only field-goal attempts are in scope; free throws, where shot difficulty and defensive pressure are held constant possession to possession, are a cleaner test of the same claim and are not attempted here. The correction's own Monte Carlo null is a numerical approximation to Miller & Sanjurjo's exact combinatorial result, not that exact result; it agrees with their published direction and the placebo check confirms it recovers a clean zero when the true answer is zero, but it is still an approximation. Two seasons, not the multi-decade sweep a secular claim about human performance would ideally draw on.
hothand_600.csv (one row per shot: game, player, real in-game event order, make/miss) · fit output (JSON).