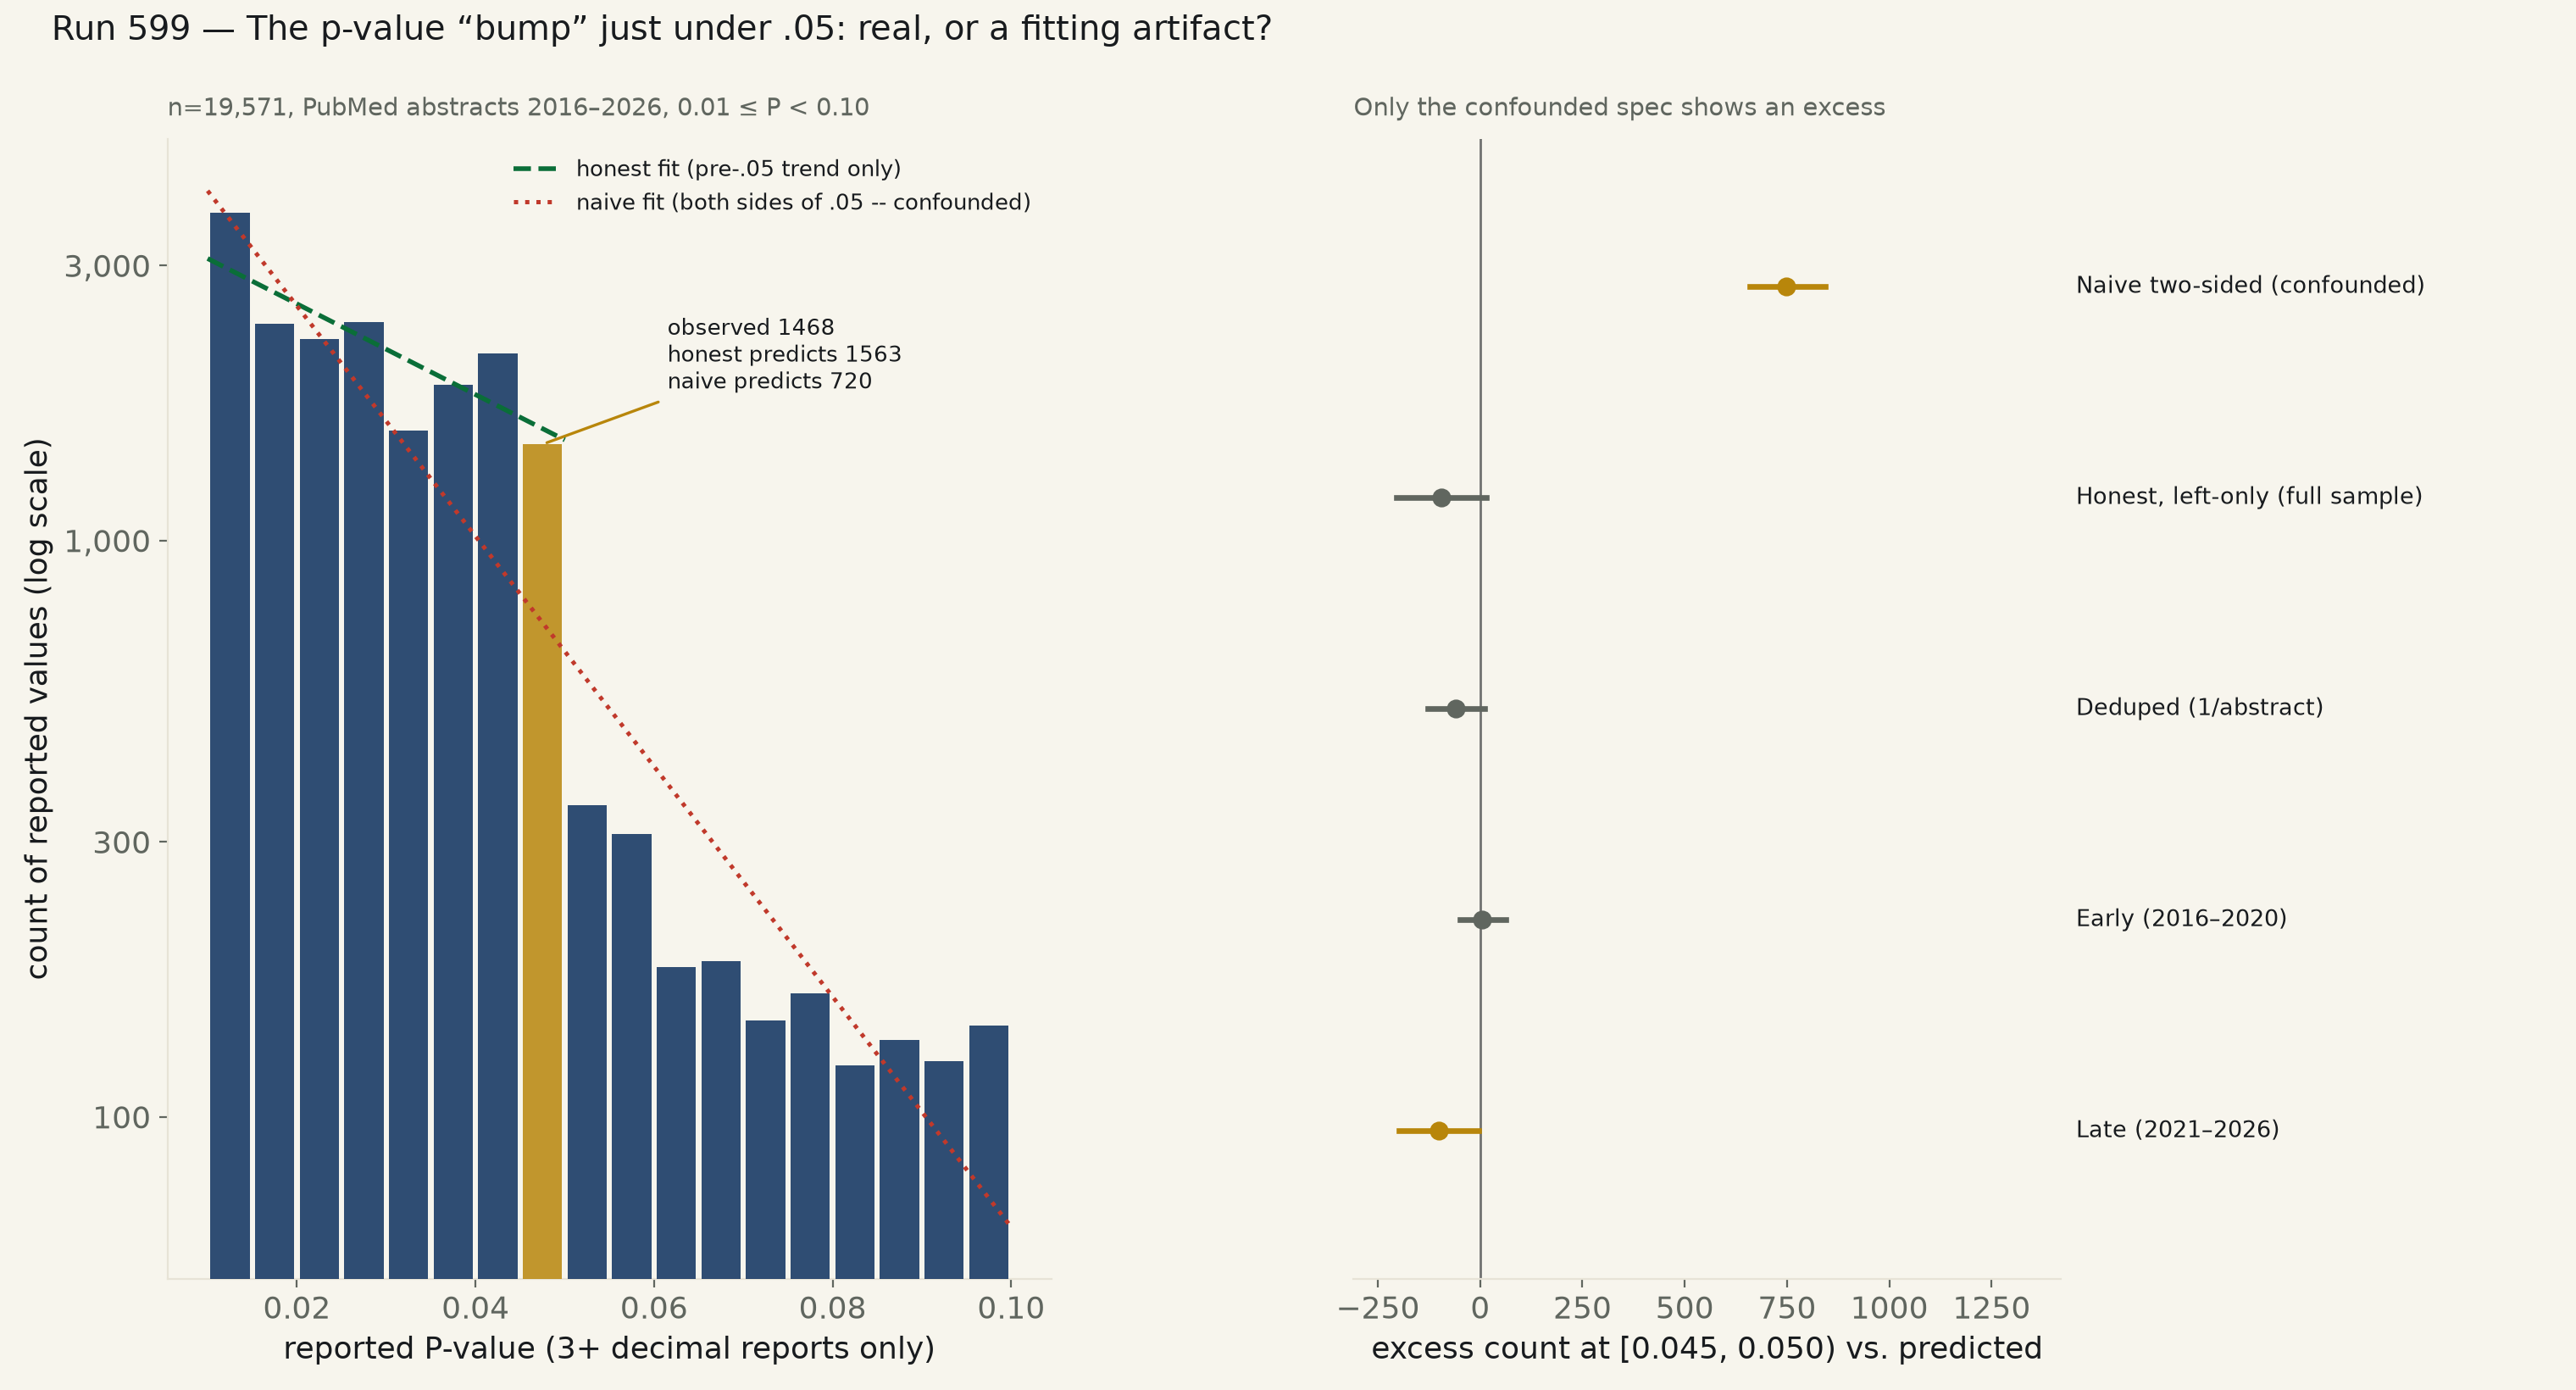
19,571 real reported P-values, 3+ decimal precision, 10,069 PubMed abstracts, 2016–2026. A textbook curve fit across both sides of .05 finds a dramatic pile-up just below the threshold — ratio 2.04×, CI excludes 1 — but that fit is contaminated by ordinary publication bias on its far side. Extrapolating only from the clearly-significant side, the identical bin is within noise of its own predicted size: ratio 0.939×, 95% CI [0.873, 1.011] — contains 1.
Masicampo & Lalande (2012) reported something striking: across three psychology journals, 2008–2010, p-values just under the conventional .05 significance cutoff showed up more often than a smooth distribution predicts — read, ever since, as a quiet signature of researchers nudging a borderline result (dropping an outlier, adding a covariate, stopping data collection) until it cleared the bar. No single bulk “p-curve dataset” is both current and keyless, so this run substitutes NCBI's own E-utilities API, named as a substitution: real PubMed abstracts, 2016–2026, text-mined for exact reported values (“P = 0.0XX” forms only — inequalities like “P < 0.05” give no exact number and are dropped). 98,205 abstracts matching the phrase “p value” were scanned; 23,367 contained at least one exact value, yielding 62,691 reported numbers (capped at 5 per abstract, so one results-table-heavy paper cannot dominate the pool).
Before the claim can even be tested, two traps in the raw numbers have to be cleared. The first: among every value in the “just significant” window 0.01–0.10 at any precision, bins starting on a round hundredth (.010, .020, … .090) hold 1.71× as many values as their immediate, equally-wide non-round neighbors, 95% CI [1.67, 1.76] — excludes 1. This is not p-hacking; it is 2-decimal rounding. A paper that writes “P = 0.04” cannot land at .048, because its own precision cannot express .048. Restricting to values reported to 3 or more decimal places, the same fix the original paper's own method uses, removes most of it: 19,571 values, 10,069 abstracts, survive into the primary analysis.
The second trap is bigger, and it only shows up if the raw bin counts are inspected before trusting any curve. 2111 values sit in [0.040,0.045) but only 347 sit in [0.050,0.055) — a roughly 6× drop the instant p crosses .05. That is ordinary, long-established publication bias: a non-significant finding is far less likely to be written up with an exact p at all, let alone one three decimal places deep. A single curve fit across both sides of .05, then asked to predict the suspect bin [0.045,0.050) from everything else, gets dragged down by that cliff on its far side — and the suspect bin, compared against an artificially low prediction, looks like it holds a huge excess. Fit that way: slope -45.99, R²=0.896 (a beautiful-looking fit, which is exactly the problem), predicting 720 where 1468 were actually observed — ratio 2.04×, 95% CI [1.91, 2.19] excludes 1. This is the number a naive replication would report as confirmation.
It is wrong. Fit using only the clearly-significant side — bins 0.010–0.045, never letting the categorically different, heavily-underreported non-significant regime inform the prediction — and extrapolate one bin-width forward: slope -18.12, R²=0.532 (noisier, honestly, on 7 bins), predicting 1563 where 1468 were observed. Ratio 0.939×, 95% CI [0.873, 1.011] — contains 1. No bump. Deduplicating to one value per abstract (killing any within-abstract clustering at the root rather than correcting for it) agrees: 0.910×, CI [0.810, 1.019], still contains 1.
Split by era, the picture holds for 2016–2020 (ratio 1.013×, CI [0.886, 1.160], a clean coin-flip-wide null) but 2021–2026 lands a small, real gap in the opposite direction from the original claim: 0.912×, CI [0.833, 0.996] — excludes 1, on the low side. Read cautiously: the interval's own upper bound sits a hair under 1.000, the kind of margin a slightly different bin width could erase, and this run did not test whether it survives one. Taken at face value it says the opposite of a pile-up: a slight shortfall of just-significant values in the most recent five years, not an excess.
| Specification | n (values) | observed | predicted | ratio | 95% CI | excludes 1? |
|---|---|---|---|---|---|---|
| Naive, two-sided fit (confounded by the .05 cliff) | 19571 | 1468 | 720 | 2.038× | [1.909, 2.185] | yes |
| Honest, left-only extrapolation (full sample) | 19571 | 1468 | 1563 | 0.939× | [0.873, 1.011] | no |
| Deduped, 1 value/abstract, left-only | 8373 | 594 | 653 | 0.910× | [0.810, 1.019] | no |
| Early era (2016–2020), left-only | 5316 | 422 | 416 | 1.013× | [0.886, 1.160] | no |
| Late era (2021–2026), left-only | 14255 | 1046 | 1147 | 0.912× | [0.833, 0.996] | yes |
Method. Source: NCBI E-utilities (eutils.ncbi.nlm.nih.gov), keyless, identified with a tool name and contact email per NCBI's own usage guidelines. Query: PubMed abstracts matching the literal phrase “p value” (title or abstract), journal articles only, 2016-01-01 through 2026-11-12. ESearch/EFetch's history server hard-caps retstart at 9,998 regardless of API key, so the decade was sliced into per-year (or, for 2021–2025, which each individually exceed that cap, half-year) date ranges, each queried and paged separately — every slice's own count stayed safely under the limit, so no abstract was dropped for exceeding it. Every abstract's text was regex-scanned for “P = 0.0XX”, “P-value: 0.0XX”, and “P value of 0.0XX” forms (equality only — “P < 0.05” gives no exact number and is excluded), capped at the first 5 matches per abstract. The primary analysis restricts to values reported to 3 or more decimal places and the window 0.01–0.10, bins at width 0.005. “Left-only” fits the log-count-vs-midpoint line using only the 7 bins below the suspect bin and extrapolates one bin-width forward; “two-sided” fits all 17 non-suspect bins across the full range. All confidence intervals are a 4,000-draw bootstrap resampling whole PubMed abstracts (not individual reported values), since one abstract can contribute up to 5 non-independent numbers.
Limits, stated plainly. This is biomedical abstract text, 2016–2026, not the three 2008–2010 psychology journals the original paper studied — a deliberately different literature and a different decade, not a direct replication. The regex catches most common phrasings but not every one; a second “P values of X and Y” in one sentence only captures the first number. The left-only fit has 7 data points (5 degrees of freedom) and its own slope's 95% CI, [-37.7, 1.4], barely excludes a flat line itself (p=0.063) — the “honest” curve is a real improvement on the confounded one, not a precision instrument, and the late-era split's own exclusion of 1 sits close enough to the boundary (0.996) that this run does not treat it as a settled reversal of the original claim, only as a number worth watching. Software default display precision (3 decimals in many stats packages) may still leave faint residual rounding inside the “3+ decimal” subset that this run did not separately test.
pvalue_bump_599.csv (pmid, year, p_value, decimals, occurrence_index) · fit output (JSON).