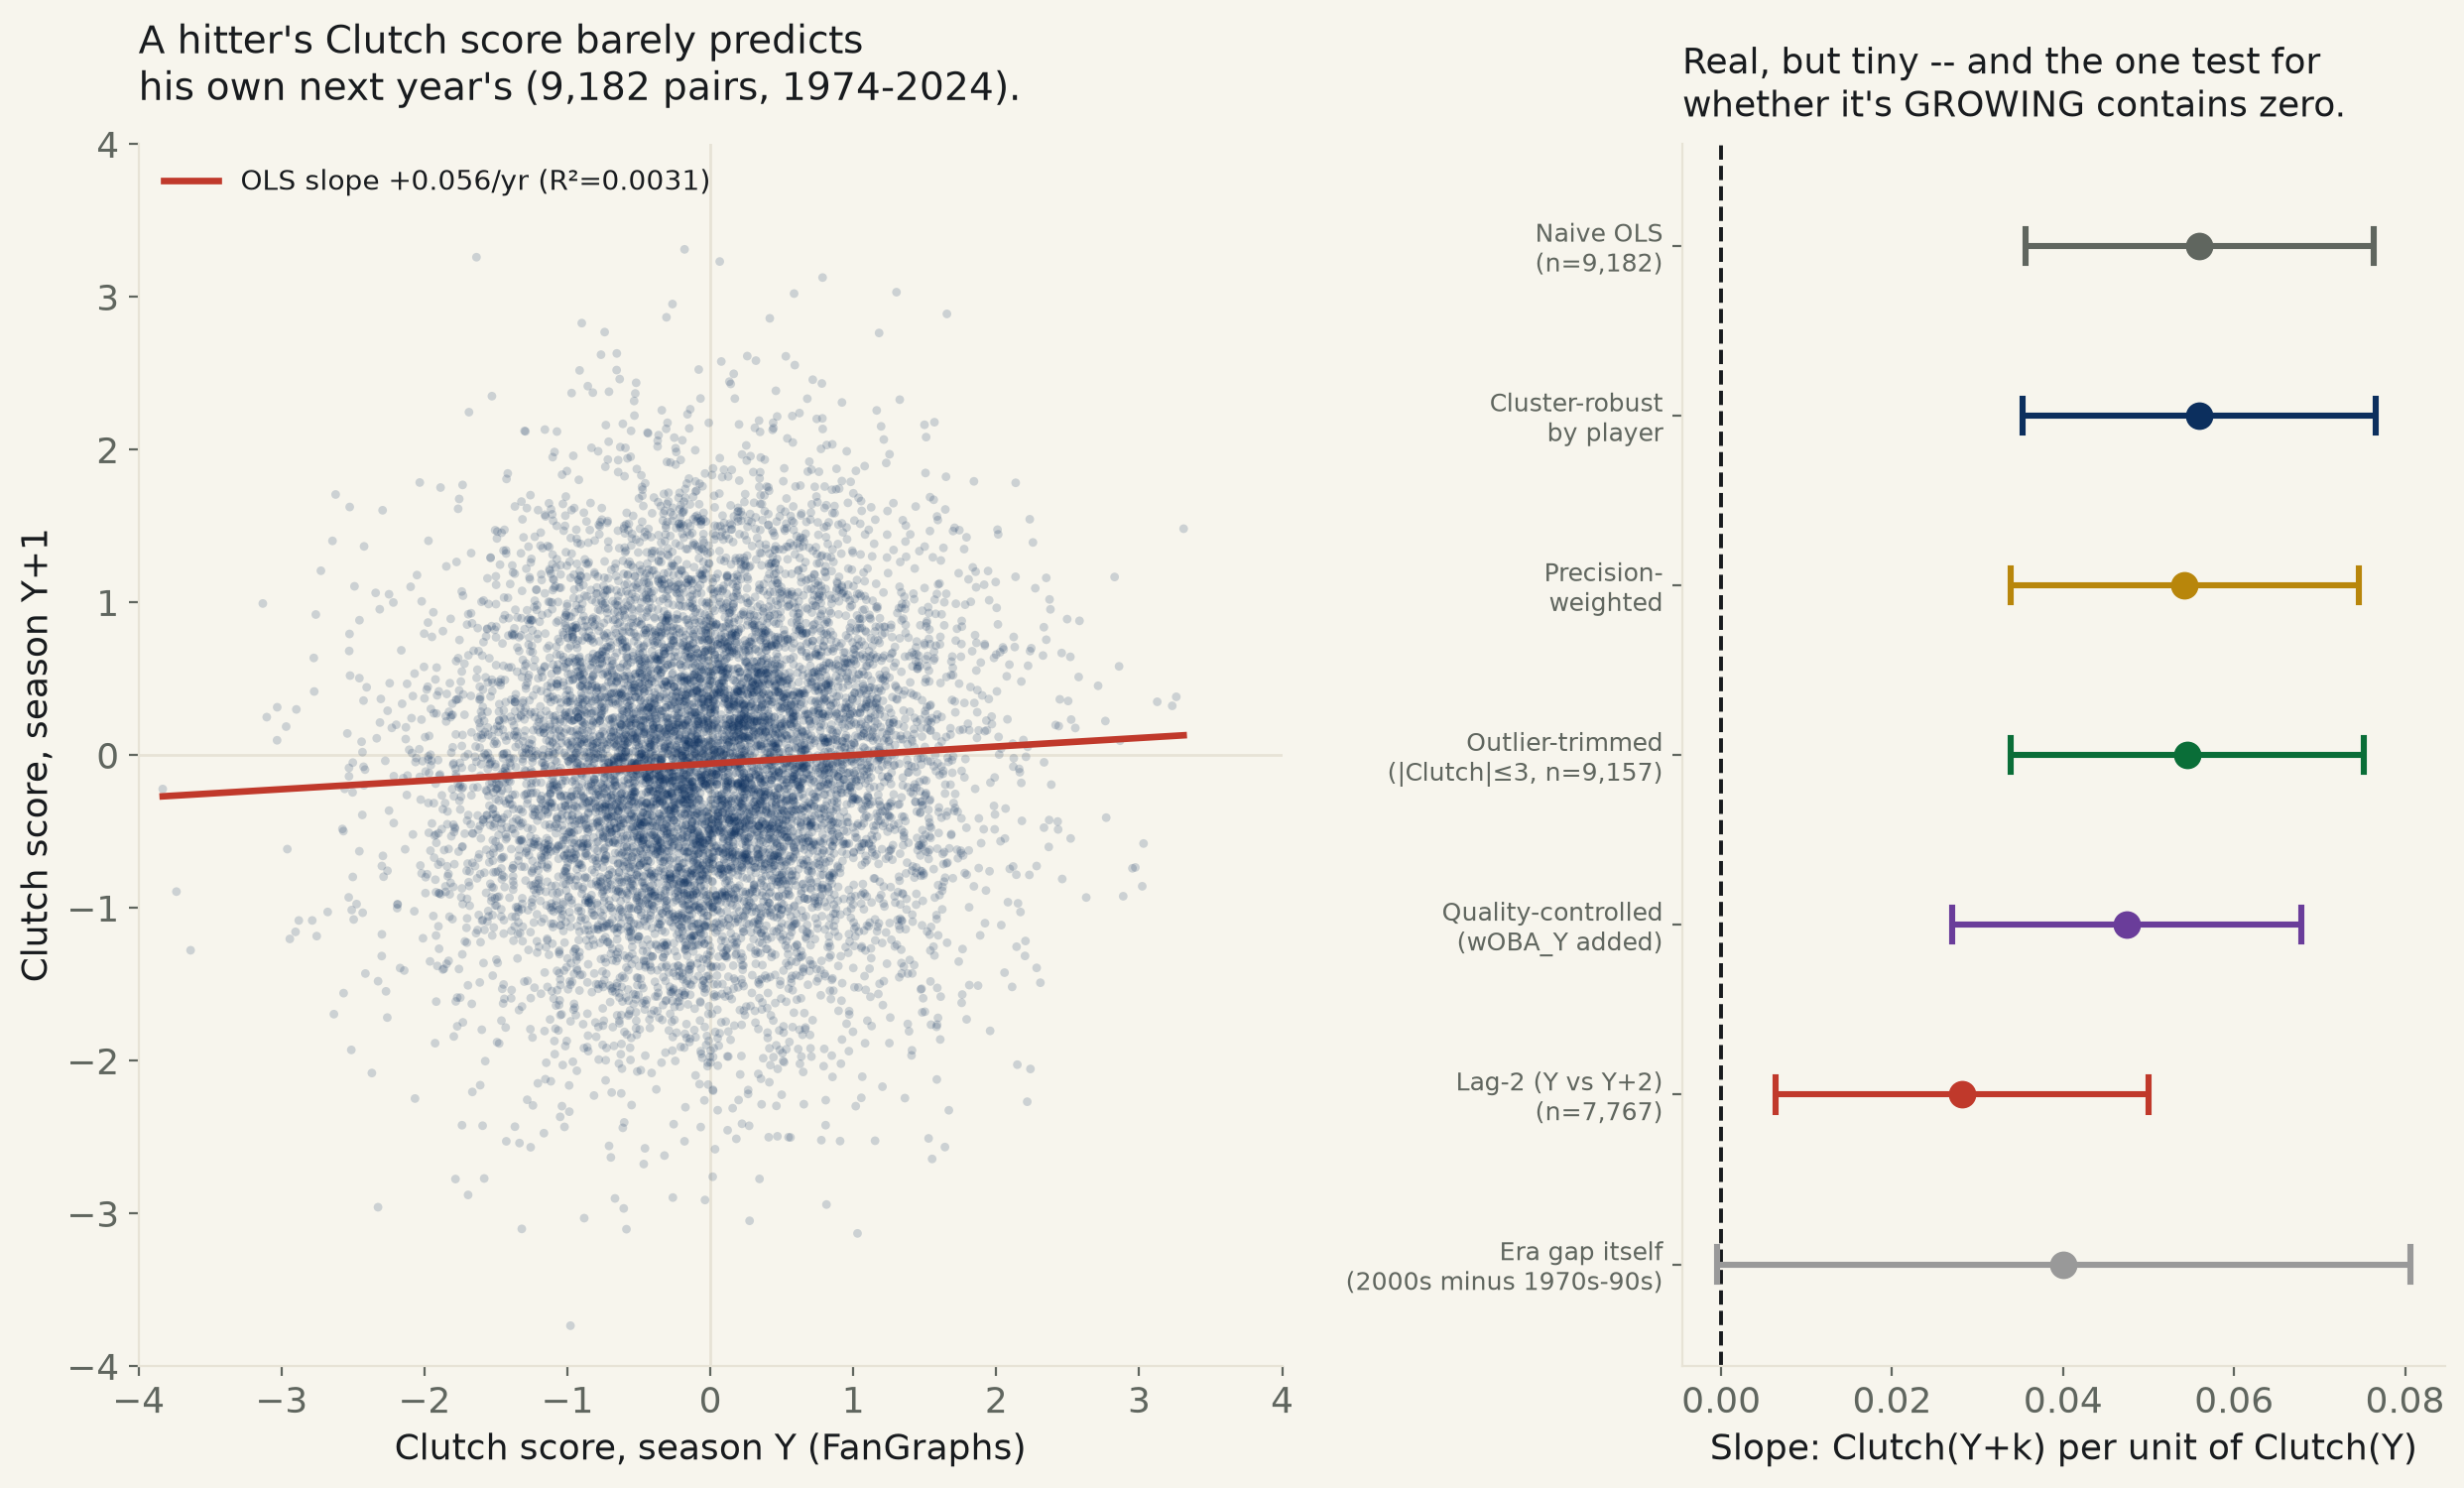
9,182 player-season pairs, FanGraphs' own Clutch score, 1974-2024, qualified hitters (≥300 PA). A hitter's score this year does predict his own next year's — slope +0.0559, CI [+0.0356, +0.0763], excludes zero — and it survives every robustness check thrown at it. It also explains only 0.31% of next year's variance.
Backlog #47: “The 'clutch gene' — do some players hit better in the clutch? [NULL/noise] · `Retrosheet`.” The cited source, Retrosheet's raw play-by-play, was substituted with the same play-by-play already aggregated into FanGraphs' own public Clutch leaderboard — a keyless JSON API backing the site's own leaderboard pages, no login wall, no key. Clutch, as FanGraphs defines and publishes it, is Tom Tango's formula: a player's actual win-probability contribution (WPA, adjusted for leverage) minus what his own context-neutral batting line would have produced in the same spots — a measure of whether a hitter did better or worse than himself when it mattered most, not whether he simply hit well. It requires play-by-play, which is why FanGraphs' own Clutch column is null before 1974 (confirmed by probing 1950, 1960, and 1973 — all null — against 1974, populated, before writing the fetch) — the first season of complete Retrosheet-derived win-probability coverage on this site.
Every qualified-hitter season (≥300 PA, FanGraphs' own standard “semi-regular” cutoff) from 1974 through 2024 was pulled: 12,711 player-seasons. 2020 contributes zero rows — the 60-game pandemic schedule made 300 PA unreachable for anyone, not a row dropped by hand. Consecutive-season pairs for the same player — year Y's Clutch score against year Y+1's — give 9,182 pairs across 1,799 players, 1974-2024.
The backlog called this one noise. It isn't, quite. Regressing Clutch(Y+1) on Clutch(Y): naive slope +0.0559, 95% CI [+0.0356, +0.0763] — excludes zero, p=7.7e-08. This is not a fragile result: it survives standard errors clustered by player (1,799 players each contributing several overlapping pairs, CI [+0.0353, +0.0766]), a 4,000-draw bootstrap resampling players with replacement (CI [+0.0355, +0.0764], 100% of resampled slopes positive), a 4,000-draw permutation test shuffling which player's next season gets paired with which (p=0.000 — not one of 4,000 shuffles produced a slope this extreme), trimming the 25 pairs with |Clutch|>3 in either season (CI [+0.0338, +0.0752]), and a precision-weighted refit using harmonic-mean plate appearances (CI [+0.0338, +0.0746]). Spearman agrees: ρ=0.0563, p=6.7e-08.
One real confound, checked and surviving. Clutch is supposed to net out a player's own overall quality by construction, but it doesn't do so completely: same-season Clutch correlates with wOBA at r=-0.1151 (p=9.1e-39) — better hitters score slightly less clutch by this measure, plausibly because pitchers work around them more carefully in the highest-leverage spots. Since wOBA is itself a famously persistent, stable skill, this raised the obvious worry: is the Y-to-Y+1 Clutch persistence actually just borrowed from stable hitting talent? Adding year-Y wOBA directly to the regression shrinks the Clutch(Y) coefficient to +0.0474 — 85% of the naive size — but its CI, [+0.0270, +0.0679], still excludes zero. Some of the persistence is talent-adjacent; not all of it.
But the size is the story. R² on the naive fit: 0.0031. Knowing a hitter's Clutch score this year explains 0.31% of the variance in his own score next year. A two-years-apart check (year Y vs. Y+2) finds a weaker but still zero-excluding echo, slope +0.0281, CI [+0.0063, +0.0500], consistent with a small, decaying, real signal rather than a one-lag artifact. Splitting the window at 2000 finds both eras individually clearing zero — 1974-99 slope +0.0349 (CI [+0.0059, +0.0638]), 2000-24 slope +0.0750 (CI [+0.0460, +0.1039]) — which looks like the effect more than doubled. The direct test of that says otherwise: the era-interaction term, the gap between the two slopes fit in one model, is +0.0401, CI [-0.0005, +0.0806] — contains zero, p=0.053. Two individually-significant subgroups do not make a significant difference between them; this is the textbook trap, named rather than walked into.
For color, not for the fit: among hitters with at least 8 qualifying seasons, Marcus Semien posted the lowest career-average Clutch (-1.156 over 9 seasons); Jose Vizcaino the highest (+0.831 over 8 seasons). The bottom of the list leans toward well-known sluggers — Mike Schmidt, Sammy Sosa, Giancarlo Stanton among them — consistent with the wOBA finding above, not with any of them having choked for a decade.
Seven specifications
| Specification | n | Slope: Clutch(Y+k) per unit Clutch(Y) | 95% CI | R² | Verdict |
|---|---|---|---|---|---|
| Naive OLS | n=9,182 | +0.0559 | [+0.0356, +0.0763] | R²=0.0031 | excludes zero, p=7.7e-08 |
| Cluster-robust by player (1,799 players) | n=9,182 | +0.0559 | [+0.0353, +0.0766] | — | excludes zero, p=1.1e-07 |
| Precision-weighted (harmonic PA) | n=9,182 | +0.0542 | [+0.0338, +0.0746] | — | excludes zero, p=1.9e-07 |
| Outlier-trimmed (|Clutch|≤3) | n=9,157 | +0.0545 | [+0.0338, +0.0752] | — | excludes zero, p=2.4e-07 |
| Quality-controlled (wOBA, year Y, added) | n=9,182 | +0.0474 | [+0.0270, +0.0679] | — | excludes zero, p=5.6e-06 |
| Lag-2 (year Y vs. year Y+2) | n=7,767 | +0.0281 | [+0.0063, +0.0500] | — | excludes zero, p=0.011 |
| Era gap itself (2000-24 minus 1974-99) | n=9,182 | +0.0401 | [-0.0005, +0.0806] | — | contains zero, p=0.053 |
Method. FanGraphs' public leaderboard API
(fangraphs.com/api/leaders/major-league/data, type=8/“Advanced”
batting), keyless, pulled per-season for 1974-2024 at a ≥300-PA qualifying
threshold. Clutch is FanGraphs' own published statistic (WPA/LI-based, Tango's
formula); it is not recomputed here. Consecutive-season pairs are built per
playerid; a player active 15 seasons contributes up to 14 overlapping
pairs, which is why every regression reported here clusters standard errors by
player rather than treating pairs as independent. The precision-weighted spec
weights each pair by the harmonic mean of the two seasons' plate appearances. The
quality-controlled spec adds year-Y wOBA as a second regressor. The era-interaction
spec fits Clutch(Y+1) ~ Clutch(Y) + era + Clutch(Y)·era in one model, where
era is a 2000-and-later indicator; its reported figure is the interaction
coefficient, i.e. the actual change in slope between eras, not two separately-fit
slopes compared by eye.
Limits, stated plainly. Clutch does not net out overall hitting quality as cleanly as its definition implies (r=-0.115 with same-season wOBA) — the quality-controlled spec exists because of this and the persistence survives it, shrunk. Lineup slot and team run-scoring context, both plausible sources of a genuinely persistent (but not skill-based) Clutch tilt, aren't in this data and aren't controlled for. The ≥300-PA cutoff restricts this to everyday and semi-regular hitters; part-time players and pinch-hitting specialists, who by some accounts are where a real clutch skill would most plausibly concentrate, are excluded by construction.
clutch_persistence_595.csv (all 12,711 underlying player-seasons) · fit output (JSON).
15 least clutch career averages (≥8 qualifying seasons)
| Player | Qualifying seasons | Career mean Clutch | Total PA |
|---|---|---|---|
| Marcus Semien | 9 | -1.156 | 5,977 |
| Josh Reddick | 8 | -0.871 | 4,108 |
| Mike Schmidt | 15 | -0.861 | 9,407 |
| Sammy Sosa | 16 | -0.858 | 9,402 |
| Casey Blake | 8 | -0.830 | 4,727 |
| Giancarlo Stanton | 13 | -0.817 | 6,730 |
| Lance Parrish | 15 | -0.782 | 7,373 |
| Kevin Mitchell | 9 | -0.772 | 4,232 |
| Jermaine Dye | 11 | -0.760 | 6,448 |
| J.T. Realmuto | 9 | -0.741 | 4,767 |
| Randal Grichuk | 8 | -0.740 | 3,914 |
| Cecil Fielder | 9 | -0.736 | 5,381 |
| Damion Easley | 10 | -0.734 | 4,848 |
| Chet Lemon | 15 | -0.708 | 7,836 |
| Johnny Bench | 9 | -0.706 | 4,598 |
15 most clutch career averages (≥8 qualifying seasons)
| Player | Qualifying seasons | Career mean Clutch | Total PA |
|---|---|---|---|
| Jose Vizcaino | 8 | +0.831 | 3,985 |
| Mark McLemore | 12 | +0.777 | 6,169 |
| Bill Spiers | 8 | +0.721 | 3,257 |
| Scott Fletcher | 10 | +0.697 | 5,208 |
| Pete Rose | 12 | +0.685 | 7,911 |
| Lance Johnson | 10 | +0.671 | 5,376 |
| Michael Bourn | 9 | +0.632 | 5,179 |
| Ozzie Guillen | 13 | +0.624 | 6,721 |
| Kyle Seager | 9 | +0.604 | 5,755 |
| Tony Gwynn | 17 | +0.594 | 9,771 |
| Robbie Grossman | 8 | +0.548 | 3,782 |
| Dave Parker | 15 | +0.531 | 9,283 |
| Tony Womack | 9 | +0.529 | 5,227 |
| Jacoby Ellsbury | 9 | +0.525 | 5,164 |
| Darin Erstad | 10 | +0.525 | 5,860 |