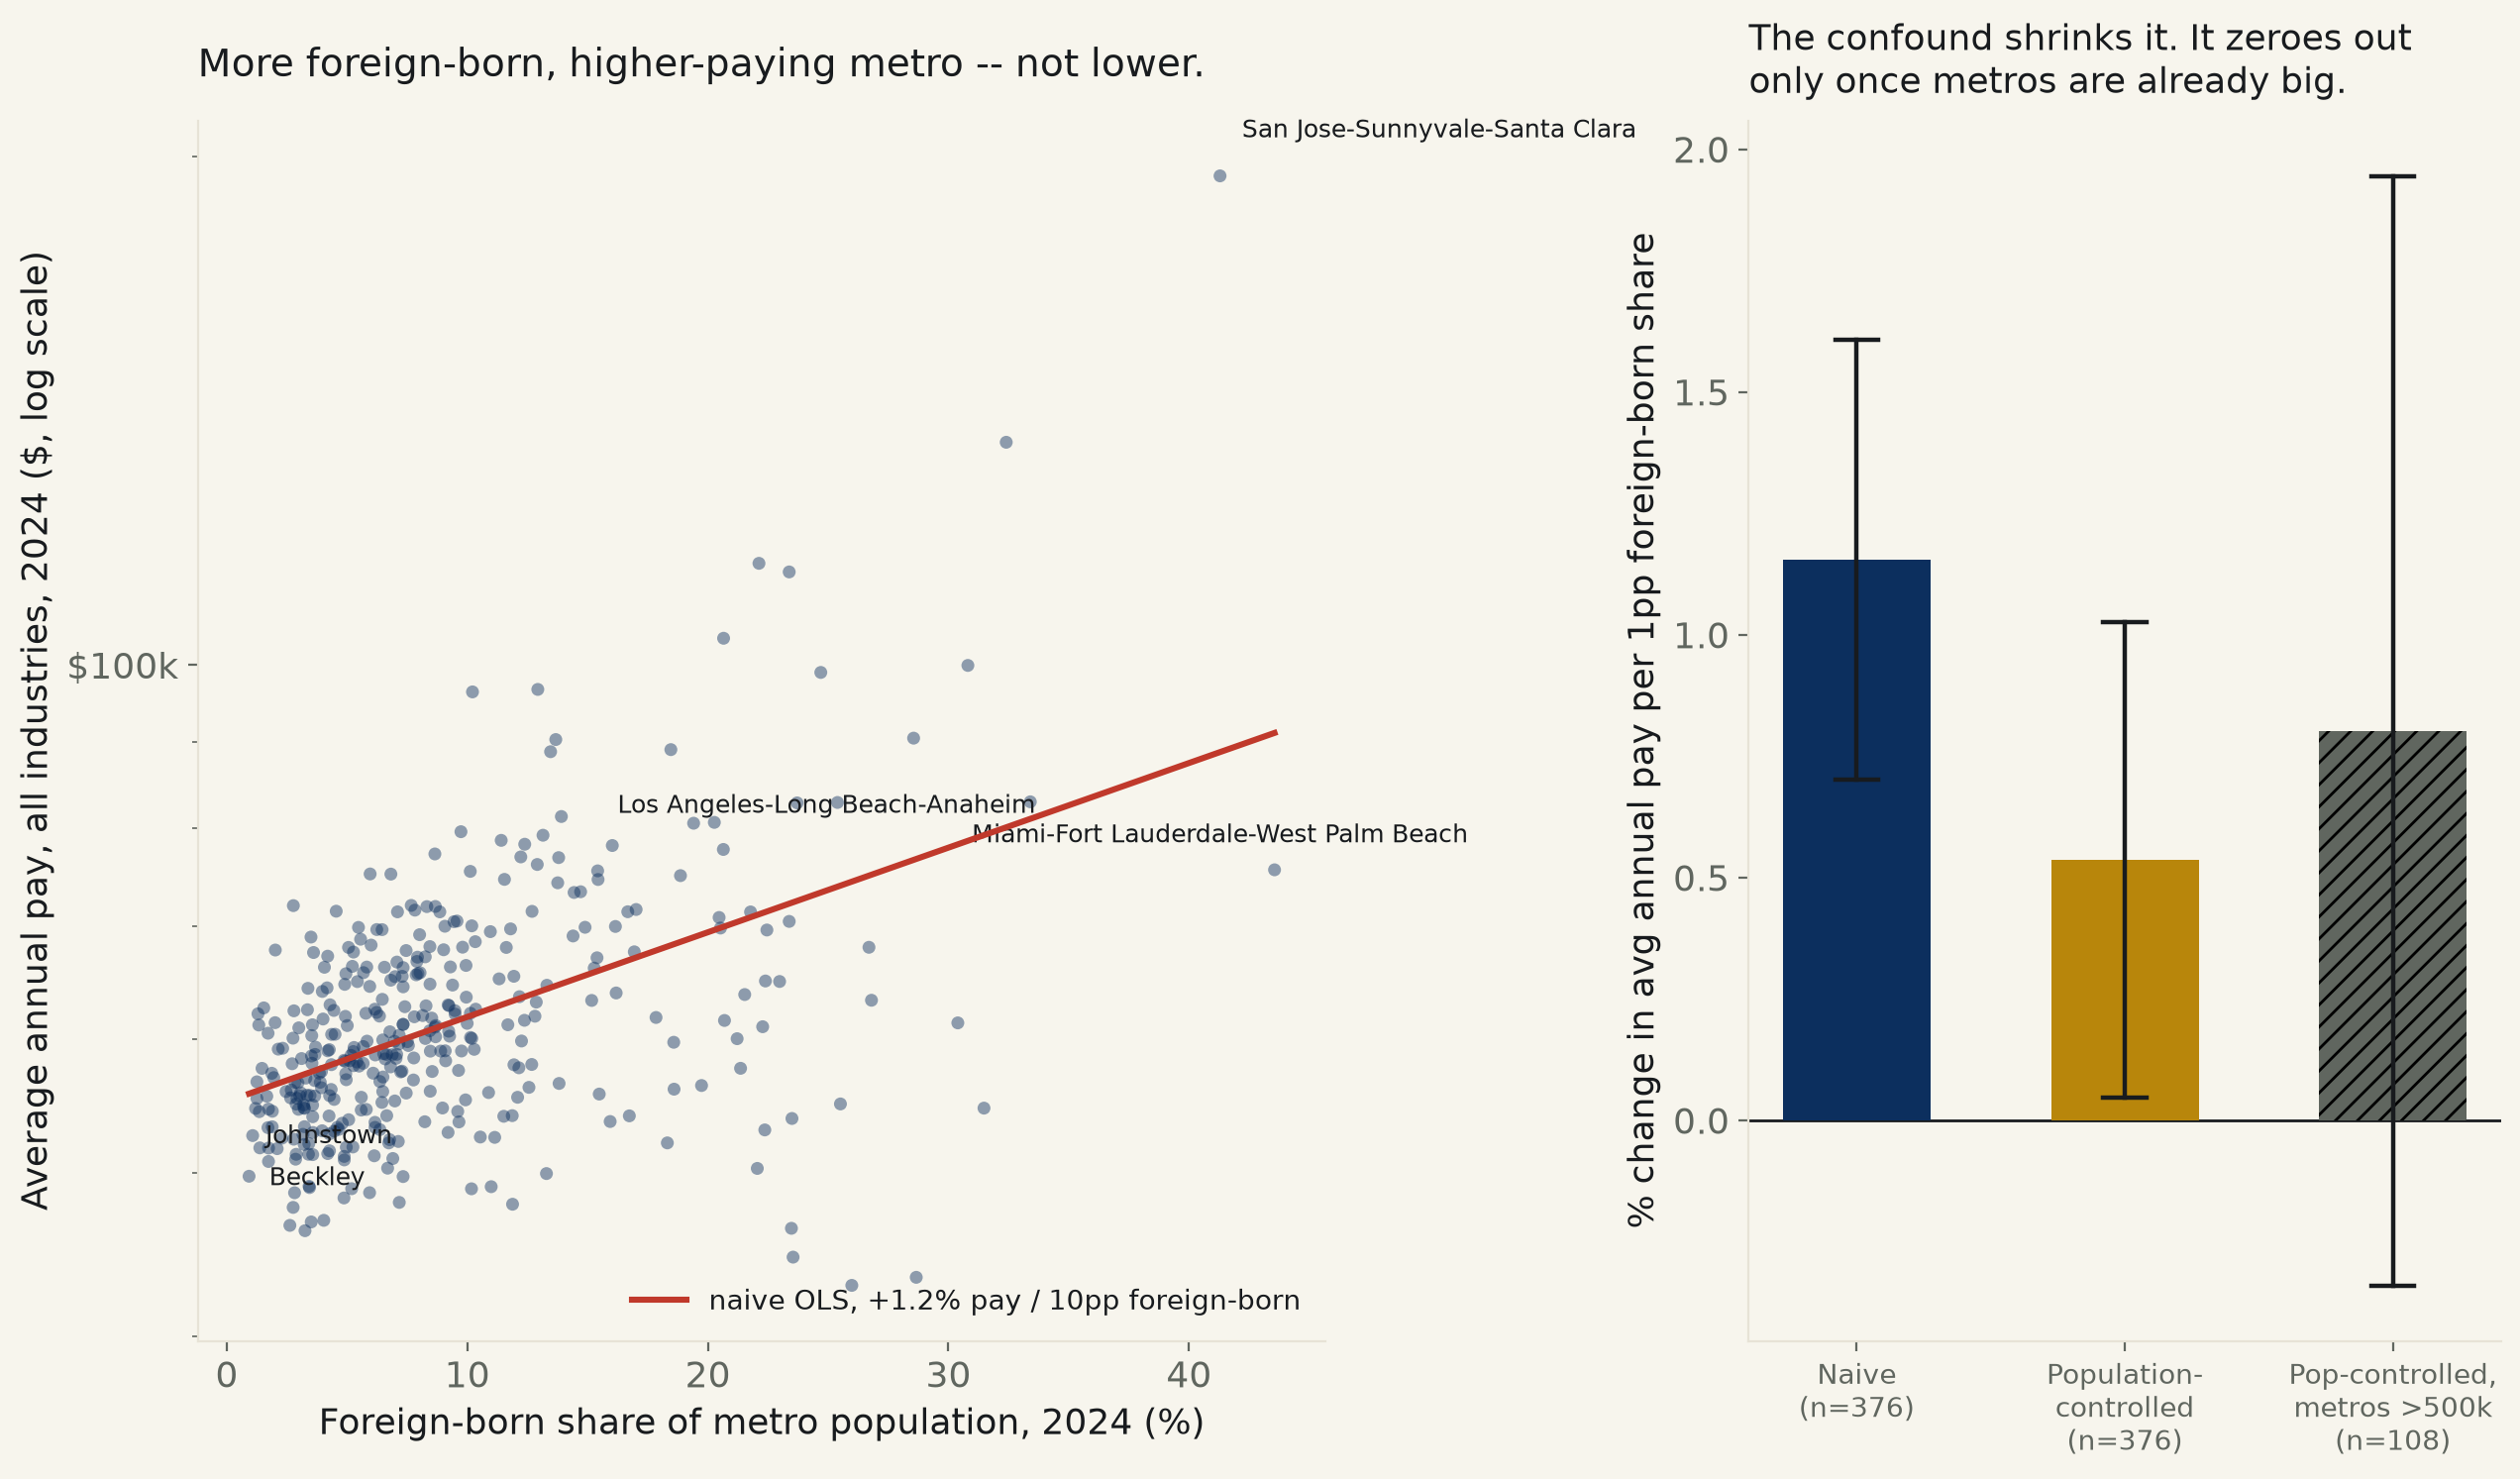
376 US metro areas, 2024. Foreign-born population share (Census ACS) vs. average annual pay, all industries (BLS QCEW). Naive slope: +1.15% pay per percentage point foreign-born, 95% CI [+0.70%, +1.61%] — excludes zero, running opposite the “immigration lowers wages” claim this backlog item names.
Backlog #28: “Does immigration lower native wages? Cross-metro”, tagged [NULL] going in, previously untouched. The idea names Census and BLS. api.census.gov 302s to a “Missing Key” page on every call from this box without a registered key — the identical block runs 034 and 571 hit on this exact host; substituted, named here rather than silently swapped: Census's own ACS 1-year table B06001 (“Place of Birth by Age”), re-served keyless through DataUSA's public Tesseract API, the same re-serving path run 571 used for the ACS Gini table — real Census ACS 1-year data, not a third-party estimate. Foreign-born share is Foreign Born divided by the sum of all four nativity categories the table reports, metro level, 2024. Wages are BLS's own QCEW public API (no key required at all), 2024 annual averages, all industries, all ownership combined, matched to the Census metro by converting each 5-digit CBSA code to BLS's own area-code convention (“C” + the first four digits — verified against Abilene, TX appearing under both codes before trusting it at scale). 376 US metro areas had both figures for 2024.
The naive result runs the opposite direction from the claim the backlog names. Log(average annual pay) on foreign-born share: +1.15% pay per percentage point of foreign-born population, 95% CI [+0.70%, +1.61%] — excludes zero, R²=0.231, p=5.7e-07. A distribution-free Spearman rank correlation agrees on direction and significance: ρ=0.448, p=5.6e-20. Average weekly wage, a second BLS QCEW measure pulled from the same source, gives the identical slope to three decimal places: +1.15%, CI [+0.70%, +1.61%] — this is not an artifact of which wage column was picked. A 4,000-draw bootstrap on the naive slope lands at [+0.74%, +1.60%], every one of 4,000 resampled slopes positive (100%).
The obvious confound — metro size — explains under half of it, not all of it. Bigger metros draw more immigrants and pay more for reasons that have nothing to do with immigration itself: deeper labor markets, more white-collar and tech employment, higher cost of living built into nominal pay. Foreign-born share correlates with log(metro population) at r=0.53 in this sample. Adding log(population) to the regression shrinks the slope to +0.54%, CI [+0.05%, +1.03%] — 46% of the naive size, p=0.032, but still excludes zero. Size is a real confound here, not the whole story.
Restricted to metros already above 500,000 people, the population-controlled signal gives out. Among the 108 largest US metros, the naive gap is still there (+1.28%, CI [+0.44%, +2.11%] — excludes zero), but once population is controlled for within that already-big sample, the interval contains zero: +0.80%, CI [-0.34%, +1.94%], p=0.169. Once you're comparing big cities to each other, the extra size variation within that narrower band can no longer distinguish a foreign-born-share effect from noise.
Named. Miami-Fort Lauderdale-West Palm Beach, FL leads the sample at 43.6% foreign-born; San Jose-Sunnyvale-Santa Clara, the highest-paying metro in the dataset at $194,865/year, is close behind at 41.3%. Johnstown, PA anchors the other end at 0.9% foreign-born and $49,791/year. The relationship is a tendency, not a rule: El Centro, CA posts the sample's 5th-highest foreign-born share (31.5%, a border metro, agriculture-heavy) and one of its lower pay figures ($54,639), the clearest counterexample to a clean linear story.
Read plainly. This run cannot find the wage-depressing effect the backlog question names, at the metro-average level, in the direction the claim predicts. It finds the reverse at face value, finds that reverse signal partly but not fully explained by city size, and finds that whatever remains after controlling for size is not distinguishable from zero once the sample is restricted to metros that were already large. None of this rules out a real wage effect concentrated in a specific lower-skill labor-market segment — the stated limit below — only that no such effect shows up in the metro-wide average this run can actually test.
| Specification | % pay change per 1pp foreign-born share | 95% CI | Fit | Verdict |
|---|---|---|---|---|
| Naive (n=376) | +1.154% | [+0.702%, +1.607%] | R²=0.231 | excludes zero, p=5.7e-07 |
| Population-controlled (n=376) | +0.536% | [+0.047%, +1.025%] | R²=0.400 | excludes zero, p=0.032 |
| Weekly-wage cross-check, naive (n=376) | +1.154% | [+0.702%, +1.607%] | R²=0.230 | excludes zero, p=5.7e-07 |
| Weekly-wage cross-check, pop-controlled (n=376) | +0.536% | [+0.047%, +1.025%] | R²=0.400 | excludes zero, p=0.032 |
| Metros >500k only, naive (n=108) | +1.278% | [+0.443%, +2.113%] | R²=0.265 | excludes zero, p=0.003 |
| Metros >500k only, pop-controlled (n=108) | +0.802% | [-0.340%, +1.945%] | R²=0.360 | contains zero, p=0.169 |
15 lowest foreign-born-share metros
| Metro | Foreign-born | Avg annual pay | Population |
|---|---|---|---|
| Johnstown, PA | 0.9% | $49,791 | 130,108 |
| Beckley, WV | 1.1% | $52,631 | 110,979 |
| Bay City, MI | 1.2% | $54,617 | 102,651 |
| Huntington-Ashland, WV-KY-OH | 1.3% | $56,636 | 366,760 |
| Wheeling, WV-OH | 1.3% | $55,365 | 135,136 |
| Jackson, MI | 1.3% | $62,139 | 160,233 |
| Helena, MT | 1.3% | $61,197 | 96,327 |
| Parkersburg-Vienna, WV | 1.4% | $54,378 | 87,120 |
| Weirton-Steubenville, WV-OH | 1.4% | $51,756 | 112,738 |
| Paducah, KY-IL | 1.5% | $57,684 | 99,814 |
| Billings, MT | 1.5% | $62,643 | 192,531 |
| Williamsport, PA | 1.7% | $55,535 | 113,236 |
| Muskegon, MI | 1.7% | $53,204 | 177,428 |
| Monroe, MI | 1.7% | $60,516 | 156,045 |
| Lewiston, ID-WA | 1.7% | $54,570 | 65,370 |
15 highest foreign-born-share metros
| Metro | Foreign-born | Avg annual pay | Population |
|---|---|---|---|
| Miami-Fort Lauderdale-West Palm Beach, FL | 43.6% | $75,626 | 6,457,988 |
| San Jose-Sunnyvale-Santa Clara, CA | 41.3% | $194,865 | 1,995,484 |
| Los Angeles-Long Beach-Anaheim, CA | 33.4% | $82,976 | 12,927,614 |
| San Francisco-Oakland-Hayward, CA | 32.4% | $135,499 | 4,648,486 |
| El Centro, CA | 31.5% | $54,639 | 181,724 |
| New York-Newark-Jersey City, NY-NJ-PA | 30.8% | $99,941 | 19,940,274 |
| Salinas, CA | 30.4% | $61,375 | 436,251 |
| Eagle Pass, TX | 28.7% | $43,379 | 58,829 |
| Trenton, NJ | 28.6% | $90,503 | 392,138 |
| Stockton-Lodi, CA | 26.8% | $63,300 | 816,108 |
| Naples-Immokalee-Marco Island, FL | 26.7% | $68,041 | 416,233 |
| McAllen-Edinburg-Mission, TX | 26.0% | $42,905 | 914,820 |
| Merced, CA | 25.5% | $54,952 | 296,774 |
| Houston-The Woodlands-Sugar Land, TX | 25.4% | $82,901 | 7,796,182 |
| Washington-Arlington-Alexandria, DC-VA-MD-WV | 24.7% | $98,991 | 6,437,907 |
Method. Census ACS 1-year table B06001 (“Place of Birth by Age”),
metro (CBSA) level, 2024, via DataUSA's Tesseract API
(honolulu-api.datausa.io), summing “Born In State of
Residence,” “Born In Other State In The United States,”
“Native; Born Outside The United States,” and “Foreign Born”
to a total population denominator. BLS QCEW's own public API
(data.bls.gov/cew/data/api), no key or registration of any kind, 2024
annual averages, NAICS industry code 10 (all industries), aggregation level 40 (MSA,
total covered — all ownership levels combined). Joined by converting each Census
5-digit CBSA code to BLS's “C” + first-four-digits area-code convention.
376 of 376 ACS-covered metros had a matching
QCEW wage figure. All regressions HC3-robust; the Spearman and bootstrap checks make
no distributional assumption at all.
Limits, stated plainly. This is nominal pay, not cost-of-living-adjusted — San Jose and San Francisco's high pay figures partly reflect what it costs to live there, not just labor-market strength. It is a single-year cross-section of where people already live, not a natural experiment that moved immigrants into or out of a metro, so it cannot separate a causal wage effect from selection: immigrants, especially high-skilled ones, plausibly move toward metros where wages are already high, which would produce exactly this positive slope with no causal arrow running from immigration to pay at all. It tests the metro-wide average wage, not the specific lower-skill labor-market segment the classic “immigration lowers wages” argument targets — a real effect concentrated there could exist underneath an average that moves the other way. No education, industry-mix, or cost-of-living control is applied beyond the population term.