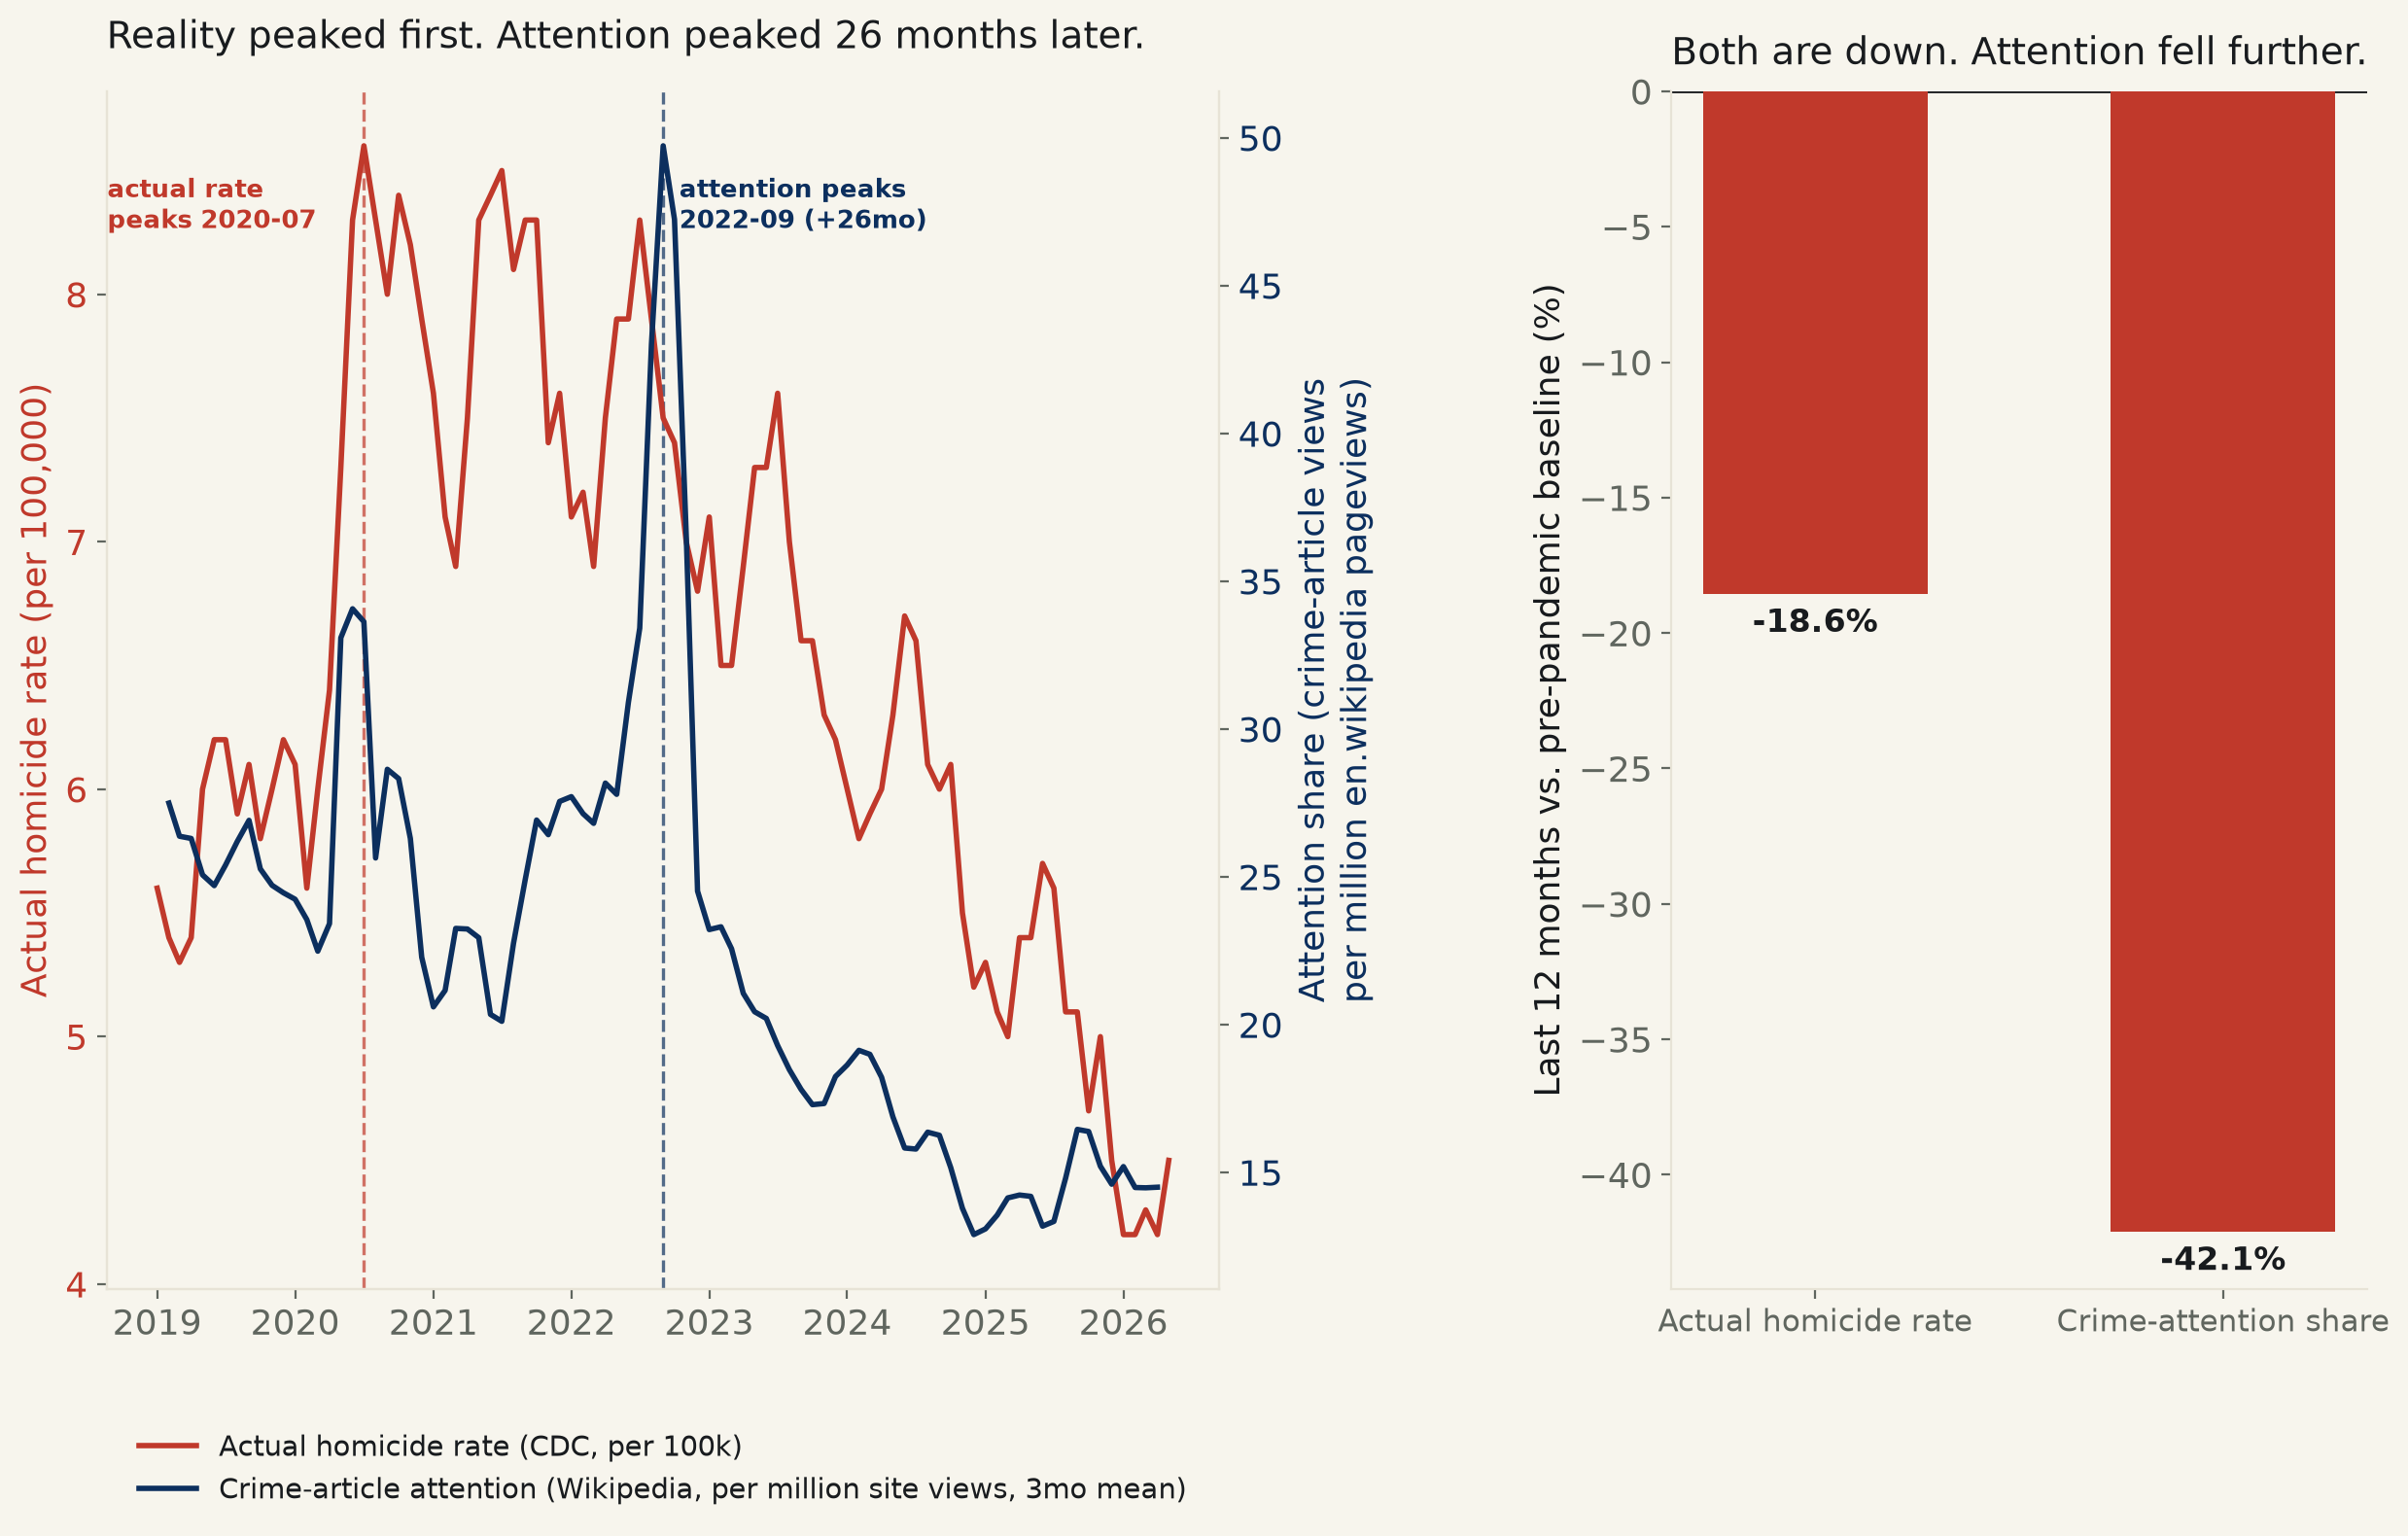
The actual U.S. homicide rate peaked in 2020-07, the pandemic-era surge. Public attention to crime — measured here in Wikipedia reading, not newsroom output — didn't peak until 2022-09, 26 months later, by which point the real rate had already fallen 12.8% off its own high.
Backlog #103: “‘If it bleeds, it leads,’ quantified — crime coverage volume vs actual FBI crime rate.” The idea names GDELT and FBI UCR. FBI UCR's own API needs an api.data.gov key not on file, the same block run 572 hit on this source; GDELT's DOC 2.0 API returned nothing but its own “please limit requests to one every 5 seconds” 429 on every attempt today, sustained across three tries 45 seconds apart with a browser User-Agent — the identical sustained block logged in IDEAS.md for 2026-10-19, not a one-off throttle. Both substituted and named here, not silently swapped: ACTUAL crime is CDC's own national monthly homicide rate (the national-level sibling of the state table run 572 used); COVERAGE is approximated by public reader attention instead of newsroom output — monthly Wikipedia pageviews for a 5-article crime basket (Murder, Homicide, Violent crime, Crime, Crime in the United States), expressed as a share of all en.wikipedia traffic that month to net out generic site-wide growth and the pandemic-era reading surge.
At face value, attention tracks reality: naive OLS, log(attention share) on the actual homicide rate, slope +0.1626, 95% CI [+0.0874, +0.2378] — excludes zero, R²=0.359, agreeing under HC3-robust SE and a distribution-free Spearman correlation (ρ=+0.591, p=1.1e-09). But both series trace the same one-time pandemic-era arc — up through 2020–2022, down since — and controlling for that shared shape with a quadratic time trend collapses the link: the rate's own coefficient falls to +0.0649, 95% CI [-0.0253, +0.1550] — contains zero. Most of what looked like coverage tracking crime is two humps lining up, not month-to-month responsiveness.
The headline fact is a timing gap, not a fitted coefficient. Each series' own data-determined peak month (3-month centered rolling maximum, not hand-picked): the actual homicide rate peaked 2020-07-01, at 8.6 per 100,000 — the pandemic-era surge widely reported at the time. Crime-article attention did not peak until 2022-09-01, 26 months later. By then the actual rate had already fallen 12.8% from its own high, to 7.5 per 100,000 — public attention to crime peaked while the real decline was already more than two years underway.
From the actual rate's own 2020-07 peak forward, both series do eventually fall: the rate at -0.680 points/year, CI [-0.792, -0.568] — excludes zero, and log(attention share) at -0.134/year, CI [-0.183, -0.085] — excludes zero. A direct test of whether the two decline at a statistically distinguishable pace, once both are indexed to 100 at the rate's own peak month, does not clear the bar: gap -3.71 index points/year, 95% CI [-9.06, +1.63] — contains zero. The honest reading is narrow: this run can show attention peaked 26 months late, not that it then kept falling slower than reality once it finally turned.
Neither series is stuck at its pandemic-era high today. Last 12 months on file vs. the pre-pandemic baseline (2019–Feb 2020): the actual rate sits -18.6% below baseline (CI [-1.48, -0.69] pts, excludes zero) — homicide is measurably rarer now than before the pandemic ever started. Attention has fallen further: -42.1% below its own baseline (CI [-12.56, -9.06] views-per-million, excludes zero). Both move in the same direction in the end; the gap this run can actually document is in when each one turned, not whether either one did.
Five specifications, in the order the question is actually asked
| Specification | Coefficient | 95% CI | Fit | Verdict |
|---|---|---|---|---|
| Naive: log(attention share) ~ actual rate | +0.1626 | [+0.0874, +0.2378] | R²=0.359 | excludes zero, p=2.2e-05 |
| Same, net of a shared quadratic time trend | +0.0649 | [-0.0253, +0.1550] | R²=0.557 | contains zero, p=0.158 |
| Actual rate, decline since its own 2020-07 peak (pts/yr) | -0.6799 | [-0.7919, -0.5680] | — | excludes zero, p=1.1e-32 |
| Attention share, decline since the rate's 2020-07 peak (log pts/yr) | -0.1339 | [-0.1826, -0.0852] | — | excludes zero, p=7.0e-08 |
| Indexed decline-rate gap, attention minus rate (pts/yr) | -3.7132 | [-9.0567, +1.6304] | — | contains zero, p=0.173 |
Method. CDC's “Mapping Injury, Overdose, and Violence —
National” dataset (data.cdc.gov resource t6u2-f84c), filtered to
intent=All_Homicide, type=month, geoid=USA,
keyless Socrata API, 89 months,
2019-01-01 to 2026-05-01. Wikipedia's own Pageviews REST
API (wikimedia.org, keyless, no account), monthly views for five crime-related
English Wikipedia articles summed into a basket, divided by that month's total
en.wikipedia pageview count (also pulled from the same API's aggregate endpoint) and
multiplied by 1,000,000 — “attention share” is basket views per
million site-wide views, which removes generic traffic growth and the pandemic-era
reading surge rather than leaving them in the numerator unadjusted. Peaks are each
series' own maximum of a 3-month centered rolling mean, not a hand-picked date.
Standard errors are Newey-West HAC (6 lags) throughout, given month-to-month
autocorrelation in both series; HC3-robust and Spearman checks are reported
alongside the naive specification and agree with it.
Limits, stated plainly. Wikipedia pageviews measure reader-initiated lookups, not newsroom output volume — a substitution for “coverage,” named above, not a silent swap; a reader going to look something up after seeing a headline is a downstream signal of coverage, not coverage itself, and the two could diverge in ways this run cannot see. The 5-article basket is a judgment call, not an exhaustive list of crime-related English Wikipedia pages. The actual-rate series is homicide specifically, the most severe and best-counted violent crime category, not crime overall. The indexed slope-difference test (post-peak decline rates) is underpowered at n=71 post-peak months to rule out a real but smaller gap than this run can detect — its own contains-zero result should be read as “not established here,” not as proof the two decline at an identical pace.
crime_cdc_homicide_590.csv · crime_attention_590.csv · fit output (JSON).