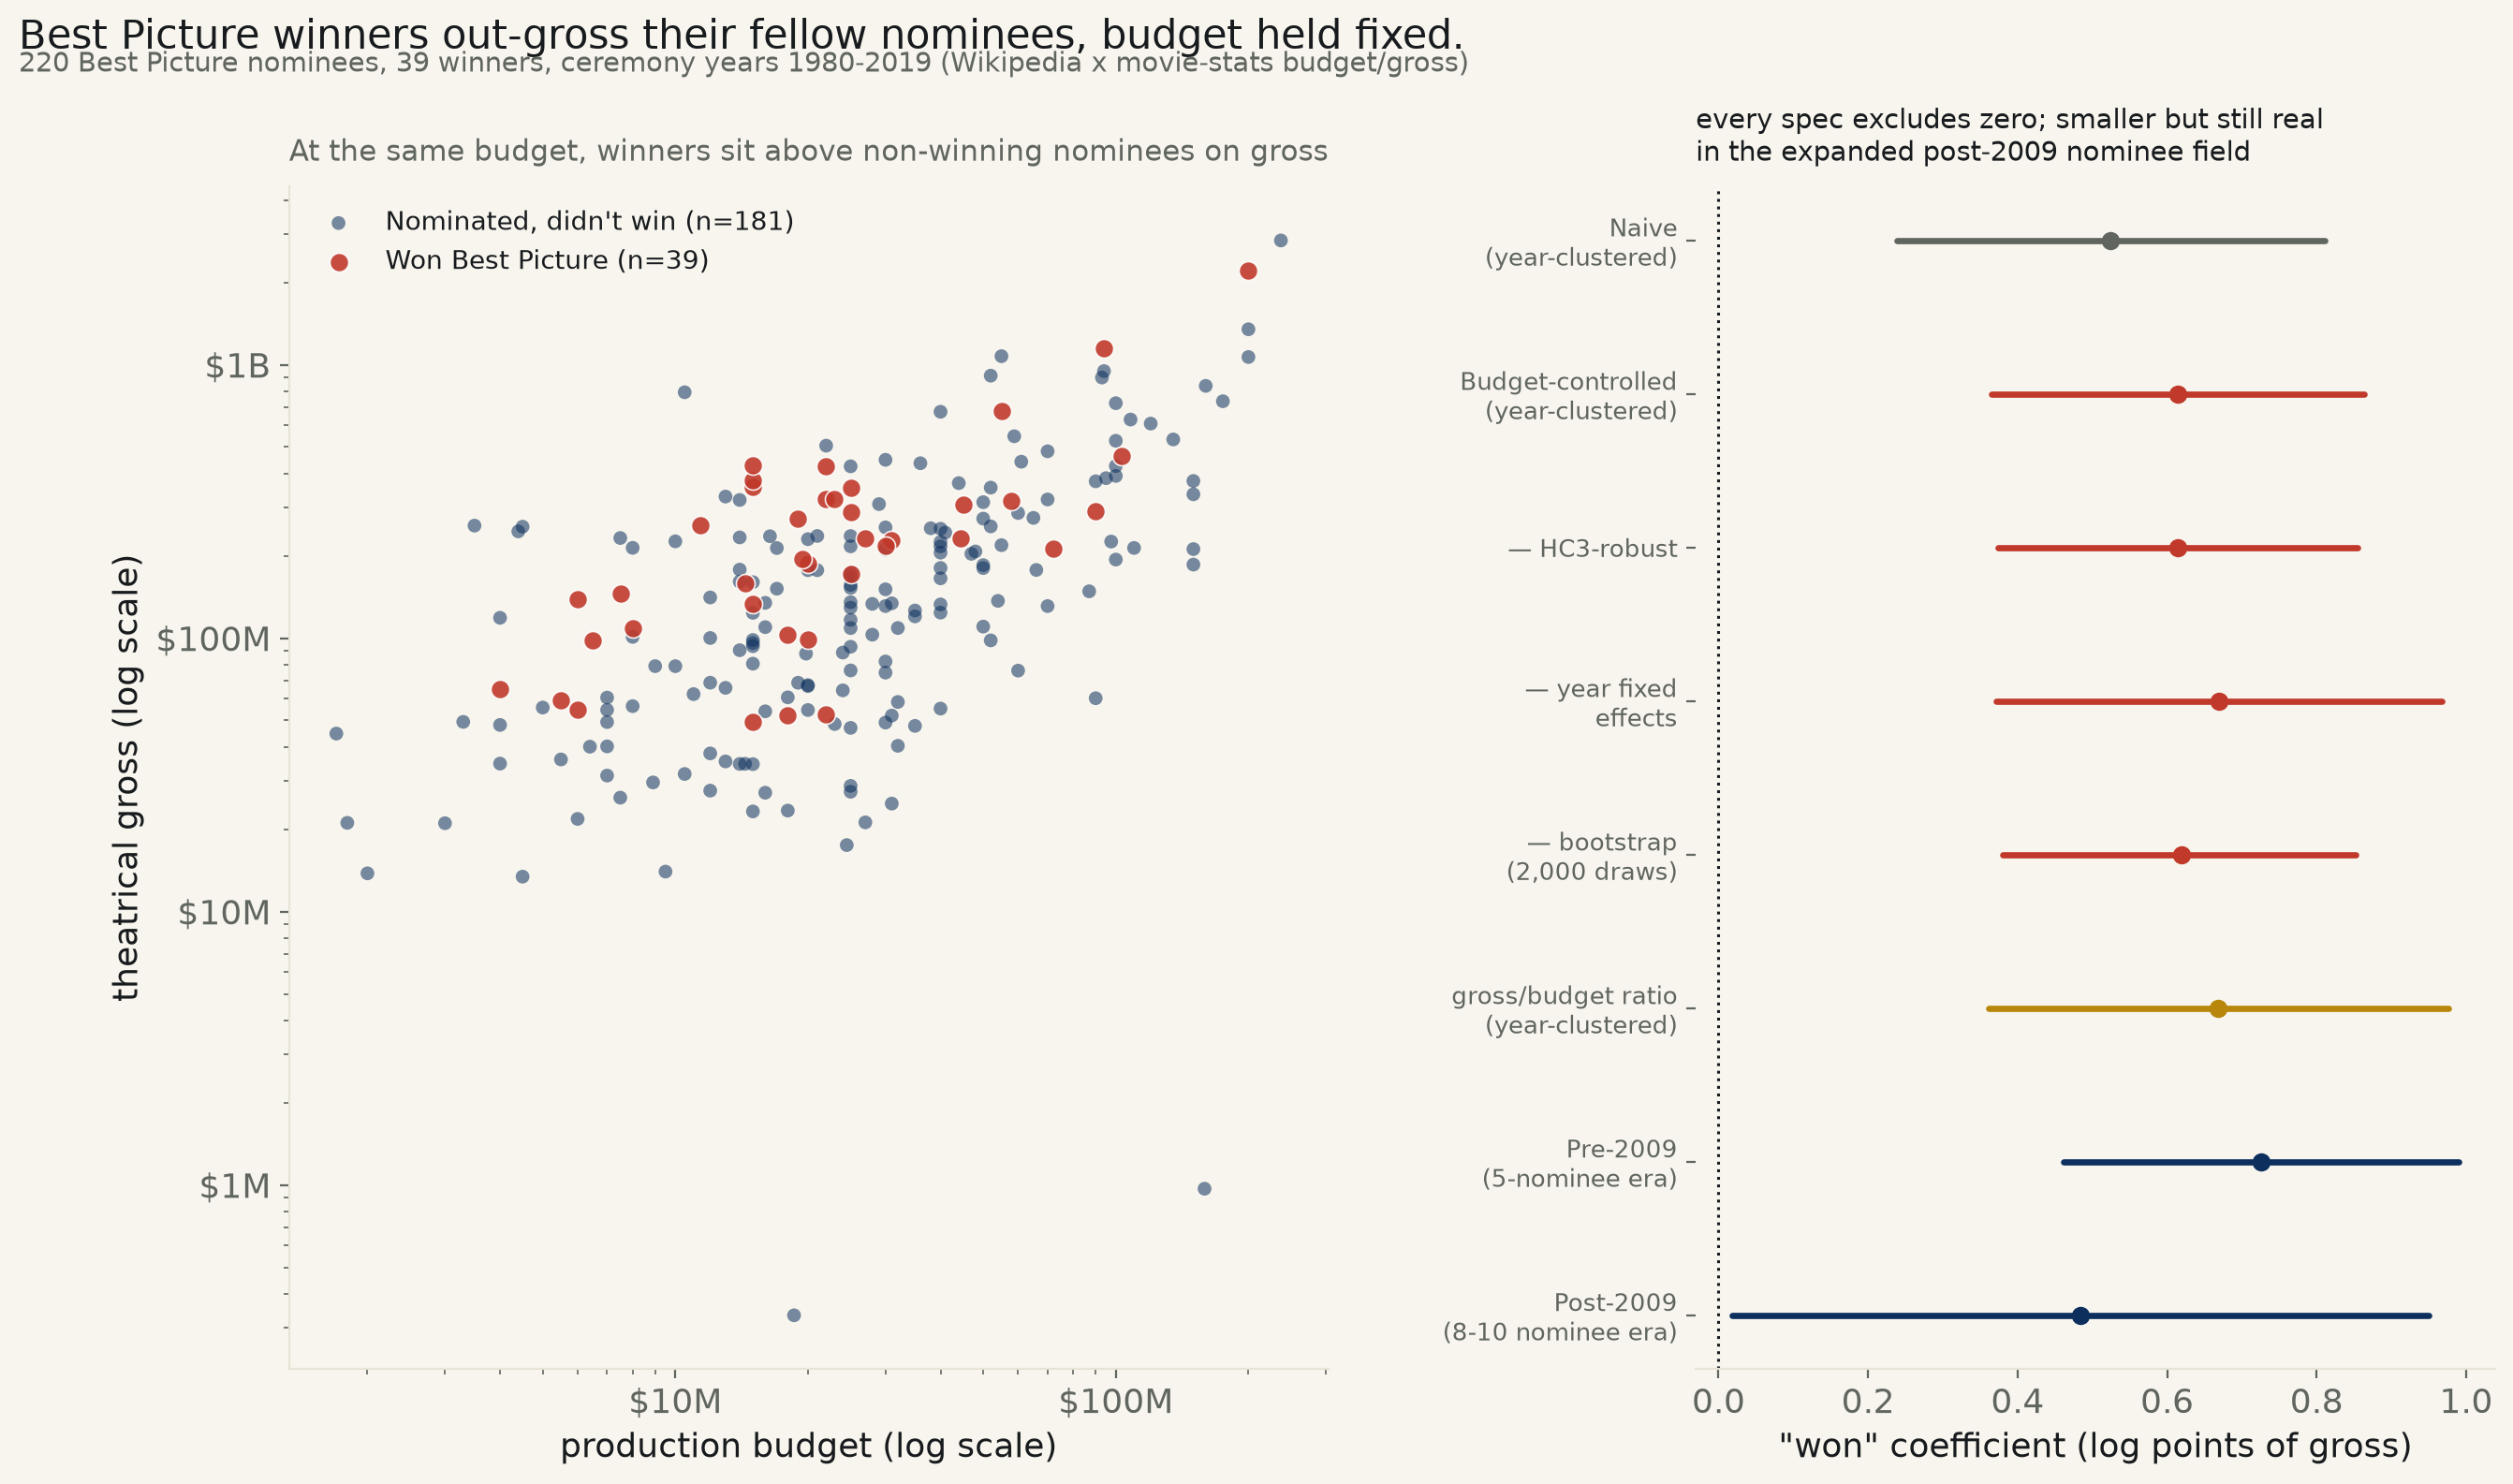
220 Best Picture nominees matched to real budget and gross figures, 1980–2019, 39 winners. Year-clustered, budget-controlled OLS: winners gross +0.614 log points more than fellow nominees at the same budget, 95% CI [+0.366, +0.863] — excludes zero, roughly 1.8×. But this is total lifetime gross, not a measured post-ceremony bump — see the limit below before reading this as proof winning moves the box office.
Backlog #90: “Does an Oscar boost box office? Event study — [modest].” TMDB, the idea's own named source, needs an API key not on file — the identical block runs 534 and 560 hit on this exact source. No public, keyless source publishes week-by-week theatrical grosses for every Best Picture nominee back to 1980, which is what a genuine event study (isolating a post-ceremony bump from a film's normal box-office decay curve) would need. So this run substitutes the comparison the real academic literature on this question uses when week-level data isn't available — Nelson, Donihue, Waldman & Wheaton's 2001 “What's an Oscar Worth?” compares winners' and non-winning nominees' total theatrical gross, not a week-by-week bump — named here as a substitution, not a silent swap.
Every Academy Award Best Picture nominee, ceremony years 1980–2019, read from Wikipedia's own nominee-list tables (the winner is the first film listed in each year's block, Wikipedia's own table convention, checked against several known years before trusting it at scale) and matched by title and release year to danielgrijalva/movie-stats, the same keyless GitHub budget+gross mirror runs 528, 534 and 560 used. 220 nominees matched to a real, nonzero budget and gross figure (of 266 total nominees parsed; the movie-stats source starts in 1980 and some titles don't match cleanly, both expected and stated, not a silent drop) — 39 winners, 181 nominees that lost.
Winners out-gross their fellow nominees, and it isn't close. Mean gross for winners, $302,768,623, against $220,579,605 for nominees that lost (medians $227,514,205 vs. $134,095,253). A plain comparison of means confounds budget — voters' taste and box-office success both correlate with how much a studio spent — so the regression this desk reports controls for it directly: log(gross) on a WON indicator plus log(budget), year-clustered SE (nominees sharing a ceremony year aren't independent draws of the box-office climate). The win premium: +0.614 log points, 95% CI [+0.366, +0.863] — excludes zero, p=1.3e-06 — roughly a 1.8× multiple on gross, budget held fixed. HC3-robust SE agrees ([+0.374, +0.854]), as does swapping the linear-year control for full year fixed effects ([+0.372, +0.967]), a budget-normalized gross/budget-ratio framing that needs no separate budget term ([+0.361, +0.976]), a distribution-free Mann-Whitney test on raw gross (p=0.006), and a 2,000-draw bootstrap resampling whole ceremony years rather than individual films ([+0.380, +0.852], 100% of resampled slopes positive).
The field's own 2009 expansion, from 5 nominees to as many as 10, is a real structural break in the category's selection rules — worth checking on its own. Split at that year: the win premium is larger in the 5-nominee era, +0.726, 95% CI [+0.461, +0.990] — excludes zero — and smaller in the expanded 8-10 nominee era, +0.484, CI [+0.018, +0.950] — still excludes zero, but only barely. A direct interaction test on whether the win premium itself genuinely shrank between eras, however, contains zero: -0.280 log points, CI [-0.819, +0.260], p=0.31 — the point estimates move in the direction a more crowded, more arthouse-friendly field would predict, but 95 post-2009 nominee-years isn't enough to confirm the shift is real rather than noise.
Named. Titanic (1997) is this sample's biggest-grossing winner, $2,201,647,264. The Hurt Locker (2009) is the smallest, $49,259,766 — a reminder the premium is a statistical tendency across 39 winners, not a guarantee for any one film. For scale on the other side: Avatar (2009), a losing nominee, grossed $2,847,246,203 — more than every winner in this sample except one — a reminder that box office and Best Picture voting are related but very far from the same contest.
Limits, stated plainly — this is the one that matters most. “Gross” here is a film's total theatrical run, not a measured bump in the weeks after the ceremony. Best Picture winners are announced two to three months into a calendar year, by which point most nominees (especially the wide, awards-season-timed releases this category favors) have already banked most of their eventual gross. That means this result is at least as consistent with the Academy tending to reward films that were already commercial hits (reverse causation, or a shared cause — audience and voter taste moving together) as with winning itself pulling more people into theaters afterward. A genuine event study, with week-by-week grosses before and after the ceremony, is the only design that could tell those apart, and no keyless source reaches that data for this sample. Read plainly: winners really do gross more than their fellow nominees, reliably, across every cut tried — but “boost” in the backlog's own phrasing implies a causal arrow this design cannot establish.
The "won" coefficient, seven specifications
| Specification | n | "won" coefficient (log points of gross) | 95% CI | Fit | Verdict |
|---|---|---|---|---|---|
| Naive (year-clustered SE) | n=220 | +0.524 | [+0.238, +0.810] | R²=0.031 | excludes zero, p=3.3e-04 |
| Budget-controlled (year-clustered) | n=220 | +0.614 | [+0.366, +0.863] | R²=0.314 | excludes zero, p=1.3e-06 |
| Budget-controlled, HC3-robust | n=220 | +0.614 | [+0.374, +0.854] | R²=0.314 | excludes zero, p=5.2e-07 |
| Budget-controlled, year fixed effects | n=220 | +0.670 | [+0.372, +0.967] | R²=0.429 | excludes zero, p=1.0e-05 |
| Gross/budget ratio (year-clustered) | n=220 | +0.669 | [+0.361, +0.976] | R²=0.059 | excludes zero, p=2.0e-05 |
| Pre-2009 (5-nominee era) | n=125 | +0.726 | [+0.461, +0.990] | R²=0.332 | excludes zero, p=7.4e-08 |
| Post-2009 (8-10 nominee era) | n=95 | +0.484 | [+0.018, +0.950] | R²=0.308 | excludes zero, p=0.042 |
Method. Wikipedia's “List of Academy Award winners and nominees for Best Picture” publishes a decade-by-decade table of nominees for every ceremony; the winner is consistently the first film listed within each year's block, a convention checked against several known years (1960 The Apartment, 1961 West Side Story, 1994 Forrest Gump) before being trusted across all 220 rows kept. Titles were normalized (lowercased, punctuation stripped, leading articles dropped) and matched to danielgrijalva/movie-stats within ±1 calendar year of the nominee's own listed release year, since awards-eligibility year and a film's IMDb-sourced release year occasionally differ by one year for the same title. Rows without both a positive budget and a positive gross in the matched source were dropped before any fit ran (not imputed). A mechanical sanity check (exactly one winner per ceremony year) ran before any analysis and would have halted the pipeline had it failed.
Limits, stated plainly. “Gross” is lifetime theatrical gross, not a week-level measurement of the weeks immediately after the ceremony — the design an actual event study needs, and the one this backlog item's own “event study” phrasing implies. Because winners are announced two to three months into the year and most nominees have already completed the bulk of their theatrical run by then, this result cannot distinguish “winning causes more people to see the film” from “the Academy tends to reward films that were already commercial hits,” or from a third factor (critical and popular acclaim moving together) driving both. The movie-stats source begins in 1980, so earlier Best Picture history (1929–1979) is entirely excluded, not sampled. Gross figures in this source are not currency-adjusted for inflation across the 40-year window; the budget control partially addresses scale but a film's own era is also captured by the year-fixed-effects spec, which agrees with the simpler linear-year version.
oscarbudget_588.csv · fit output (JSON).
| Ceremony year | Film | Won? | Budget | Gross |
|---|---|---|---|---|
| 1980 | Ordinary People | WON | $6,000,000 | $54,766,923 |
| 1980 | Raging Bull | $18,000,000 | $23,402,427 | |
| 1981 | Chariots of Fire | WON | $5,500,000 | $59,303,359 |
| 1981 | Reds | $32,000,000 | $40,382,659 | |
| 1982 | Gandhi | WON | $22,000,000 | $52,767,889 |
| 1982 | E.T. the Extra-Terrestrial | $10,500,000 | $792,910,554 | |
| 1982 | Missing | $9,500,000 | $14,000,000 | |
| 1982 | Tootsie | $21,000,000 | $177,200,000 | |
| 1982 | The Verdict | $16,000,000 | $53,993,738 | |
| 1983 | Terms of Endearment | WON | $8,000,000 | $108,423,749 |
| 1983 | The Big Chill | $8,000,000 | $56,399,659 | |
| 1983 | The Right Stuff | $27,000,000 | $21,192,315 | |
| 1984 | Amadeus | WON | $18,000,000 | $52,066,791 |
| 1984 | The Killing Fields | $14,400,000 | $34,700,291 | |
| 1984 | A Passage to India | $16,000,000 | $27,201,487 | |
| 1984 | A Soldier's Story | $6,000,000 | $21,821,347 | |
| 1985 | Out of Africa | WON | $31,000,000 | $227,514,205 |
| 1985 | The Color Purple | $15,000,000 | $98,467,863 | |
| 1985 | Witness | $12,000,000 | $68,706,993 | |
| 1986 | Platoon | WON | $6,000,000 | $138,545,632 |
| 1986 | Children of a Lesser God | $10,500,000 | $31,853,080 | |
| 1986 | Hannah and Her Sisters | $6,400,000 | $40,084,041 | |
| 1986 | The Mission | $24,500,000 | $17,502,499 | |
| 1986 | A Room with a View | $3,000,000 | $21,041,453 | |
| 1987 | Broadcast News | $20,000,000 | $67,331,309 | |
| 1987 | Fatal Attraction | $14,000,000 | $320,145,693 | |
| 1987 | Moonstruck | $15,000,000 | $80,642,217 | |
| 1988 | Rain Man | WON | $25,000,000 | $354,825,435 |
| 1988 | Dangerous Liaisons | $14,000,000 | $34,670,720 | |
| 1988 | Mississippi Burning | $15,000,000 | $34,603,943 | |
| 1988 | Working Girl | $28,000,000 | $102,953,112 | |
| 1989 | Driving Miss Daisy | WON | $7,500,000 | $145,793,296 |
| 1989 | Born on the Fourth of July | $14,000,000 | $161,001,698 | |
| 1989 | Dead Poets Society | $16,400,000 | $235,860,116 | |
| 1990 | Dances With Wolves | WON | $22,000,000 | $424,208,848 |
| 1990 | Awakenings | $31,000,000 | $52,096,475 | |
| 1990 | Ghost | $22,000,000 | $505,703,557 | |
| 1990 | The Godfather Part III | $54,000,000 | $136,861,392 | |
| 1990 | Goodfellas | $25,000,000 | $46,963,277 | |
| 1991 | The Silence of the Lambs | WON | $19,000,000 | $272,742,922 |
| 1991 | Beauty and the Beast | $25,000,000 | $424,967,620 | |
| 1991 | Bugsy | $30,000,000 | $49,114,016 | |
| 1991 | JFK | $40,000,000 | $205,405,498 | |
| 1991 | The Prince of Tides | $30,000,000 | $74,787,599 | |
| 1992 | Unforgiven | WON | $14,400,000 | $159,157,447 |
| 1992 | A Few Good Men | $41,000,000 | $243,240,178 | |
| 1992 | Scent of a Woman | $31,000,000 | $134,095,253 | |
| 1993 | Schindler's List | WON | $22,000,000 | $322,161,245 |
| 1993 | The Fugitive | $44,000,000 | $368,875,760 | |
| 1993 | In the Name of the Father | $13,000,000 | $65,796,862 | |
| 1993 | The Piano | $7,000,000 | $40,185,556 | |
| 1993 | The Remains of the Day | $15,000,000 | $23,237,911 | |
| 1994 | Forrest Gump | WON | $55,000,000 | $678,226,133 |
| 1994 | Four Weddings and a Funeral | $4,400,000 | $245,700,832 | |
| 1994 | Pulp Fiction | $8,000,000 | $213,928,762 | |
| 1994 | Quiz Show | $31,000,000 | $24,822,619 | |
| 1994 | The Shawshank Redemption | $25,000,000 | $28,817,291 | |
| 1995 | Braveheart | WON | $72,000,000 | $213,216,216 |
| 1995 | Apollo 13 | $52,000,000 | $355,237,933 | |
| 1995 | Babe | $30,000,000 | $254,134,910 | |
| 1995 | Sense and Sensibility | $16,000,000 | $134,582,776 | |
| 1996 | The English Patient | WON | $27,000,000 | $231,976,425 |
| 1996 | Fargo | $7,000,000 | $60,611,975 | |
| 1996 | Jerry Maguire | $50,000,000 | $273,552,592 | |
| 1996 | Secrets & Lies | $4,500,000 | $13,417,292 | |
| 1996 | Shine | $5,500,000 | $35,999,081 | |
| 1997 | Titanic | WON | $200,000,000 | $2,201,647,264 |
| 1997 | As Good as It Gets | $50,000,000 | $314,178,011 | |
| 1997 | The Full Monty | $3,500,000 | $257,938,649 | |
| 1997 | Good Will Hunting | $10,000,000 | $225,933,435 | |
| 1997 | L.A. Confidential | $35,000,000 | $126,216,940 | |
| 1998 | Shakespeare in Love | WON | $25,000,000 | $289,317,794 |
| 1998 | Elizabeth | $30,000,000 | $82,150,642 | |
| 1998 | Life Is Beautiful | $20,000,000 | $230,098,753 | |
| 1998 | Saving Private Ryan | $70,000,000 | $482,349,603 | |
| 1998 | The Thin Red Line | $52,000,000 | $98,126,565 | |
| 1999 | American Beauty | WON | $15,000,000 | $356,296,601 |
| 1999 | The Cider House Rules | $24,000,000 | $88,545,092 | |
| 1999 | The Green Mile | $60,000,000 | $286,801,374 | |
| 1999 | The Insider | $90,000,000 | $60,289,912 | |
| 1999 | The Sixth Sense | $40,000,000 | $672,806,292 | |
| 2000 | Gladiator | WON | $103,000,000 | $465,380,802 |
| 2000 | Chocolat | $25,000,000 | $152,699,976 | |
| 2000 | Crouching Tiger, Hidden Dragon | $17,000,000 | $213,525,736 | |
| 2000 | Erin Brockovich | $52,000,000 | $256,271,286 | |
| 2000 | Traffic | $48,000,000 | $207,515,725 | |
| 2001 | A Beautiful Mind | WON | $58,000,000 | $316,791,257 |
| 2001 | Gosford Park | $19,800,000 | $87,754,044 | |
| 2001 | In the Bedroom | $1,700,000 | $44,763,181 | |
| 2001 | The Lord of the Rings: The Fellowship of the Ring | $93,000,000 | $897,690,072 | |
| 2001 | Moulin Rouge! | $50,000,000 | $184,935,320 | |
| 2002 | Chicago | WON | $45,000,000 | $306,776,732 |
| 2002 | Gangs of New York | $100,000,000 | $193,772,504 | |
| 2002 | The Hours | $25,000,000 | $108,846,072 | |
| 2002 | The Lord of the Rings: The Two Towers | $94,000,000 | $947,495,095 | |
| 2002 | The Pianist | $35,000,000 | $120,072,577 | |
| 2003 | The Lord of the Rings: The Return of the King | WON | $94,000,000 | $1,146,030,912 |
| 2003 | Lost in Translation | $4,000,000 | $118,686,937 | |
| 2003 | Master and Commander: The Far Side of the World | $150,000,000 | $211,622,535 | |
| 2003 | Mystic River | $25,000,000 | $156,595,191 | |
| 2003 | Seabiscuit | $87,000,000 | $148,336,445 | |
| 2004 | Million Dollar Baby | WON | $30,000,000 | $216,763,646 |
| 2004 | The Aviator | $110,000,000 | $213,719,942 | |
| 2004 | Finding Neverland | $25,000,000 | $116,650,613 | |
| 2004 | Ray | $40,000,000 | $123,971,376 | |
| 2004 | Sideways | $16,000,000 | $109,706,931 | |
| 2005 | Crash | WON | $6,500,000 | $98,410,061 |
| 2005 | Brokeback Mountain | $14,000,000 | $178,062,759 | |
| 2005 | Capote | $7,000,000 | $49,327,405 | |
| 2005 | Good Night, and Good Luck | $7,000,000 | $54,641,191 | |
| 2005 | Munich | $70,000,000 | $130,982,129 | |
| 2006 | The Departed | WON | $90,000,000 | $291,465,373 |
| 2006 | Babel | $25,000,000 | $135,330,182 | |
| 2006 | Letters from Iwo Jima | $19,000,000 | $68,673,228 | |
| 2006 | Little Miss Sunshine | $8,000,000 | $101,058,954 | |
| 2007 | No Country for Old Men | WON | $25,000,000 | $171,627,166 |
| 2007 | Atonement | $30,000,000 | $131,016,624 | |
| 2007 | Juno | $7,500,000 | $232,372,681 | |
| 2007 | Michael Clayton | $25,000,000 | $92,991,835 | |
| 2007 | There Will Be Blood | $25,000,000 | $76,182,388 | |
| 2008 | Slumdog Millionaire | WON | $15,000,000 | $378,410,542 |
| 2008 | The Curious Case of Benjamin Button | $150,000,000 | $335,802,786 | |
| 2008 | Frost/Nixon | $25,000,000 | $27,426,335 | |
| 2008 | Milk | $20,000,000 | $54,589,558 | |
| 2008 | The Reader | $32,000,000 | $108,902,486 | |
| 2009 | The Hurt Locker | WON | $15,000,000 | $49,259,766 |
| 2009 | Avatar | $237,000,000 | $2,847,246,203 | |
| 2009 | The Blind Side | $29,000,000 | $309,208,309 | |
| 2009 | District 9 | $30,000,000 | $210,888,950 | |
| 2009 | An Education | $7,500,000 | $26,096,852 | |
| 2009 | Inglourious Basterds | $70,000,000 | $321,457,747 | |
| 2009 | A Serious Man | $7,000,000 | $31,430,334 | |
| 2009 | Up | $175,000,000 | $735,099,102 | |
| 2009 | Up in the Air | $25,000,000 | $166,842,739 | |
| 2010 | The King's Speech | WON | $15,000,000 | $427,374,317 |
| 2010 | Black Swan | $13,000,000 | $329,398,046 | |
| 2010 | The Fighter | $25,000,000 | $129,190,869 | |
| 2010 | Inception | $160,000,000 | $836,836,967 | |
| 2010 | The Kids Are All Right | $4,000,000 | $34,758,951 | |
| 2010 | 127 Hours | $18,000,000 | $60,738,797 | |
| 2010 | The Social Network | $40,000,000 | $224,920,375 | |
| 2010 | Toy Story 3 | $200,000,000 | $1,066,970,811 | |
| 2010 | True Grit | $38,000,000 | $252,276,927 | |
| 2010 | Winter's Bone | $2,000,000 | $13,796,834 | |
| 2011 | The Artist | WON | $15,000,000 | $133,432,856 |
| 2011 | The Descendants | $20,000,000 | $177,243,185 | |
| 2011 | Extremely Loud & Incredibly Close | $40,000,000 | $55,247,881 | |
| 2011 | The Help | $25,000,000 | $216,639,112 | |
| 2011 | Hugo | $150,000,000 | $185,770,310 | |
| 2011 | Midnight in Paris | $17,000,000 | $151,653,750 | |
| 2011 | Moneyball | $50,000,000 | $110,206,216 | |
| 2011 | The Tree of Life | $32,000,000 | $58,409,247 | |
| 2011 | War Horse | $66,000,000 | $177,584,879 | |
| 2012 | Argo | WON | $44,500,000 | $232,325,503 |
| 2012 | Amour | $8,900,000 | $29,664,140 | |
| 2012 | Beasts of the Southern Wild | $1,800,000 | $21,107,746 | |
| 2012 | Django Unchained | $100,000,000 | $426,074,373 | |
| 2012 | Life of Pi | $120,000,000 | $609,016,565 | |
| 2012 | Lincoln | $65,000,000 | $275,293,450 | |
| 2012 | Les Misérables | $61,000,000 | $441,809,770 | |
| 2012 | Silver Linings Playbook | $21,000,000 | $236,412,453 | |
| 2012 | Zero Dark Thirty | $40,000,000 | $132,820,716 | |
| 2013 | 12 Years a Slave | WON | $20,000,000 | $187,733,202 |
| 2013 | American Hustle | $40,000,000 | $251,171,807 | |
| 2013 | Captain Phillips | $55,000,000 | $218,791,811 | |
| 2013 | Dallas Buyers Club | $5,000,000 | $55,736,588 | |
| 2013 | Gravity | $100,000,000 | $723,192,705 | |
| 2013 | Her | $23,000,000 | $48,517,427 | |
| 2013 | Nebraska | $12,000,000 | $27,682,872 | |
| 2013 | Philomena | $12,000,000 | $100,129,872 | |
| 2013 | The Wolf of Wall Street | $100,000,000 | $392,000,694 | |
| 2014 | Birdman or (The Unexpected Virtue of Ignorance) | WON | $18,000,000 | $103,215,094 |
| 2014 | American Sniper | $58,800,000 | $547,426,372 | |
| 2014 | Boyhood | $4,000,000 | $48,137,666 | |
| 2014 | The Grand Budapest Hotel | $25,000,000 | $172,945,750 | |
| 2014 | The Imitation Game | $14,000,000 | $233,555,708 | |
| 2014 | Selma | $20,000,000 | $66,787,908 | |
| 2014 | The Theory of Everything | $15,000,000 | $123,726,688 | |
| 2014 | Whiplash | $3,300,000 | $49,396,747 | |
| 2015 | Spotlight | WON | $20,000,000 | $98,690,254 |
| 2015 | The Big Short | $28,000,000 | $133,440,870 | |
| 2015 | Bridge of Spies | $40,000,000 | $165,478,348 | |
| 2015 | Brooklyn | $11,000,000 | $62,402,155 | |
| 2015 | Mad Max: Fury Road | $150,000,000 | $375,658,750 | |
| 2015 | The Martian | $108,000,000 | $630,162,448 | |
| 2015 | The Revenant | $135,000,000 | $532,950,503 | |
| 2015 | Room | $13,000,000 | $35,401,758 | |
| 2016 | Moonlight | WON | $4,000,000 | $65,336,603 |
| 2016 | Arrival | $47,000,000 | $203,388,186 | |
| 2016 | Fences | $24,000,000 | $64,414,761 | |
| 2016 | Hacksaw Ridge | $40,000,000 | $180,563,636 | |
| 2016 | Hell or High Water | $12,000,000 | $37,879,877 | |
| 2016 | Hidden Figures | $25,000,000 | $236,225,193 | |
| 2016 | La La Land | $30,000,000 | $448,906,865 | |
| 2016 | Lion | $12,000,000 | $140,853,810 | |
| 2016 | Manchester by the Sea | $9,000,000 | $78,988,148 | |
| 2017 | The Shape of Water | WON | $19,400,000 | $195,333,312 |
| 2017 | Darkest Hour | $30,000,000 | $150,847,274 | |
| 2017 | Dunkirk | $100,000,000 | $527,016,307 | |
| 2017 | Get Out | $4,500,000 | $255,589,157 | |
| 2017 | Lady Bird | $10,000,000 | $78,966,486 | |
| 2017 | Phantom Thread | $35,000,000 | $47,756,590 | |
| 2017 | The Post | $50,000,000 | $180,419,231 | |
| 2017 | Three Billboards Outside Ebbing, Missouri | $15,000,000 | $160,192,267 | |
| 2018 | Green Book | WON | $23,000,000 | $321,752,656 |
| 2018 | Black Panther | $200,000,000 | $1,347,597,973 | |
| 2018 | BlacKkKlansman | $15,000,000 | $93,413,709 | |
| 2018 | Bohemian Rhapsody | $52,000,000 | $911,902,649 | |
| 2018 | The Favourite | $15,000,000 | $95,918,706 | |
| 2018 | A Star Is Born | $36,000,000 | $436,188,866 | |
| 2018 | Vice | $60,000,000 | $76,073,488 | |
| 2019 | Parasite | WON | $11,400,000 | $258,908,054 |
| 2019 | Ford v Ferrari | $97,600,000 | $225,508,210 | |
| 2019 | The Irishman | $159,000,000 | $968,853 | |
| 2019 | Jojo Rabbit | $14,000,000 | $90,335,025 | |
| 2019 | Joker | $55,000,000 | $1,074,427,370 | |
| 2019 | Little Women | $40,000,000 | $216,601,214 | |
| 2019 | Marriage Story | $18,600,000 | $333,686 | |
| 2019 | 1917 | $95,000,000 | $384,623,579 | |
| 2019 | Once Upon a Time in Hollywood | $90,000,000 | $374,565,754 |