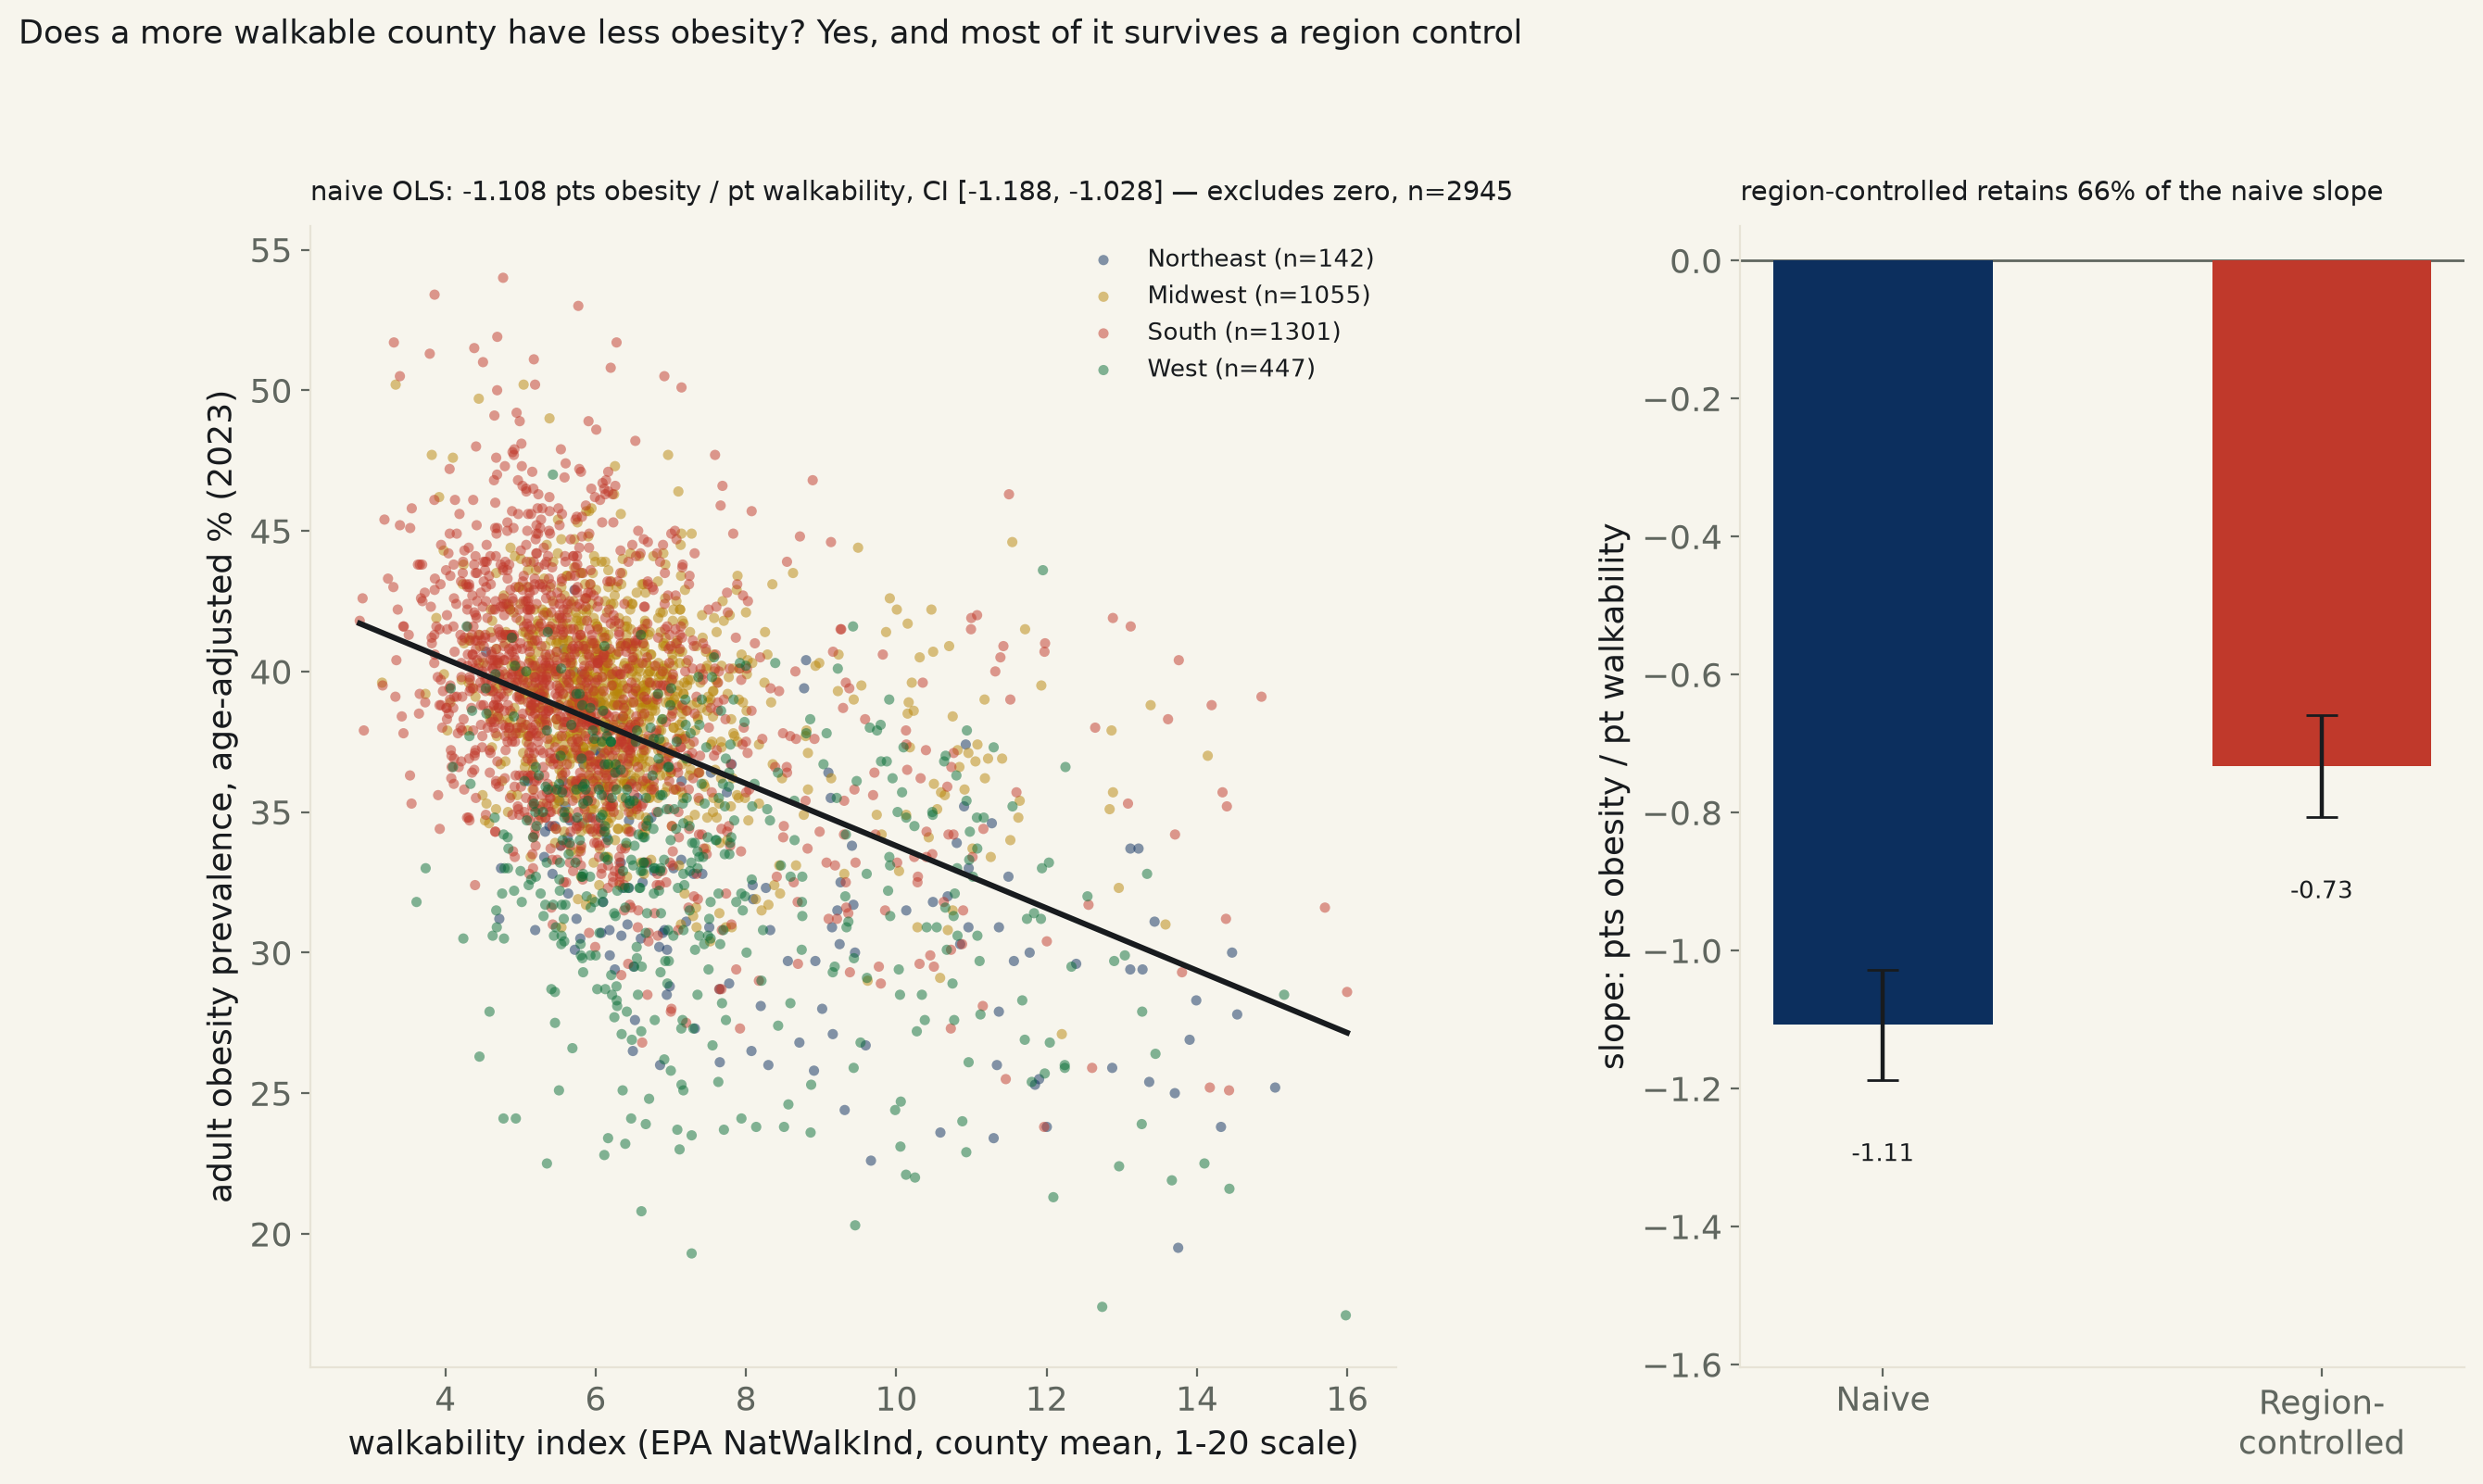
2,945 US counties, 48 states + DC, 2023. EPA's National Walkability Index (block-group NatWalkInd, population-weighted to the county, 1-20 scale) vs. CDC PLACES' age-adjusted adult obesity prevalence. Naive slope: -1.108 points of obesity per point of walkability, 95% CI [-1.188, -1.028] — excludes zero, R²=0.200.
Backlog #77: “does walkability predict lower obesity? City-level”, previously untouched. The built environment runs one direction in the public-health literature: a neighborhood where errands, transit, and work are reachable on foot produces more incidental daily activity than one where every trip requires a car. This run tests it at the county level, nationwide, rather than city-by-city — EPA's own National Walkability Index (block-group NatWalkInd, a 1-20 composite of residential density, land-use mix, and street-network design, aggregated here to 2,945 counties by population-weighted mean) against CDC PLACES' own small-area, age-adjusted adult obesity estimate, 48 states + DC, 2023 (see fetch_walkability_obesity_585.py for exact sourcing).
Naive: -1.108 points of obesity prevalence per 1-point rise in walkability, 95% CI [-1.188, -1.028], p=1.4e-144, R²=0.200 — excludes zero. An HC3-robust standard error agrees: CI [-1.204, -1.012], p=2.5e-112. A distribution-free Spearman rank correlation agrees on direction and significance: ρ=-0.389, p=3.4e-107. Population-weighting the fit — so Los Angeles County counts for more than a county of 600 people — moves the slope the same direction and further from zero, -1.310, CI [-1.366, -1.255], R²=0.420: this is not a result carried by thousands of tiny, thinly-populated counties.
The obvious confound — region — explains some of it, not most of it. Walkable counties cluster in the Northeast and West (region means: Midwest walk=6.45, obesity=38.8% (n=1055), Northeast walk=8.34, obesity=31.6% (n=142), South walk=6.02, obesity=39.2% (n=1301), West walk=7.54, obesity=32.5% (n=447)), and those regions differ from the South and Midwest on diet, income, and culture for reasons that have nothing to do with sidewalks. Adding Census-region fixed effects to the regression shrinks the slope to -0.733, CI [-0.807, -0.659], p=3.3e-79 — 66% of the naive size, but it still excludes zero by a wide margin. Region is a real confound here, not the whole explanation.
Named, and the plainest way to see it without a regression at all: Taliaferro, Georgia posts the lowest walkability score in the sample (2.86 of 20) and 41.8% adult obesity — above the 2,945-county mean (37.7%). Falls Church, Virginia posts the highest score (16.00) and 28.6% — well below it. San Francisco, California has the lowest obesity prevalence in the whole sample (17.1%) and a walkability score of 15.98, near the top of the national range. Perry, Alabama has the highest (54.0%) at a below-median score of 4.77.
A 4,000-draw bootstrap on the naive slope lands at [-1.203, -1.011], every one of 4,000 resampled slopes negative (100%) — the naive result is not a fragile artifact of a few leverage points.
Read plainly. Every specification tried — classical SE, HC3-robust SE, a distribution-free rank test, population weighting, a bootstrap, and a Census-region control — agrees on direction and excludes zero. The relationship survives the one obvious geographic confound tested here at roughly two-thirds its naive strength. It does not survive as proof of causation: this is a single-year cross-section of where people already live, not an experiment that moved anyone into a more walkable neighborhood, and the limits below state what it cannot rule out.
| Specification | n | slope, pts obesity prevalence per pt walkability (1-20 scale) | 95% CI | Verdict |
|---|---|---|---|---|
| Naive, classical SE | n=2945 | -1.108 | [-1.188, -1.028] | excludes zero, p=1.4e-144 |
| HC3-robust SE | n=2945 | -1.108 | [-1.204, -1.012] | excludes zero, p=2.5e-112 |
| Population-weighted WLS | n=2945 | -1.310 | [-1.366, -1.255] | excludes zero, p=0.0e+00 |
| Census-region-controlled | n=2945 | -0.733 | [-0.807, -0.659] | excludes zero, p=3.3e-79 |
15 least walkable counties
| County | Walkability (1-20) | Obesity, age-adj. | Population |
|---|---|---|---|
| Taliaferro, Georgia | 2.86 | 41.8% | 1,609 |
| Newton, Texas | 2.90 | 42.6% | 12,039 |
| Long, Georgia | 2.92 | 37.9% | 19,594 |
| Pope, Illinois | 3.16 | 39.6% | 3,707 |
| Surry, Virginia | 3.17 | 39.5% | 6,593 |
| Amite, Mississippi | 3.19 | 45.4% | 12,442 |
| Talbot, Georgia | 3.24 | 43.3% | 5,718 |
| Morgan, Tennessee | 3.31 | 43.0% | 21,573 |
| Jefferson, Mississippi | 3.32 | 51.7% | 6,941 |
| San Jacinto, Texas | 3.34 | 39.1% | 28,936 |
| Todd, South Dakota | 3.34 | 50.2% | 9,199 |
| Carroll, Mississippi | 3.35 | 40.4% | 9,535 |
| Cleveland, Arkansas | 3.37 | 42.2% | 7,378 |
| Claiborne, Mississippi | 3.39 | 50.5% | 8,617 |
| Jasper, Mississippi | 3.40 | 45.2% | 16,013 |
15 most walkable counties
| County | Walkability (1-20) | Obesity, age-adj. | Population |
|---|---|---|---|
| Falls Church, Virginia | 16.00 | 28.6% | 14,685 |
| San Francisco, California | 15.98 | 17.1% | 808,988 |
| Fairfax, Virginia | 15.70 | 31.6% | 25,144 |
| Multnomah, Oregon | 15.16 | 28.5% | 789,698 |
| Suffolk, Massachusetts | 15.04 | 25.2% | 768,425 |
| Harrisonburg, Virginia | 14.86 | 39.1% | 51,082 |
| Hudson, New Jersey | 14.54 | 27.8% | 705,472 |
| Richmond, New York | 14.47 | 30.0% | 490,687 |
| Denver, Colorado | 14.43 | 21.6% | 716,577 |
| District of Columbia, District of Columbia | 14.43 | 25.1% | 678,972 |
| Charlottesville, Virginia | 14.40 | 35.2% | 44,983 |
| Alexandria, Virginia | 14.39 | 31.2% | 155,230 |
| Lexington, Virginia | 14.34 | 35.7% | 7,528 |
| Queens, New York | 14.32 | 23.8% | 2,252,196 |
| Baltimore, Maryland | 14.20 | 38.8% | 565,239 |
Method. EPA's Smart Location Database v3 (Jan 2021) publishes NatWalkInd for every one of the nation's 220,740 census block groups, built from residential density, employment and land-use mix, and street-network design — the government's own composite walkability score, not a proxy assembled here. Block groups are aggregated to counties by population-weighted mean (each block group's TotPop as weight), not a plain average, so a county's emptiest, least-walkable tracts do not count the same as its densest downtown block. Obesity is CDC PLACES' own small-area model estimate, age-adjusted, built from BRFSS survey responses and released at county grain specifically so local health departments can use it without a local survey of their own. Both sources are joined on 5-digit county FIPS; 2,945 of 3,231 EPA-covered counties had a disclosed PLACES obesity estimate for 2023 (PLACES suppresses county estimates built from too small a BRFSS sample — Loving County, TX, the least populous county in the US at roughly 64 people, is the one EPA-matched county dropped for exactly this reason).
Limits, stated plainly. This is a single-year cross-section of where people already live, not a natural experiment that moved anyone into a more or less walkable neighborhood — it cannot separate a causal effect of the built environment from selection (health-conscious people choosing walkable neighborhoods) or from confounds this run does not measure directly: county median income, racial and ethnic composition, age distribution, and food access are all plausible common causes of both walkability and obesity that are not in this model. The Census-region control is a coarse four-bucket proxy for exactly those regional confounds, not a substitute for measuring them; it shows the relationship is not purely regional without ruling out income or demographics specifically. PLACES' estimate is itself model-based, not a direct county census, and carries its own confidence interval (not used in the regression here) that widens for smaller counties.