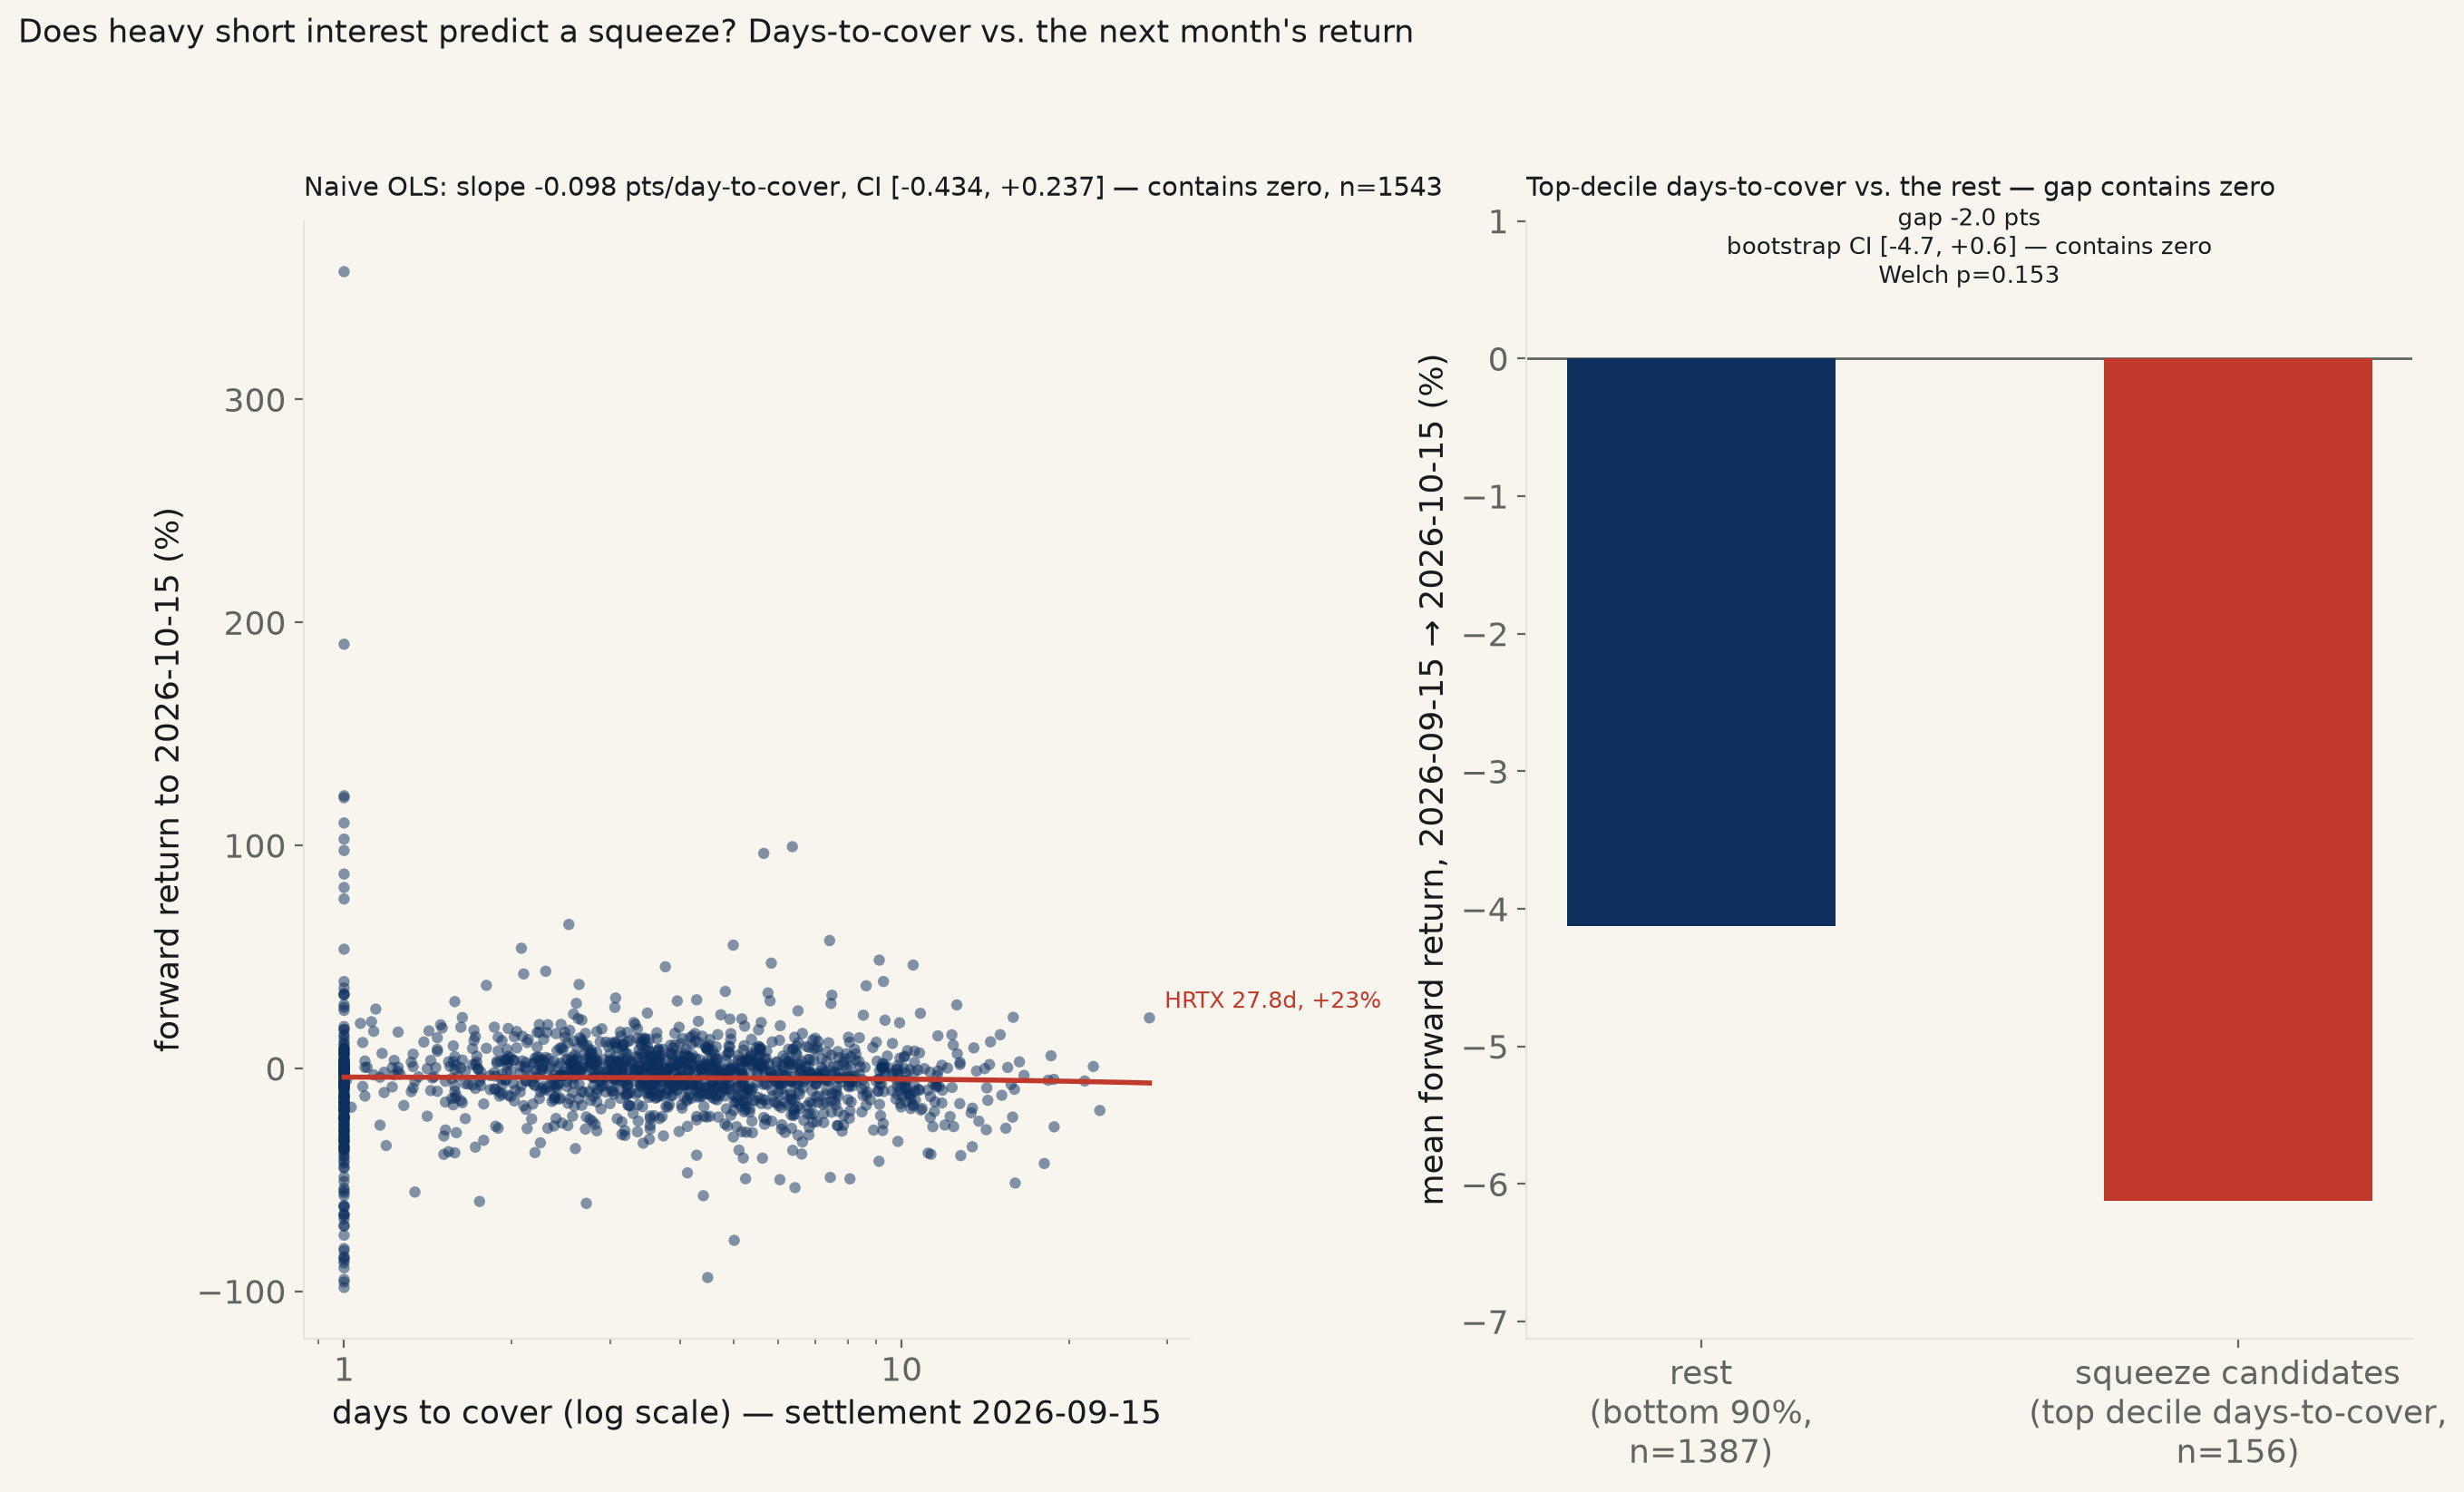
1,543 NYSE/Nasdaq stocks, FINRA's own consolidated short-interest feed, settlement 2026-09-15, days-to-cover vs. forward return to the next settlement, 2026-10-15. Naive OLS: -0.098 points of return per day of days-to-cover (95% CI [-0.434, +0.237]) — contains zero. The top decile of days-to-cover underperformed the rest of the sample over the month — the wrong direction for a squeeze — though that gap's own interval contains zero too.
Backlog idea #25 ("Meme-stock gravity — do short squeezes revert? Short interest vs forward return — [RTM]"), previously untouched. The idea's own cited source, yfinance, carries no historical short-interest series, so this run substitutes FINRA's own consolidated short-interest feed (Rule 4560), a keyless POST API that already computes the classic squeeze-risk metric directly: days-to-cover, a stock's current short position divided by its average daily volume — how many days of ordinary trading it would take short sellers to buy back their position. Event date is the 2026-09-15 settlement cycle; the forward window runs to the next settlement, 2026-10-15, about a month later, both already elapsed as of this run. Universe: 1,543 NYSE/Nasdaq-listed common stocks (NYSE, Nasdaq National Market, Nasdaq SmallCap, NYSE American), average daily volume ≥1.5M shares/day — a liquidity floor stated as a limitation below — with FINRA's own days-to-cover placeholder for near-zero-volume names (999.99) excluded.
Every spec's interval contains zero, and the point estimate runs the wrong direction for a squeeze. Naive OLS: -0.098 points of forward return per day of days-to-cover, 95% CI [-0.434, +0.237] — contains zero, R²=0.0002, p=0.57. HC3-robust SEs agree. A log1p(days-to-cover) version, which should fit better given how right-skewed the predictor is (3.65 days median vs 27.84 days max), still contains zero, CI [-2.194, +3.006]. Spearman rank agrees: ρ=-0.011, p=0.68 — essentially no monotonic relationship either. A 4,000-draw bootstrap on the naive slope puts 68.7% of resampled slopes on the negative side, not a clean majority either way.
The plainer version of the claim does not fare better. Split at the 90th percentile of days-to-cover (8.64 days) into 156 "squeeze candidates" against the remaining 1387: the squeeze candidates returned a mean -6.12% over the month, against -4.13% for the rest — underperforming, the opposite of a squeeze, not confirming one.
| Group | n | Mean forward return |
|---|---|---|
| Rest (bottom 90% days-to-cover) | 1,387 | -4.13% |
| Squeeze candidates (top decile) | 156 | -6.12% |
Gap: -2.00 pts, bootstrap 95% CI [-4.73, +0.62] — contains zero, Welch p=0.153.
The gap's own bootstrap CI still contains zero and the Welch t-test agrees (p=0.153): this sample cannot distinguish "squeeze candidates lag" from noise, but it certainly cannot confirm they lead. Worth noting in passing: the sample's single biggest winner and most of its biggest losers over the month (see the data file) sat at FINRA's own days-to-cover floor of 1.00, nowhere near the squeeze-candidate tail — the extreme moves in this window were not concentrated in the heavily-shorted names at all.Robustness. Dropping the 5, 10, and 20 most extreme days-to-cover names and refitting leaves the same null every time (see the data file for the full table); restricting to the most liquid third of the sample (ADV≥3M shares/day, n=863) returns essentially the same estimate, -0.103, CI [-0.709, +0.502]. One piece of context, not a defect: the whole sample's mean forward return over this particular month was -4.3% (median -3.3%) — a broadly weak month for this universe, which is why both bars in the squeeze-decile chart sit below zero rather than one above and one below.
Read plainly: in this liquid-stock, one-month, one-settlement-cycle design, days-to-cover carries no measurable forward-return signal in either direction. The highest-short-interest names did not get squeezed upward, and if anything leaned slightly the other way — but not by enough to call it a finding. This matches the older academic literature's general shape (elevated short interest has historically tracked flat-to-negative subsequent returns, not a reliable squeeze), more than it matches the meme-stock-era folk claim, though this one month, one metric, one liquidity band cannot settle either account on its own.
| Spec | n (stocks) | pts forward return / day-to-cover | 95% CI | R² | Verdict |
|---|---|---|---|---|---|
| Naive OLS | 1,543 | -0.098 | [-0.434, +0.237] | 0.0002 | contains zero, p=0.57 |
| HC3-robust SE | 1,543 | -0.098 | [-0.460, +0.264] | 0.0002 | contains zero, p=0.59 |
| log1p(days-to-cover), HC3 | 1,543 | +0.406 | [-2.194, +3.006] | 0.0001 | contains zero, p=0.76 |
| Liquidity-restricted, ADV≥3M, HC3 | 863 | -0.103 | [-0.709, +0.502] | 0.0002 | contains zero, p=0.74 |
| Ticker | Issue | Days to cover | Forward return |
|---|---|---|---|
| HRTX | Heron Therapeutics, Inc. Commo | 27.8 | +22.6% |
| CCCC | C4 Therapeutics, Inc. Common S | 22.7 | -19.0% |
| CNQ | Canadian Natural Resources Lim | 22.1 | +0.8% |
| DDD | 3D Systems Corporation | 21.3 | -5.7% |
| TSHA | Taysha Gene Therapies, Inc. Co | 18.8 | -26.3% |
| TNGX | Tango Therapeutics, Inc. | 18.8 | -5.0% |
| TGTX | TG Therapeutics, Inc. Common S | 18.5 | +5.6% |
| DEI | Douglas Emmett, Inc. | 18.3 | -5.4% |
| PCT | PureCycle Technologies, Inc. C | 18.0 | -42.7% |
| OPTU | Optimum Communications, Inc. | 16.6 | -3.2% |
| PGEN | Precigen, Inc. Common Stock | 16.3 | +2.9% |
| CMPX | Compass Therapeutics, Inc. Com | 16.0 | -51.5% |
| IAUX | i-80 Gold Corp. | 15.9 | -9.5% |
| IBRX | ImmunityBio, Inc. Common Stock | 15.9 | +22.9% |
| XRX | Xerox Holdings Corporation Com | 15.8 | -21.9% |
Method. FINRA's Data API, group otcMarket, dataset
consolidatedShortInterest — despite the namespace, FINRA's own
metadata confirms this is the Rule 4560 consolidated feed across all FINRA-member-reported
equities, not OTC-only (NYSE- and Nasdaq-tagged rows appear throughout). Paginated the
full 2026-09-15 settlement snapshot (22,595 rows, FINRA's own record-total header),
filtered to NYSE/Nasdaq National Market/Nasdaq SmallCap/NYSE American common stock
(excluding ARCA and Cboe BZX, overwhelmingly ETFs, and OTC, penny-stock noise), average
daily volume ≥1.5M shares/day, and FINRA's own days-to-cover placeholder (999.99,
a near-zero-volume artifact) dropped — 1,555 tickers pass this filter. Forward
prices via Yahoo Finance, matched to the first trading day on or after each settlement
date; 1,543 of those 1,555 returned a usable price pair on both dates (12
dropped, mostly tickers Yahoo had no history for in this window; see
fetch_shortsqueeze_583.py and analyze583.py for the full pipeline).
Limits, stated plainly. One event date and one ~1-month forward window, not a panel across many settlement cycles — a single cross-section, not a repeated-measures design. The ADV≥1.5M liquidity floor excludes the thinnest, most illiquid names, which is exactly where the most extreme real-world squeeze stories (GameStop, AMC in January 2021) tend to concentrate; this run cannot speak to that tail. Days-to-cover, not short interest as a percentage of float, is the metric tested — the two correlate highly in practice but are not identical, and FINRA's feed does not carry shares-outstanding to compute the latter directly. No sector or market-beta control: the squeeze-candidate group's modest underperformance could partly reflect its own sector composition (biotech and small-cap growth names are overrepresented in the top-decile sample) rather than short interest itself, and this run does not separate the two.
short_interest_forward_returns_583.csv (symbol, issue_name, market, days_to_cover, avg_daily_volume, current_short_position, change_percent_prev_cycle, price_sep15, price_oct15, forward_return) · fit output (JSON).