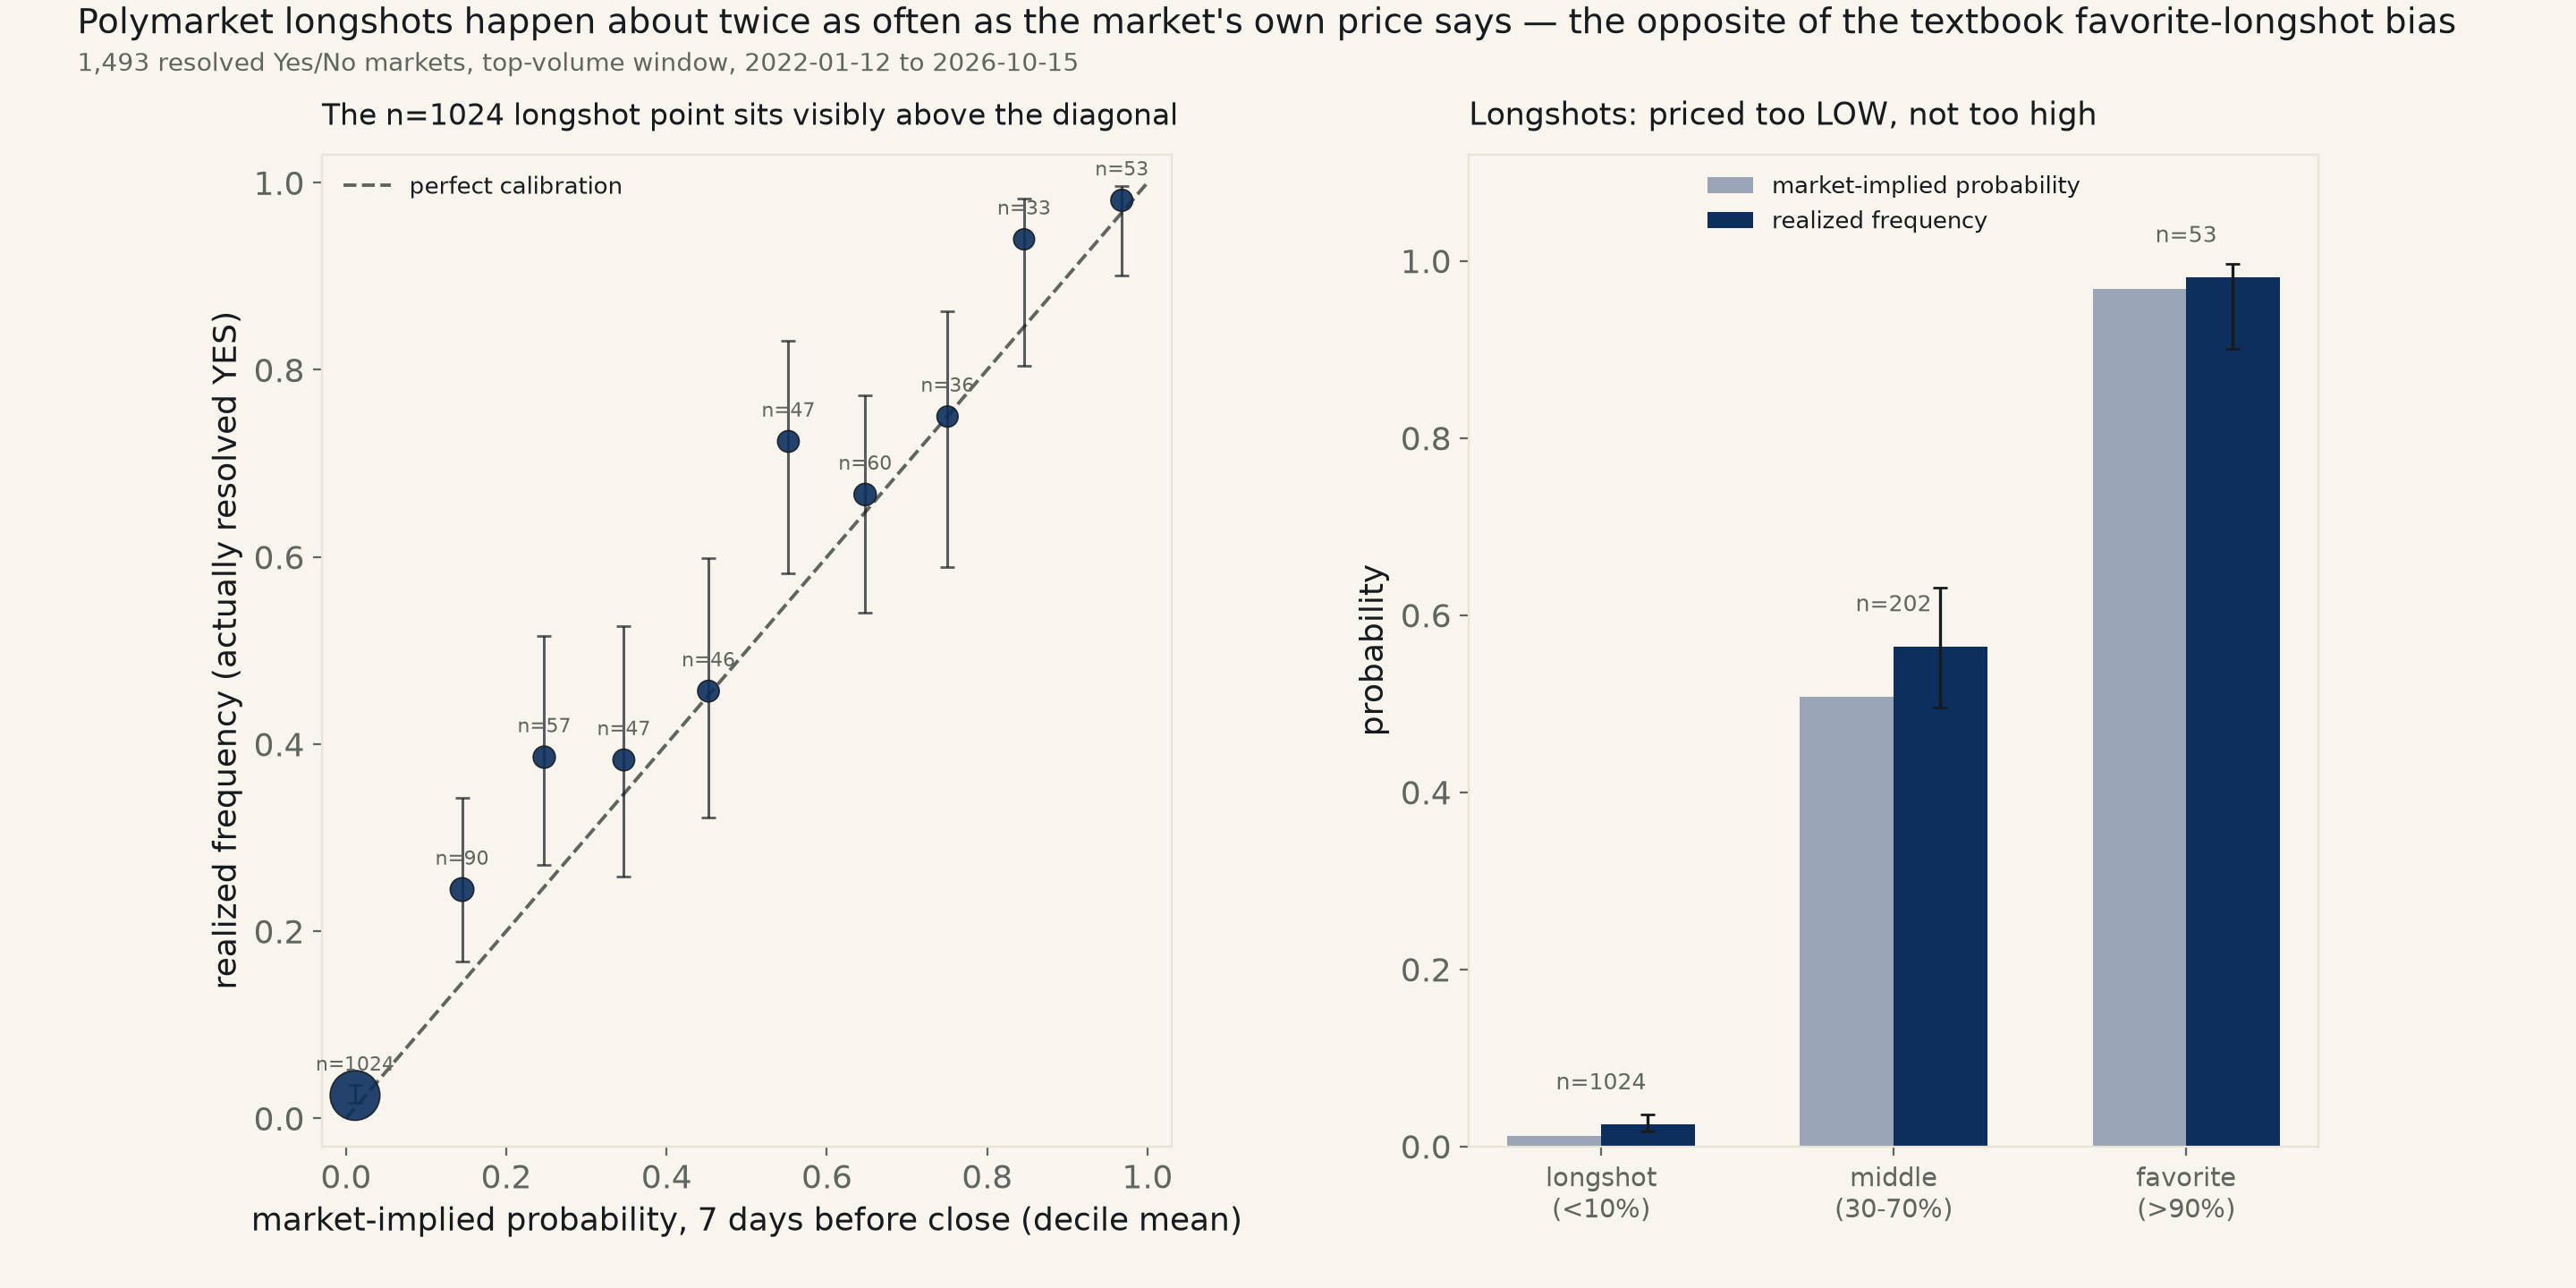
1,493 resolved Polymarket markets, 2022–2026, the platform's top-volume window. Read a week before resolution, market prices track outcomes closely overall — slope 1.054, CI [1.004, 1.104], R²=0.537. But split by price band: the 1,024 markets priced under 10% — most of this sample — resolved YES 2.44% of the time against a priced average of 1.12%, a gap the data excludes as chance — the opposite of the textbook favorite-longshot bias. Favorites and the 30–70% middle band show no equivalent gap.
Backlog item #108, naming two halves: market calibration, and a comparison against poll averages. No keyless, bulk, machine-readable poll-average archive exists that joins to an arbitrary cross-topic market sample in one day — poll averages exist per-race, and most of this sample isn't political — so this run ships the calibration half only, named here as a scope limit, not a silent substitution: read before it resolves, does a market's own price predict how often the event actually happens?
Data. Polymarket's own Gamma and CLOB APIs, both keyless, no account. The platform's volume-sorted market listing caps reachable pagination at 2,100 markets — offset 2,100 itself returns HTTP 422, confirmed live — so this is the 2,100 highest-volume closed markets in the platform's history, not a date-bounded sample. Kept 1,493: exactly two outcomes (Yes/No), cleanly resolved (first-outcome price above 98% or below 2%, excluding voided or ambiguous markets), at least 14 days between open and close (excludes same-day sports and crypto-hourly props, where the "forecast" is really a live scoreboard), and a usable price history. For each, read the market's own implied probability at three fixed horizons before its own recorded close — 7, 14, and 30 days out — never the final price, which converges toward certainty by construction as an event resolves and would make "calibration" circular.
Read a week out, the whole-sample fit is close to the textbook ideal. Regressing realized outcome (0/1) on the market's own 7-day-out price, n=1,493: slope 1.054, 95% CI [1.004, 1.104], R²=0.537 — close to the 1-to-1 line a perfectly calibrated forecaster draws. The market roughly halves the Brier score (lower is better) against a naive always-guess-the-base-rate forecast: 0.074 vs. 0.157. Real forecasting skill, not noise.
Split by price band and the average hides an asymmetry. The 1,024 markets priced under 10% — 69% of this sample, overwhelmingly "will this unlikely thing happen" questions — resolved YES 2.44% of the time, 95% CI [1.66%, 3.58%], against the market's own average price of 1.12%: the interval excludes the market's own number. Longshots on this platform happened roughly twice as often as priced — the opposite of the textbook "favorite-longshot bias" from racetrack and sports-betting research, where bettors are typically found overpaying for longshots, not underpaying.
The other two bands show no equivalent gap. Favorites, priced above 90% (n=53): priced 96.8%, resolved 98.1%, CI [90.1%, 99.7%] — contains the market's own price. The 30–70% middle band (n=202, where genuine uncertainty should live) also contains it: priced 50.7%, resolved 56.4%, CI [49.5%, 63.1%]. Dropping the ten highest-volume markets in the sample — dominated by the 2024 US presidential race, each over $200M in trading volume — barely moves the headline slope, 1.052, CI [1.002, 1.102]: not an artifact of a handful of giant events.
The longshot gap does not hold at every horizon. Read 14 days out, it is still there: n=978, priced 1.21%, realized 2.25%, CI [1.49%, 3.38%] — still excludes the price. Read 30 days out, it is gone: n=883, priced 1.37%, realized 1.81%, CI [1.12%, 2.92%] — contains it. Whatever is mispricing this platform's longshots operates in the final two weeks before an event resolves, not earlier; the whole-sample slope agrees, excluding 1 only at the 7-day horizon (CI [1.004, 1.104]) and containing it at 14 and 30 days (CI up to 1.099 and 1.106 respectively).
Read plainly: on this platform's biggest markets, over nearly five years, a longshot priced near 1% has actually happened close to 2.4% of the time — a real, sample-excludes-the-price gap, not the overpricing this literature usually documents, and one that is only detectable in the final two weeks before resolution. Favorites and genuine toss-ups show no comparable gap. This is one platform's top-volume slice, not prediction markets in general, and the poll-comparison half of the original question goes unanswered today.
| Spec (slope vs. 1 = perfect calibration) | n | slope | 95% CI | R² | verdict |
|---|---|---|---|---|---|
| 7d before close, all markets | 1,493 | 1.054 | [1.004, 1.104] | 0.537 | excludes 1 |
| 14d before close, all markets | 1,455 | 1.044 | [0.989, 1.099] | 0.488 | contains 1 |
| 30d before close, all markets | 1,314 | 1.044 | [0.982, 1.106] | 0.455 | contains 1 |
| 7d before close, top-10-volume markets dropped | 1,483 | 1.052 | [1.002, 1.102] | 0.534 | excludes 1 |
| Market price band (7d before close) | n | mean priced | realized freq. | realized 95% CI |
|---|---|---|---|---|
| [0.0, 0.1) | 1,024 | 1.12% | 2.44% | [1.66%, 3.58%] |
| [0.1, 0.2) | 90 | 14.47% | 24.44% | [16.73%, 34.25%] |
| [0.2, 0.3) | 57 | 24.73% | 38.60% | [27.06%, 51.57%] |
| [0.3, 0.4) | 47 | 34.66% | 38.30% | [25.79%, 52.57%] |
| [0.4, 0.5) | 46 | 45.22% | 45.65% | [32.15%, 59.82%] |
| [0.5, 0.6) | 47 | 55.19% | 72.34% | [58.24%, 83.06%] |
| [0.6, 0.7) | 60 | 64.77% | 66.67% | [54.06%, 77.27%] |
| [0.7, 0.8) | 36 | 75.05% | 75.00% | [58.93%, 86.25%] |
| [0.8, 0.9) | 33 | 84.60% | 93.94% | [80.39%, 98.32%] |
| [0.9, 1.0) | 53 | 96.80% | 98.11% | [90.06%, 99.67%] |
| Band | n | mean priced | realized freq. | realized 95% CI | verdict |
|---|---|---|---|---|---|
| Longshot <10%, 7d before close | 1,024 | 1.12% | 2.44% | [1.66%, 3.58%] | excludes market price |
| Longshot <10%, 14d before close | 978 | 1.21% | 2.25% | [1.49%, 3.38%] | excludes market price |
| Longshot <10%, 30d before close | 883 | 1.37% | 1.81% | [1.12%, 2.92%] | contains market price |
| Middle 30–70%, 7d before close | 202 | 50.74% | 56.44% | [49.54%, 63.09%] | contains market price |
| Favorite >90%, 7d before close | 53 | 96.80% | 98.11% | [90.06%, 99.67%] | contains market price |
Method. Polymarket Gamma API (closed=true, order=volumeNum
descending), paginated in 100-row pages to the API's own reachable ceiling (offset 2,000;
offset 2,100 itself returns HTTP 422), 2,100 markets scanned, 1,493
kept per the filters above. CLOB prices-history endpoint
(interval=max, fidelity=1440 — daily bars) pulled once per
market for its first ("Yes") token; the implied probability at each horizon is the last
available daily bar at or before close-time minus 7/14/30 days, not an interpolation. A
market whose own history does not reach a given horizon is marked missing for that horizon
only, not dropped from the row — each horizon's table reports its own n
(1,493 / 1,455 / 1,314 at 7/14/30 days),
not a silently shared one. Deciles are equal-width bins of the 7-day-out price, Wilson 95%
CIs on realized frequency. A linear probability model (OLS), not logistic, keeps
slope/intercept/CI in the same units as every other run on this desk; an HC3-robust refit
agrees at every reported horizon (robust p below 1e-150 throughout).
Limits, stated plainly. This is Polymarket's own top ~1,500 markets by dollar volume, not a representative sample of prediction markets or even of Polymarket itself — lower-volume, thinner markets, where mispricing plausibly runs larger, sit outside the API's reachable pagination window and are untested here. "Resolved cleanly" (first- outcome price above 98% or below 2%) excludes voided and ambiguous markets by construction, which could cut either direction. No PredictIt data and no poll-average comparison, despite both being named in the original backlog line: PredictIt's own public API lists only currently-open markets, not a historical/resolved archive, and no keyless bulk poll-average source joins cleanly to an arbitrary cross-topic sample in one day. The 7/14/30-day read is the last daily bar at or before the cutoff, not an exact-minute snapshot, which can lag the true cutoff by up to 24 hours on a thin-history market. Middle and favorite bands carry far fewer markets (n=202 and 53) than the longshot band (n=1,024), so their own null results are weaker evidence of "no gap" than the longshot band's result is evidence of a real one.
polymarket_calibration_581.csv (market_id, question, start_date, close_date, duration_days, volume, resolved_yes, prob_7d_before, prob_14d_before, prob_30d_before) · fit output (JSON).