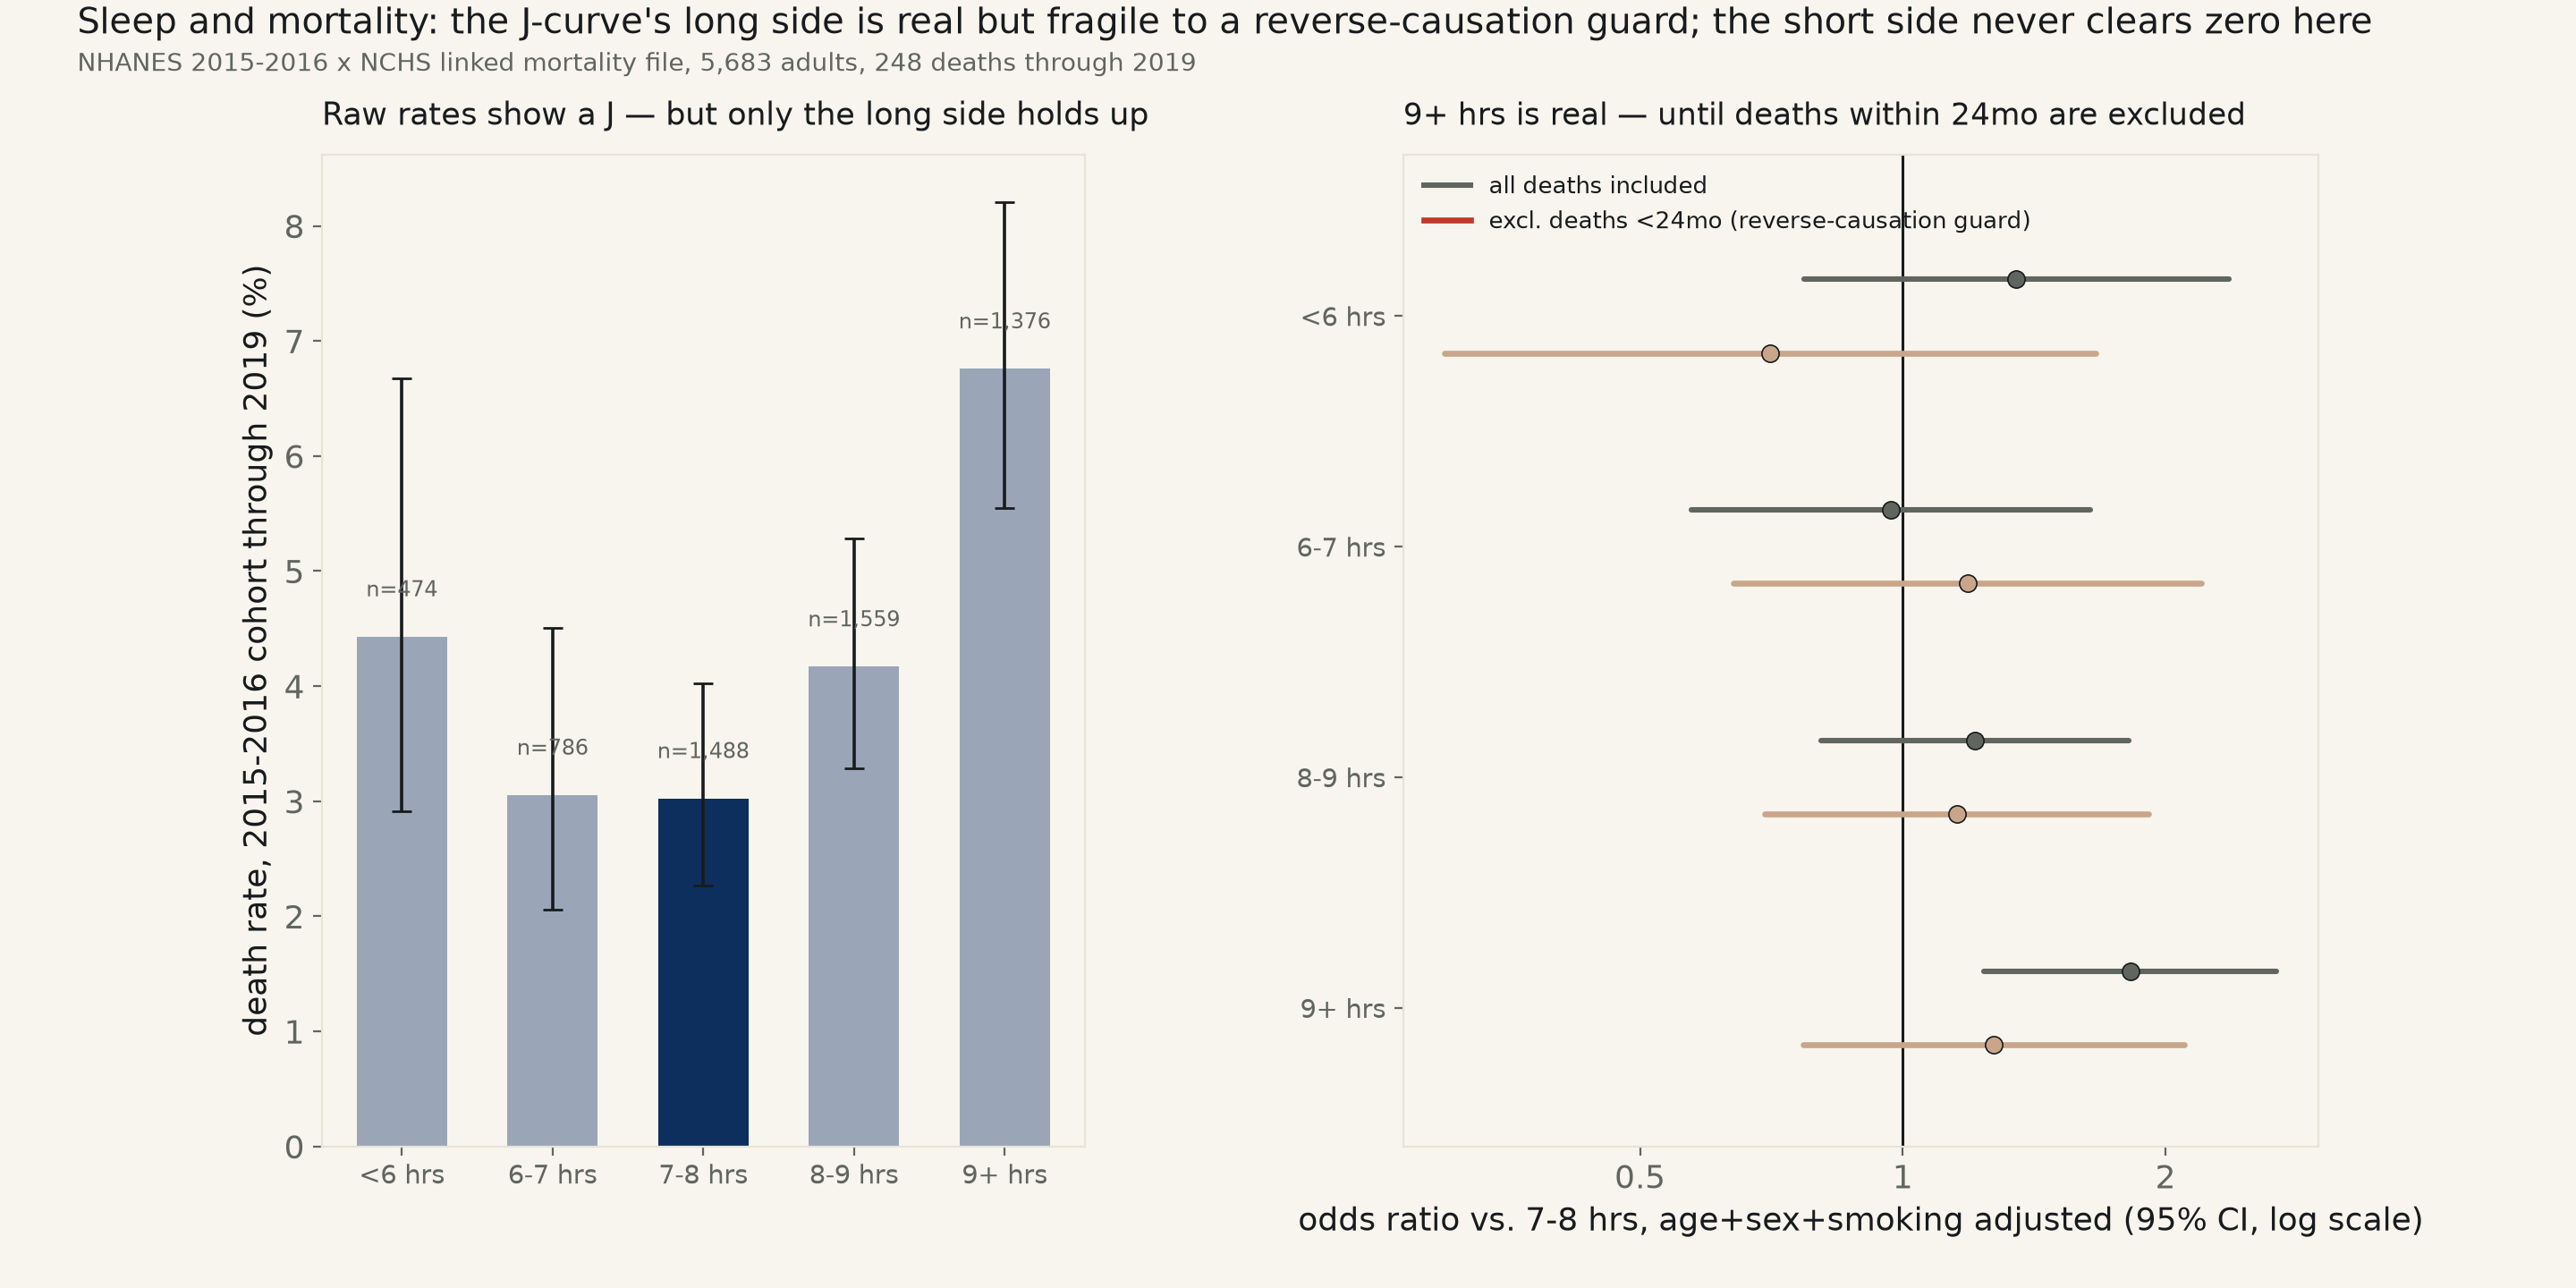
5,683 NHANES adults, 248 deaths through 2019. A J-shaped curve between sleep hours and mortality is real: the curvature term's 95% CI excludes zero at every adjustment level, vertex at 4.8–7.6 hours. But split the J in two and only the long side holds up — sleeping 9+ hours carries an odds ratio of 1.82 vs. 7-8 hours (CI [1.24, 2.68]), excluding 1 at every level, while sleeping under 6 hours never clears 1 here. Excluding deaths within 24 months of the exam — a reverse-causation guard — flattens the 9+ hour OR to 1.27, CI [0.77, 2.10] — contains 1.
Backlog item #82, tagged "[J-curve, non-linear]": the sleep-mortality literature's own standard claim (Cappuccio et al. 2010's meta-analysis of 1.3 million people across 16 cohorts) is not that less sleep is simply worse — it is a J- or U-shape, with both short and long sleepers running higher mortality than people in the middle. Data: the same NHANES 2015-2016 cycle and NCHS Linked Mortality File (follow-up through December 31, 2019) run 577 used for BMI, re-joined here on each respondent's own sleep-duration response (SLD012, hours of sleep on a typical weekday/workday) instead. 5,683 adults with a usable sleep-hours response, smoking-history response, and known mortality status: 248 deaths, mean follow-up 3.9 years (range 0 to 5.1), mean reported sleep 7.7 hours.
The raw numbers trace a J, and this time a real curve survives it. Death rate by sleep band: <6 hrs 4.43%, 6-7 hrs 3.05%, 7-8 hrs 3.02%, 8-9 hrs 4.17%, 9+ hrs 6.76% — both tails run above the 7-8-hour reference, the shape the claim predicts. A quadratic term on sleep hours confirms real curvature, not noise: the coefficient's 95% CI excludes zero unadjusted (+0.0327 to +0.0763, p=9.75e-07) and stays excluded fully adjusted (+0.0269 to +0.0749, p=3.23e-05). A 1,500-draw bootstrap on the adjusted curve's own vertex — the sleep duration with the lowest fitted mortality odds — lands at a median of 6.8 hours, 95% CI [4.8, 7.6], every one of 1500 of 1500 resamples producing an interior minimum. That interval sits at or below the commonly cited "7-8 hours is optimal" range, not inside it — imprecise, but not centered where the folk claim expects.
Split the J in two and only one side is real. Age and sex adjustment alone jumps the categorical model's pseudo-R² from 0.013 to 0.230 (age doing real work, as in run 577), and in that fully age+sex+smoking-adjusted model, sleeping 9+ hours carries an odds ratio of 1.82 vs. 7-8 hours, 95% CI [1.24, 2.68] — excludes 1, p=0.002, and stays excluded at every adjustment level from unadjusted (2.32) on up. Sleeping under 6 hours, the claim's other named tail, never clears 1 in this sample at any adjustment level: fully adjusted OR 1.35, CI [0.77, 2.36] — contains 1. The under-6-hours group is also this sample's smallest (n=474, only 21 deaths), so a null here is consistent with either "no effect" or "too small a group to see one" — this run cannot distinguish the two, and does not claim to.
The long-sleep signal is substantially a reverse-causation artifact. 114 of 248 deaths (46%) occurred within 24 months of the respondent's own exam — the same reverse-causation flag run 577 used for BMI (illness already present at the exam can both lengthen reported sleep and cause a near-term death). Dropping those 114 deaths outright (not recoding them as survivors) and refitting the age+sex+smoking-adjusted categorical model: the 9+ hours odds ratio falls from 1.82 to 1.27, 95% CI [0.77, 2.10] — now contains 1, p=0.351. Most, though not all, of the long-sleep/mortality association in this sample tracks people who were already dying when they reported sleeping more, not sleep duration itself driving the risk.
Read plainly: the J-curve this literature predicts is real as a shape — the quadratic term is not noise, in either adjustment. But the two halves of that J are not equally trustworthy. The long-sleep side clears zero cleanly until a standard reverse-causation guard is applied, at which point it, too, contains 1. The short-sleep side never clears zero in this sample at all, at any adjustment, though this run's power to rule it out is weak. Neither tail survives this run's full scrutiny as a clean, standalone finding — which is a different, more honest statement than either "sleep more" or "the paradox is debunked."
| Sleep duration | n | deaths | raw death rate | mean age | current smokers |
|---|---|---|---|---|---|
| <6 hrs | 474 | 21 | 4.43% | 48.1 | 28.3% |
| 6-7 hrs | 786 | 24 | 3.05% | 48.3 | 21.8% |
| 7-8 hrs | 1,488 | 45 | 3.02% | 47.5 | 16.4% |
| 8-9 hrs | 1,559 | 65 | 4.17% | 48.3 | 14.8% |
| 9+ hrs | 1,376 | 93 | 6.76% | 48.0 | 19.0% |
| vs. 7-8 hrs (ref=1.00) | unadjusted | +age+sex | +age+sex+smoking | +age+sex+smoking, excl. deaths <24mo |
|---|---|---|---|---|
| <6 hrs | 1.49 [0.88,2.52] p=0.142 | 1.46 [0.84,2.54] p=0.182 | 1.35 [0.77,2.36] p=0.293 | 0.70 [0.30,1.66] p=0.424 |
| 6-7 hrs | 1.01 [0.61,1.67] p=0.969 | 1.02 [0.60,1.72] p=0.952 | 0.97 [0.57,1.64] p=0.904 | 1.19 [0.64,2.20] p=0.589 |
| 8-9 hrs | 1.40 [0.95,2.05] p=0.092 | 1.21 [0.81,1.82] p=0.346 | 1.21 [0.81,1.82] p=0.358 | 1.15 [0.70,1.91] p=0.581 |
| 9+ hrs | 2.32 [1.62,3.34] p=0.000 | 1.83 [1.24,2.69] p=0.002 | 1.82 [1.24,2.68] p=0.002 | 1.27 [0.77,2.10] p=0.351 |
| Spec | n | Coefficient | 95% CI | pseudo-R² | Verdict |
|---|---|---|---|---|---|
| Linear, unadjusted (OR/hour) | 5,683 | 1.214 | [1.121, 1.314] | 0.011 | excludes null, p=0.0000 |
| Linear, +age+sex+smoking (OR/hour) | 5,683 | 1.144 | [1.053, 1.244] | 0.234 | excludes null, p=0.0015 |
| Quadratic, unadjusted (hours² coef.) | 5,683 | +0.0545 | [+0.0327, +0.0763] | 0.021 | excludes null, p=0.0000 |
| Quadratic, +age+sex+smoking (hours² coef.) | 5,683 | +0.0509 | [+0.0269, +0.0749] | 0.242 | excludes null, p=0.0000 |
Method. NHANES 2015-2016 cycle ("I"): Demographics (DEMO_I), Sleep Disorders (SLQ_I), and Smoking - Cigarette Use (SMQ_I) public-use files, joined on SEQN, further joined to NCHS's own public-use Linked Mortality File (follow-up through December 31, 2019), the same fixed-width ASCII file and column spec run 577 used. ELIGSTAT==1 (eligible for mortality follow-up, 18+ at interview by NCHS's own construction), a non-missing sleep-hours response (SLD012, "sleep hours - weekdays or workdays," this cycle's standard self-report item, in 0.5-hour increments), a non-missing smoking response, and a non-missing mortality status. Sleep bands follow this literature's own convention (Cappuccio et al. 2010): under 6, 6-7, 7-8 (reference), 8-9, 9+ hours. Current smoker = ever smoked ≥100 cigarettes (SMQ020) AND currently smokes every day or some days (SMQ040), identical definition to run 577. All models are logistic regressions (mortality status as a binary outcome), not a time-to-event (Cox) model — the quadratic vertex bootstrap and the early-death exclusion spec both use PERMTH_EXM directly as a continuous follow-up time, but the categorical and linear/quadratic mortality specs otherwise treat it as a fixed ~3.9-year window, the same simplification run 577 stated.
Limits, stated plainly. Sleep duration here is self-reported on a single interview question, not actigraphy or a sleep diary — this is the standard instrument this literature's own meta-analyses pool across cohorts, not a substitution, but it carries recall and social-desirability bias this run cannot correct for. A single 2-year NHANES cycle with 248 total deaths split across five sleep bands is underpowered for the subtle effect sizes a 1.3-million-person meta-analysis (Cappuccio et al. 2010) was built to detect, most acutely in the under-6-hours band, this sample's smallest at n=474; a null there is consistent with either "no effect" or "an effect too small for this sample to see," and this run cannot tell the two apart. The 24-month early-death exclusion threshold is the conventional choice in this literature, not a value tested at multiple cutoffs here. SLD012 asks about a typical weekday/workday only, not weekend sleep or a full week's average, and current-smoking status remains the same coarse point-in-time flag run 577 used, pooling former smokers with true never-smokers.
sleep_mortality_580.csv (seqn, sex, age_years, sleep_hours, sleep_cat, current_smoker, mortstat, followup_months) · fit output (JSON).