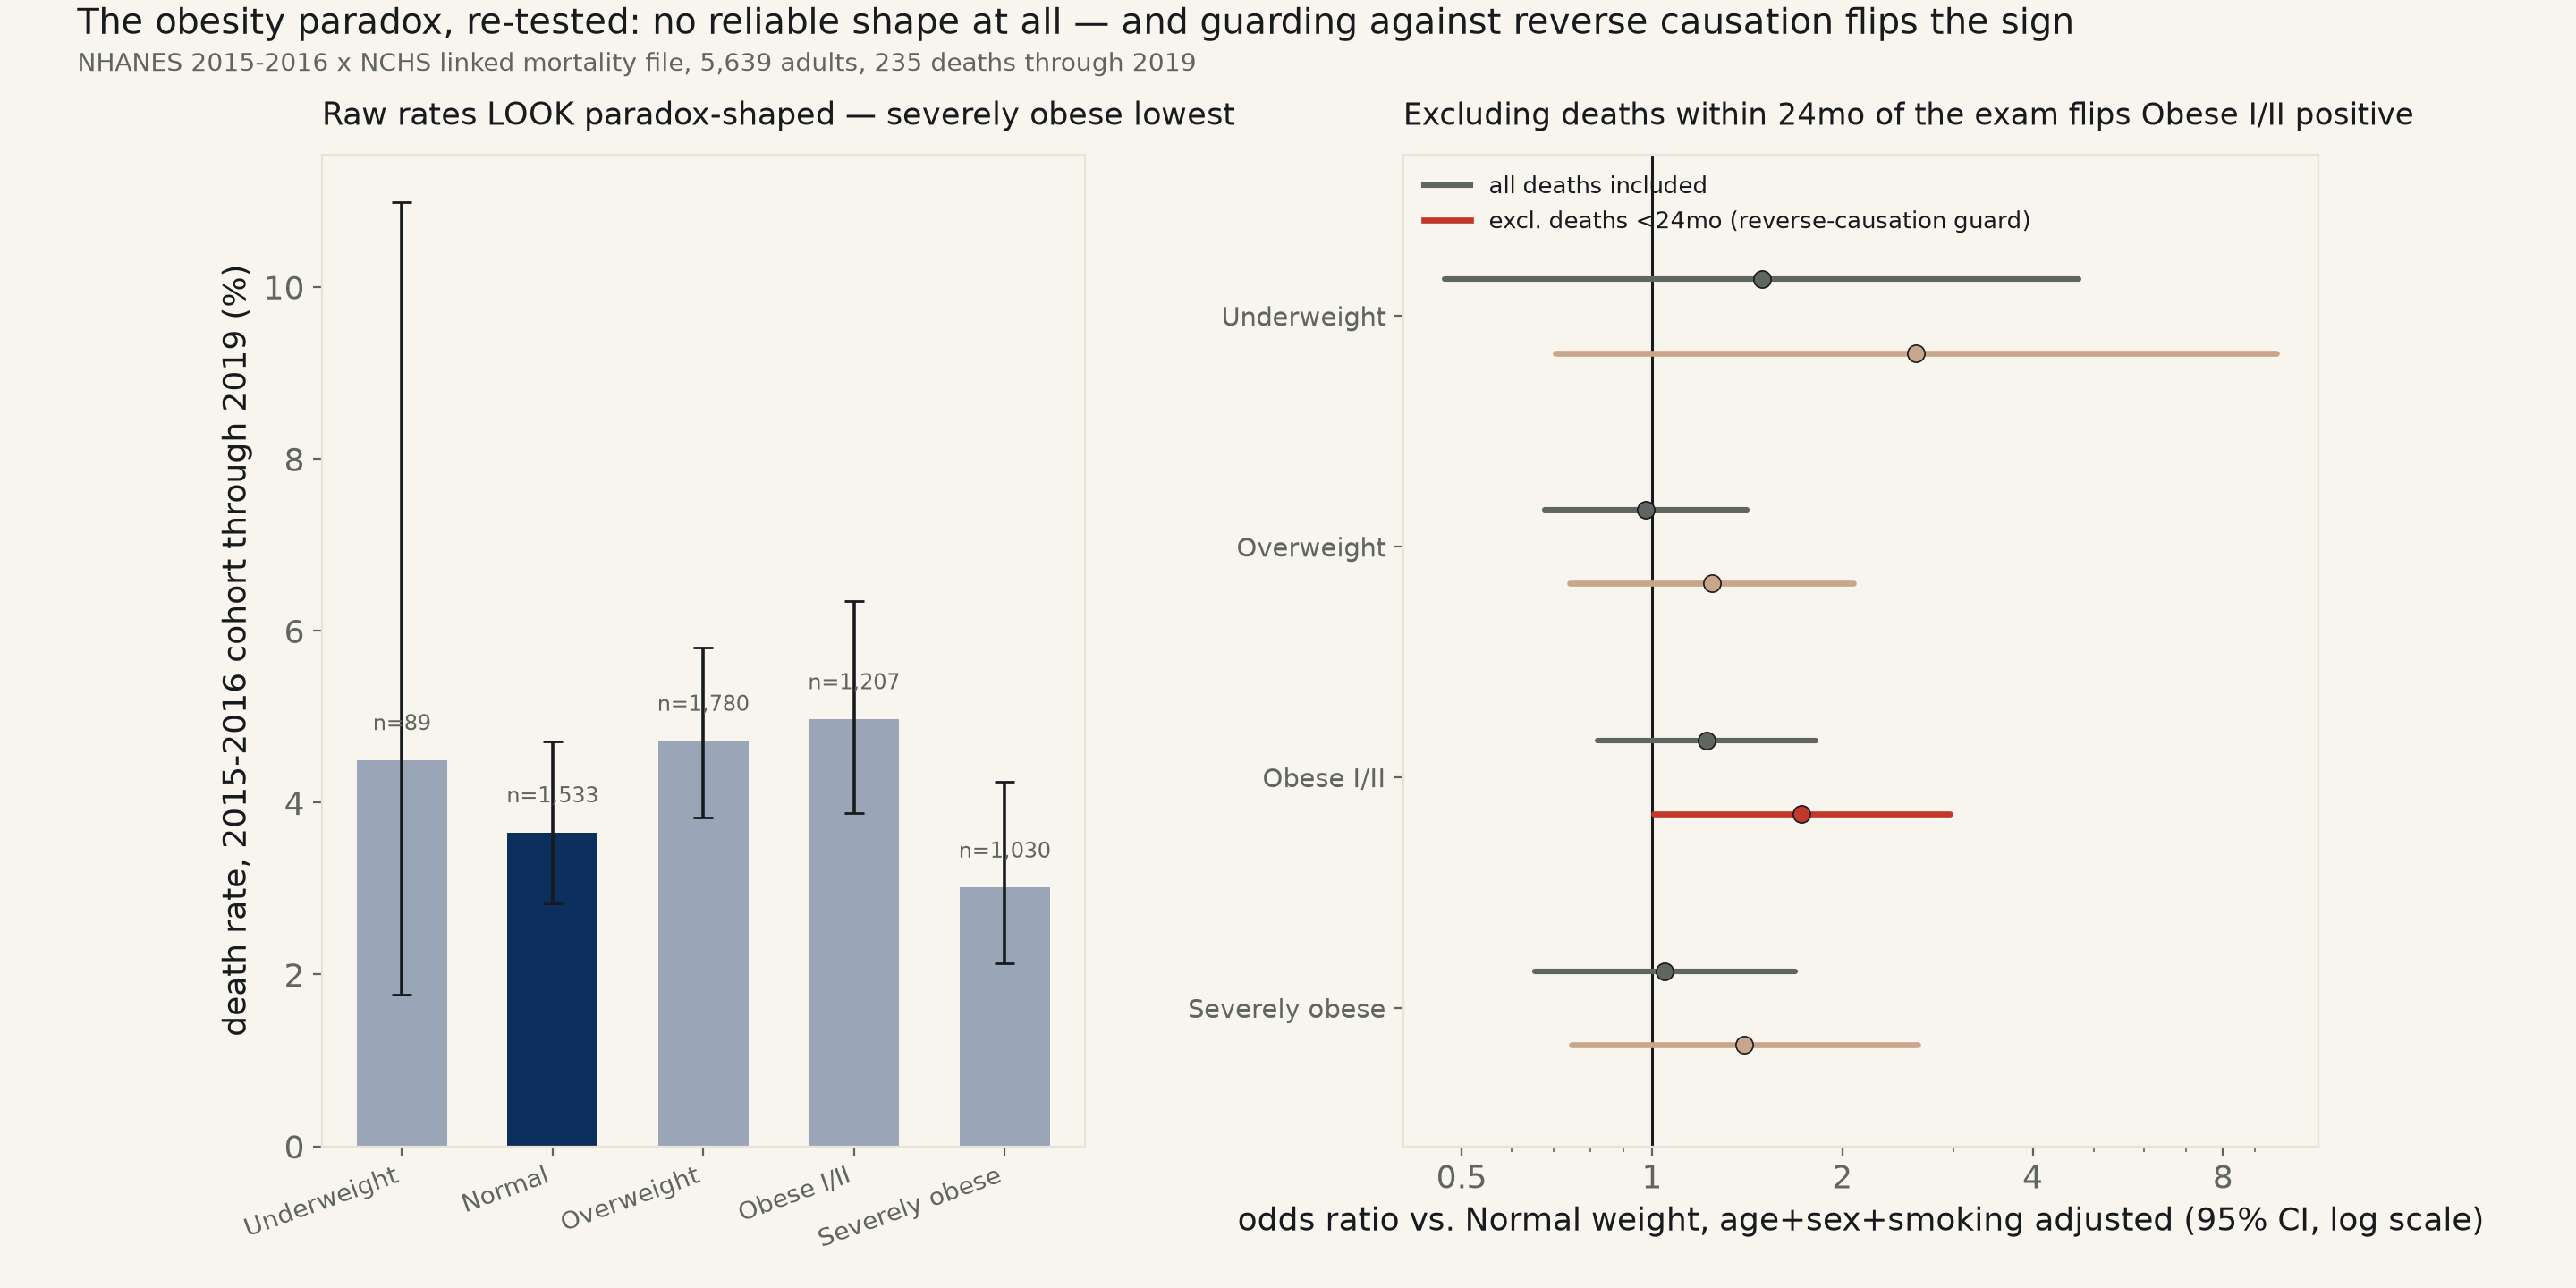
5,639 NHANES adults, 235 deaths through 2019. Odds ratio per 5 BMI units: 0.96 unadjusted, 1.05 fully adjusted — both CIs contain 1. The quadratic (U-shape) term's CI contains zero in both directions tried. Excluding deaths within 24 months of the exam — a reverse-causation guard — moves Obese I/II to OR 1.73 (CI [1.01, 2.96]) — excludes 1, the harm direction, not the protective one the paradox claims.
Backlog item #76, tagged "[OUTLIER/non-linear]": is the relationship between BMI and mortality a straight line, or the U-shape the "obesity paradox" literature claims — overweight and even moderately obese people showing equal or lower mortality odds than people at a "normal" weight? Data: NHANES's 2015-2016 cycle (the most recent standard 2-year cycle with a published NCHS linked mortality file; the newer 2017-March 2020 combined pre-pandemic file used by run 576 does not yet have one), joined on each respondent's own NHANES ID to NCHS's own public-use Linked Mortality File, follow-up through December 31, 2019. 5,639 adults with an examination-measured BMI, a usable smoking-history response, and a known mortality status: 235 deaths, mean follow-up 3.9 years (range 0 to 5.1).
The raw numbers do trace the paradox's shape. Death rate by WHO BMI band: Underweight 4.49%, Normal 3.65%, Overweight 4.72%, Obese I/II 4.97%, Severely obese 3.01% — severely obese adults post this sample's lowest raw death rate, below Normal weight. None of it survives a confidence interval. Every odds ratio vs. Normal weight, at every adjustment level tried — unadjusted, age+sex adjusted, age+sex+current-smoking adjusted — has a 95% CI straddling 1 (full table below). Age and sex adjustment alone jumps the model's pseudo-R² from 0.004 to 0.222: age is doing real work, BMI category is not.
The continuous and quadratic specs agree: no reliable shape at all. A straight line through BMI and mortality gives an odds ratio per 5 BMI units of 0.964 unadjusted (95% CI [0.877, 1.059]) and 1.048 fully adjusted (CI [0.935, 1.174]) — the point estimate does not even keep the same side of 1 between the two specs, let alone clear it. Adding a BMI² term to test the U-shape directly fares no better: the quadratic coefficient's CI contains zero unadjusted (-0.00337 to +0.00062, p=0.18) and contains zero adjusted (-0.00109 to +0.00246, p=0.45) — and the curvature even flips sign (concave unadjusted, convex adjusted) between the two. A 1,500-draw bootstrap on the adjusted quadratic curve's own vertex (the BMI with the lowest fitted mortality odds, the number a real U-shape claim would need to name) makes the point starkest: only 1126 of 1500 resamples even produced a curve with an interior minimum at all (374 came out concave, curving the wrong way to have one), and among the resamples that did, the 95% CI on the vertex spans BMI -41 to 44 — a range that includes impossible negative BMIs and is, in plain terms, uninformative. This sample cannot locate the U-shape's own bottom.
What does move is the opposite of a paradox. 107 of 235 deaths (46%) occurred within 24 months of the respondent's own exam — a textbook reverse-causation flag in this exact literature (illness already present at the exam, driving both an unusual BMI reading and a near-term death, the "sick quitter" pattern named for smoking but not limited to it). Dropping those 107 deaths outright (not recoding them as survivors) and refitting the age+sex+smoking-adjusted categorical model: Obese I/II's odds ratio moves to 1.73, 95% CI [1.01, 2.96], p=0.047 — barely excludes 1, in the harm direction, the opposite of what a protective paradox predicts. Overweight and Severely obese stay null even under this guard (full table below) — so this is not a clean reversal across the board, only a single category crossing the line, and barely.
Read plainly: this run cannot confirm the obesity paradox. It cannot confirm a straight line either, or locate a U-shape's bottom. The one specification that moves a BMI category cleanly away from the null does so by removing the deaths most likely to be artifacts of reverse causation — and it moves toward obesity being modestly harmful, not protective, for the one BMI band (30-34.9) where this sample has the statistical power to say anything at all.
| BMI category | n | deaths | raw death rate |
|---|---|---|---|
| Underweight (<18.5) | 89 | 4 | 4.49% |
| Normal (18.5-24.9) | 1,533 | 56 | 3.65% |
| Overweight (25-29.9) | 1,780 | 84 | 4.72% |
| Obese I/II (30-34.9) | 1,207 | 60 | 4.97% |
| Severely obese (35+) | 1,030 | 31 | 3.01% |
| vs. Normal (ref=1.00) | unadjusted | +age+sex | +age+sex+smoking | +age+sex+smoking, excl. deaths <24mo |
|---|---|---|---|---|
| Underweight | 1.24 [0.44,3.50] p=0.68 | 1.58 [0.50,5.01] p=0.44 | 1.49 [0.47,4.73] p=0.50 | 2.62 [0.70,9.73] p=0.15 |
| Overweight | 1.31 [0.92,1.84] p=0.13 | 0.94 [0.65,1.35] p=0.73 | 0.98 [0.68,1.41] p=0.90 | 1.24 [0.74,2.08] p=0.41 |
| Obese I/II | 1.38 [0.95,2.00] p=0.09 | 1.14 [0.77,1.70] p=0.50 | 1.22 [0.82,1.82] p=0.32 | 1.73 [1.01,2.96] p=0.05 |
| Severely obese | 0.82 [0.52,1.28] p=0.38 | 0.97 [0.60,1.55] p=0.89 | 1.05 [0.65,1.69] p=0.85 | 1.40 [0.75,2.63] p=0.30 |
| Spec | n | Coefficient | 95% CI | pseudo-R² | Verdict |
|---|---|---|---|---|---|
| Linear, unadjusted (OR/5 BMI) | 5,639 | 0.964 | [0.877, 1.059] | 0.000 | contains null, p=0.442 |
| Linear, +age+sex+smoking (OR/5 BMI) | 5,639 | 1.048 | [0.935, 1.174] | 0.228 | contains null, p=0.419 |
| Quadratic, unadjusted (BMI² coef.) | 5,639 | -0.00138 | [-0.00337, +0.00062] | 0.001 | contains null, p=0.176 |
| Quadratic, +age+sex+smoking (BMI² coef.) | 5,639 | +0.00069 | [-0.00109, +0.00246] | 0.228 | contains null, p=0.448 |
Method. NHANES 2015-2016 cycle (cycle "I"): Demographics (DEMO_I), Body Measures (BMX_I), and Smoking - Cigarette Use (SMQ_I) public-use files, joined on SEQN, further joined to NCHS's own public-use Linked Mortality File (follow-up through December 31, 2019), a fixed-width ASCII file whose column positions are NCHS's own published spec. ELIGSTAT==1 (eligible for mortality follow-up, which by NCHS's own construction already restricts to respondents aged 18+ at interview) and a non-missing BMI, smoking response, and mortality status. BMI bands follow the standard WHO cut points (Underweight <18.5, Normal 18.5–24.9, Overweight 25–29.9, Obese I/II 30–34.9, Severely obese 35+), Normal as the reference category. Current smoker = ever smoked ≥100 cigarettes (SMQ020) AND currently smokes every day or some days (SMQ040); former and never smokers are both coded 0, a coarse control stated as a limit below. All models are logistic regressions (mortality status as a binary outcome), not a time-to-event (Cox) model — a simplification of NCHS's own PERMTH_EXM field, which the quadratic vertex bootstrap and the early-death exclusion spec both use directly as a continuous follow-up time, but the categorical and linear/quadratic mortality specs otherwise treat as a fixed ~3.9-year window.
Limits, stated plainly. A single 2-year NHANES cycle with 235 total deaths split across five BMI categories is underpowered for the subtle effect sizes this literature typically reports (Flegal et al. 2013's own meta-analysis pooled 2.88 million people across 97 studies to get a stable estimate); a null result here is consistent with either "no effect" or "an effect too small for this sample to see," and this run cannot distinguish the two. BMI itself does not separate fat mass from muscle mass or capture fat distribution (waist circumference, a measure this run did not pull, is the variable much of the "re-examine the paradox" literature now prefers). The 24-month early-death exclusion threshold is the conventional choice in this literature, not a value tested at multiple cutoffs here. Current-smoking status is a coarse single-point-in-time flag; pack-years, time-since-quit, and secondhand exposure are not modeled, and former smokers (whose BMI and mortality risk both often shift after quitting) are pooled with true never-smokers.
obesity_mortality_577.csv (seqn, sex, age_years, bmi, bmi_cat, current_smoker, mortstat, followup_months) · fit output (JSON).