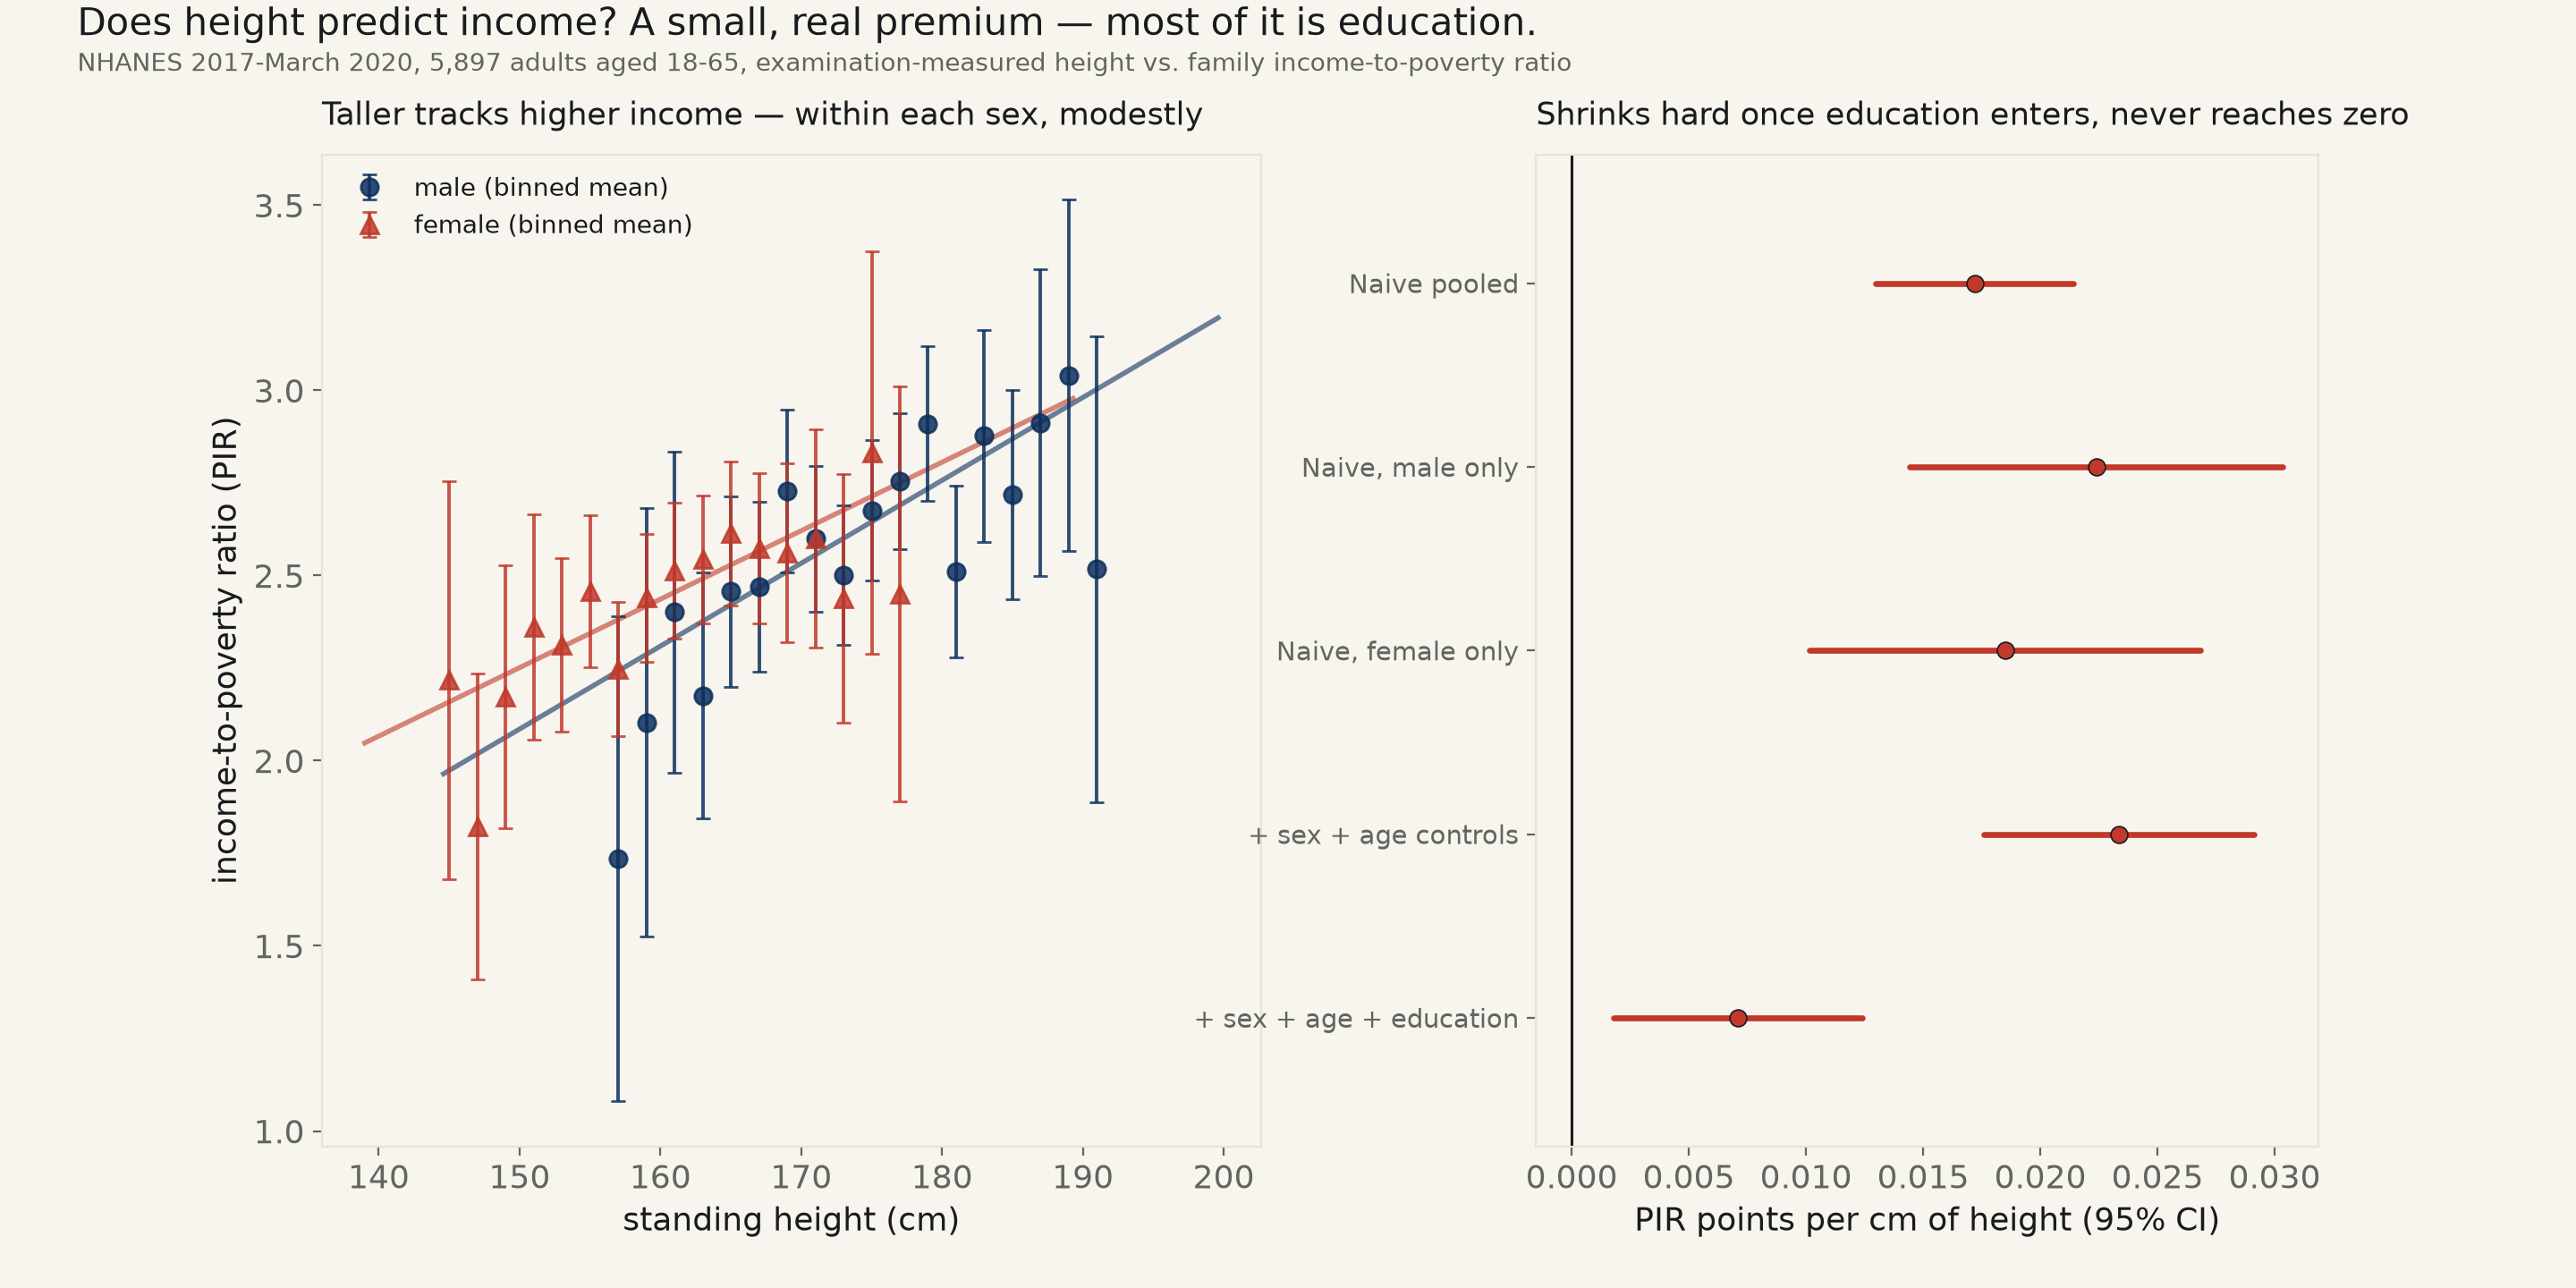
5,897 NHANES adults aged 18-65, examination-measured standing height vs. family income-to-poverty ratio. Naive pooled: +0.172 PIR points per 10cm (95% CI [+0.130, +0.214]) — excludes zero. Holding sex, age, and education all fixed at once shrinks it to +0.071 per 10cm (CI [+0.018, +0.124]) — smaller, but still excludes zero.
Bench idea, tagged "[small real premium]": does height predict income? The literature has a name for this (Judge & Cable, Journal of Applied Psychology 2004, pooling 8,590 people across four studies) and a small positive effect going back decades, but it is a classic case where pooling the sexes together risks measuring the wrong thing — men average taller and average higher income for reasons that have nothing to do with height, so a naive pooled slope can simply be re-detecting the sex gap in earnings. Data: NHANES's 2017-March 2020 pre-pandemic public-use file (the most recent complete cycle; 2021-23 exam data don't yet cover the full age-earnings range needed here), 5,897 adults aged 18-65 with an examination-measured standing height (not self-reported) and a usable income-to-poverty ratio (PIR) — NHANES's own household-size- and survey-year-adjusted income proxy, top-coded at 5.00 for any family at or above 5× the poverty line (1,077 of 5,897 rows, 18.3%, hit that ceiling and are flagged, not dropped).
The sex confound turns out to matter less than expected. Naive pooled OLS: +0.172 PIR points per 10cm of height, 95% CI [+0.130, +0.214] — excludes zero. Fit separately within each sex instead of pooling: male +0.224 (CI [+0.144, +0.303]), female +0.185 (CI [+0.101, +0.268]) — both exclude zero, both close in size to the pooled naive figure, and a Spearman check inside each sex agrees (male ρ=+0.093, p=7.6e-07; female ρ=+0.078, p=1.5e-05). Average height differs by 13.5cm between the two sexes in this sample (174.6cm vs. 161.0cm) and mean PIR by 0.18 points (2.64 vs. 2.45) — a real gap on both axes, but not one that was quietly inflating the within-sex height effect the way the tag's own [CONFOUND]-adjacent framing would predict.
Adding age to the pooled model barely moves the estimate: +0.234 PIR points per 10cm, CI [+0.176, +0.291] (R²=0.025) — still excludes zero, HC3-robust SEs agree to three decimal places. The control that actually does the work is education: adding highest-education-level dummies alongside sex and age shrinks the slope to +0.071 PIR points per 10cm, CI [+0.018, +0.124] — still excludes zero, but at 30% of the age-and-sex-only estimate's size. R² jumps from 0.025 to 0.254 once education enters, which is mostly education and age doing their own well-established work predicting income, not evidence that height's own contribution grew more precise.
Read plainly: a real, nonzero height-income association survives every control this run has data for, including the strictest one (sex, age, and education all held fixed at once). It is small — roughly 0.071 PIR points, against a sample mean PIR of 2.55, for a 10cm (~4 inch) height difference — and a large share of the naive, unconditional gap between short and tall adults in this sample runs through educational attainment, not through sex as this bench idea's tag implied. Whether that running-through is itself causal (taller people face less discrimination in hiring and promotion, the usual mechanism proposed in this literature) or whether height and educational attainment share some earlier common cause (nutrition, childhood health, parental socioeconomic status) is not a question a single cross-sectional NHANES cycle can settle, and this run does not claim to settle it.
| Spec | n (adults) | PIR pts / 10cm | 95% CI | R² | Verdict |
|---|---|---|---|---|---|
| Naive, pooled (sex unmodeled) | 5,897 | +0.172 | [+0.130, +0.214] | 0.011 | excludes zero, p=1.9e-15 |
| Naive, male only | 2,811 | +0.224 | [+0.144, +0.303] | 0.011 | excludes zero, p=3.9e-08 |
| Naive, female only | 3,086 | +0.185 | [+0.101, +0.268] | 0.006 | excludes zero, p=1.4e-05 |
| + sex + age controls | 5,897 | +0.234 | [+0.176, +0.291] | 0.025 | excludes zero, p=2.2e-15 |
| + sex + age + education controls | 5,549 | +0.071 | [+0.018, +0.124] | 0.254 | excludes zero, p=8.9e-03 |
Method. CDC NHANES's keyless public-use microdata, 2017-March 2020
pre-pandemic file (P_DEMO.xpt, P_BMX.xpt), joined on each
respondent's own NHANES sequence number (SEQN). INDFMPIR is NHANES's own computed
ratio of family income to that family's poverty threshold, already adjusted for
family size and survey year — a cleaner income proxy across households of
different sizes than a raw dollar figure would be, at the cost of being capped at
5.00 (flagged in every spec's n, not dropped). BMXHT is standing height in
centimeters, taken by a trained examiner, not self-reported. Restricted to
RIDAGEYR 18-65: below 18, height has not finished growing; above 65, income
increasingly reflects retirement rather than career earnings, a different
measurement problem this run does not attempt to solve. Education (DMDEDUC2, five
levels, adults 20+) drops 348 respondents missing or coded
refused/don't-know in that field from the education-controlled spec only; every
other spec keeps the full 5,897.
Limits, stated plainly. This is one cross-sectional NHANES cycle, not a panel following the same people over time, so reverse causality (income shaping nutrition shaping adult height, operating across a prior generation, not this one) is not ruled out, only implausible given height is fixed by early adulthood while PIR is measured in adulthood. Education is included as a control here because the standard "is this confounded?" workflow calls for holding fixed anything correlated with both the exposure and the outcome, but education plausibly sits on part of the causal path from height to income (taller children may be treated differently by teachers and, later, employers, in ways that shape how far they go in school) rather than purely confounding it — so the education-controlled slope is better read as a conservative floor than as "the" causal estimate. No occupation, industry, parental income, or birth-weight data was pulled; any of those could move the estimate further in either direction.
height_income.csv (seqn, sex, age_years, education, pir, height_cm) · fit output (JSON).