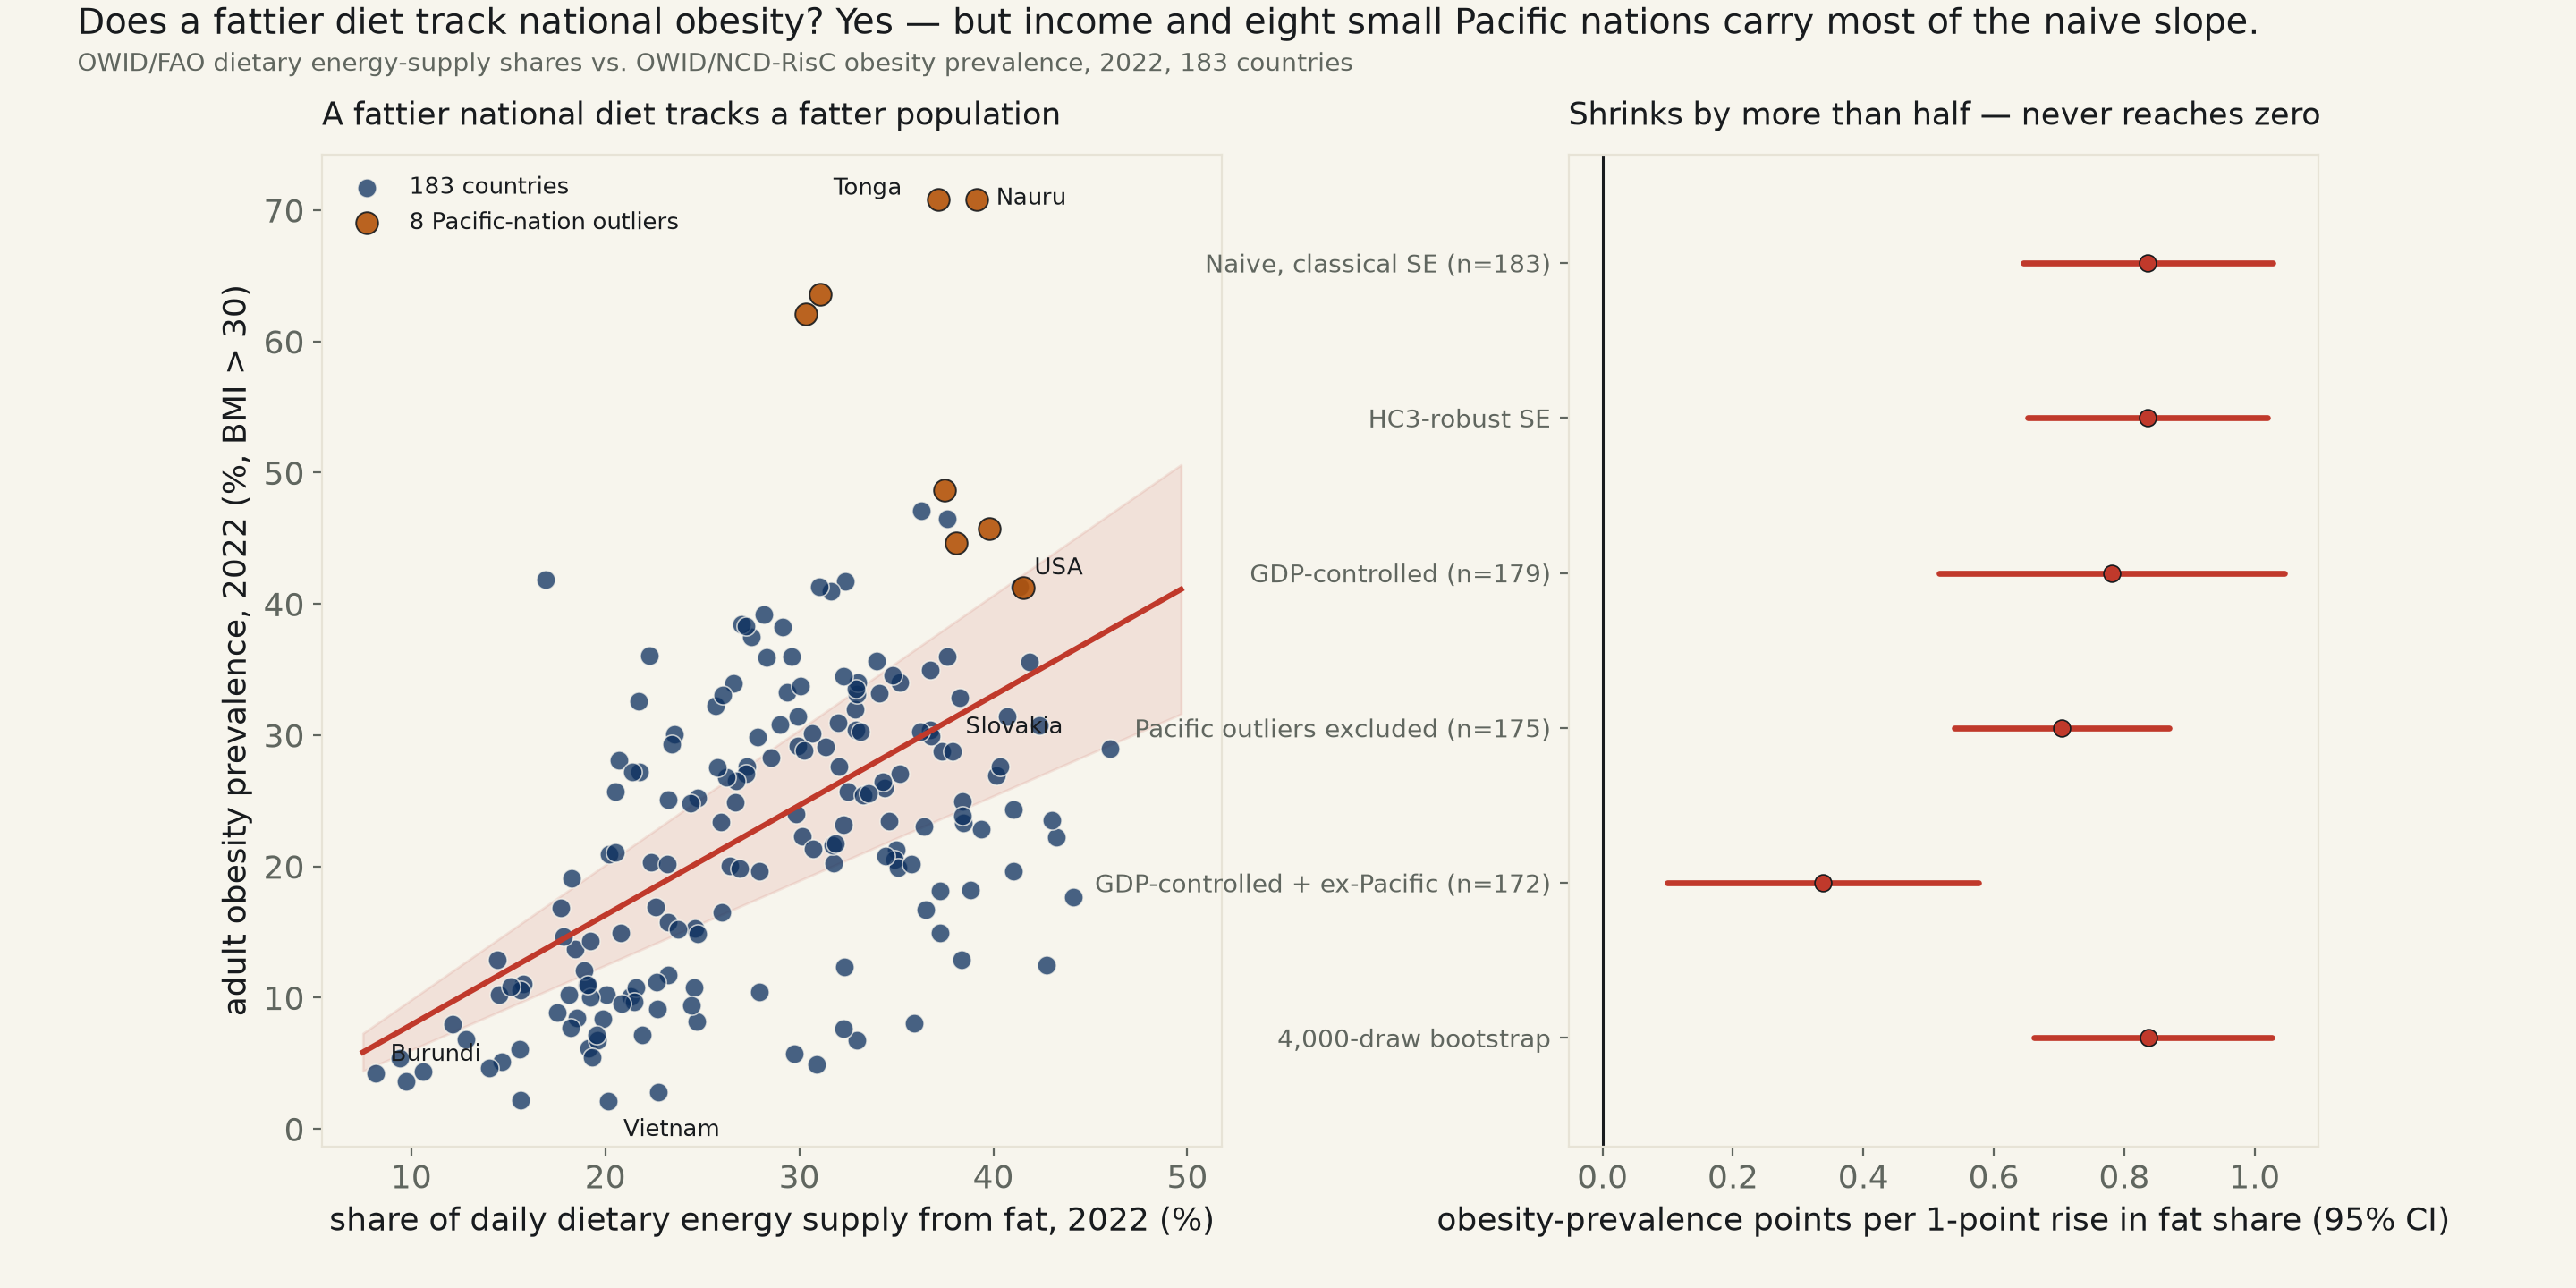
183 countries, 2022: OWID/FAO's own dietary energy-supply share from fat vs. OWID/NCD-RisC/WHO's own adult obesity prevalence, with World Bank GDP per capita already joined in the same source file. The naive slope excludes zero at every cut this run fit — but controlling for income and excluding eight small, extreme-outlier Pacific nations together cuts it to 40% of its naive size.
Backlog idea #80 names the standard nutrition-transition claim: as national diets shift toward more fat (and sugar) and away from staple carbohydrates, obesity rises. The idea names sugar specifically; no OWID/FAO grapher slug publishes sugar supply per capita as its own series (checked six plausible slugs, all 404) — substituted the two macronutrient shares that ARE published this way and that do carry sugar inside them, dietary energy share from fat and from carbohydrates, both FAO Food Balance Sheets re-served by Our World in Data, keyless, each file already joined by OWID itself to World Bank GDP per capita (PPP). See fetch_dietobesity_573.py for the wall and the substitute.
The naive relationship is real and large. OLS, obesity prevalence on fat share of daily dietary energy, 183 countries, 2022: slope +0.836 obesity-prevalence points per 1-point rise in fat share, 95% CI [+0.645, +1.027], p<0.001, R²=0.292 — excludes zero, agreeing under HC3-robust SE (CI [+0.652, +1.020]), a distribution-free Spearman rank correlation (ρ=0.548, p<0.001), and a 4,000-draw bootstrap (CI [+0.662, +1.027], 100% of resampled slopes positive). The complementary macronutrient runs the mirror image, as it must when fat, carbohydrate, and protein shares sum to 100%: carb share alone, slope -0.750, CI [-0.914, -0.586] — excludes zero, negative.
Neither obvious confound moves it much on its own. GDP per capita is the first suspect: richer countries eat more fat (controlling for nothing, log(GDP) alone predicts fat share with slope +5.01 points per log-GDP-point, CI [+4.22, +5.80], R²=0.47) and richer countries are more obese (log(GDP) alone predicts obesity, slope +4.43, CI [+2.89, +5.96]) for reasons that have nothing to do with fat causing obesity directly — more sedentary work, more calorie-dense processed food, less subsistence labor. Controlling for it: slope +0.781, CI [+0.516, +1.045] — barely moved from naive. Separately, 8 small Pacific nations (French Polynesia, Kiribati, Marshall Islands, Micronesia (country), Nauru, Samoa, Tonga, and Tuvalu) are this sample's most extreme outliers — Tonga and Nauru both post obesity prevalence above 70%, a genetic-and-food-system story specific to the region, not a general fat/obesity mechanism. Excluding them alone: slope +0.704, CI [+0.539, +0.869] — also barely moved.
Doing both at once is where the shrinkage shows up. GDP-controlled AND Pacific-excluded, the strictest cut this run fits: slope +0.338, CI [+0.100, +0.577], p=0.006 — still excludes zero, but at 40% of the naive slope's size. The two confounds barely overlap individually (each alone leaves the estimate close to the naive figure) but compound when applied together, because the Pacific nations are disproportionately responsible for whatever of the naive slope GDP alone does not explain. The same strictest cut on carb share agrees in mirror image: slope -0.319, CI [-0.535, -0.103].
Named: Burundi posts the lowest fat share in the sample (8.2%) at a 4.2% obesity rate; Slovakia posts the highest fat share (46.0%) at 29.0% obesity. Vietnam posts this sample's lowest obesity rate (2.1%); the United States sits at 41.3% obesity on a 41.3% fat share. Read plainly: a fattier national diet does track a fatter population at every cut this run fit, including the strictest one — but the naive cross-country slope oversells how much of that is fat itself rather than the income level and the small set of extreme-outlier nations riding along with it.
| Spec | n | Slope (obesity pts / 1 pt fat share) | 95% CI | p | R² | Verdict |
|---|---|---|---|---|---|---|
| Naive OLS (fat share), classical SE | 183 | +0.836 | [+0.645, +1.027] | 3.04e-15 | 0.292 | excludes zero |
| HC3-robust SE | 183 | +0.836 | [+0.652, +1.020] | 4.89e-19 | 0.292 | excludes zero |
| GDP-controlled | 179 | +0.781 | [+0.516, +1.045] | 2.77e-08 | 0.291 | excludes zero |
| Pacific outliers excluded | 175 | +0.704 | [+0.539, +0.869] | 1.27e-14 | 0.291 | excludes zero |
| GDP-controlled + Pacific excluded | 172 | +0.338 | [+0.100, +0.577] | 0.00569 | 0.359 | excludes zero |
Sorted by fat share, low to high.
| Country | Fat share, % | Carb share, % | Obesity, % | GDP/cap (PPP, $) | Pacific outlier |
|---|---|---|---|---|---|
| Burundi | 8.2 | 82.7 | 4.2 | 1,028 | |
| Democratic Republic of Congo | 9.4 | 85.0 | 5.4 | 1,484 | |
| Madagascar | 9.7 | 82.3 | 3.6 | 1,602 | |
| Cambodia | 10.6 | 80.2 | 4.4 | 6,458 | |
| Laos | 12.1 | 77.7 | 8.0 | 8,183 | |
| Sierra Leone | 12.8 | 77.6 | 6.8 | 2,935 | |
| Rwanda | 14.0 | 76.7 | 4.6 | 2,983 | |
| Ghana | 14.5 | 76.8 | 12.9 | 6,728 | |
| Sri Lanka | 14.5 | 75.3 | 10.2 | 13,249 | |
| Bangladesh | 14.7 | 74.8 | 5.1 | 7,888 | |
| Yemen | 15.1 | 73.8 | 10.9 | ||
| Malawi | 15.6 | 74.4 | 6.1 | 1,660 | |
| Ethiopia | 15.6 | 71.9 | 2.2 | 2,656 | |
| Mali | 15.7 | 73.7 | 10.5 | 2,814 | |
| Cote d'Ivoire | 15.8 | 75.1 | 11.1 | 6,272 | |
| Egypt | 16.9 | 71.5 | 41.9 | 16,360 | |
| Philippines | 17.5 | 71.8 | 8.9 | 9,457 | |
| Afghanistan | 17.7 | 71.5 | 16.9 | 1,982 | |
| Liberia | 17.8 | 73.5 | 14.7 | 1,579 | |
| Gambia | 18.1 | 72.1 | 10.3 | 2,863 | |
| Myanmar | 18.2 | 70.6 | 7.7 | 5,350 | |
| Lesotho | 18.3 | 71.1 | 19.1 | 2,578 | |
| Cameroon | 18.4 | 71.6 | 13.7 | 4,844 | |
| Mozambique | 18.6 | 73.2 | 8.5 | 1,477 | |
| Somalia | 18.9 | 72.3 | 12.0 | 1,388 | |
| Angola | 19.0 | 72.8 | 11.0 | 8,751 | |
| Togo | 19.1 | 72.1 | 11.0 | 3,086 | |
| Burkina Faso | 19.2 | 67.1 | 6.2 | 2,469 | |
| Thailand | 19.2 | 71.3 | 14.3 | 20,768 | |
| Haiti | 19.2 | 71.6 | 10.1 | 3,030 | |
| Niger | 19.3 | 67.2 | 5.4 | 1,725 | |
| Uganda | 19.6 | 71.2 | 7.2 | 2,725 | |
| Nepal | 19.6 | 69.2 | 6.7 | 4,763 | |
| Guinea | 19.9 | 72.2 | 8.4 | 3,792 | |
| Djibouti | 20.1 | 68.7 | 10.3 | 6,181 | |
| Vietnam | 20.2 | 66.8 | 2.1 | 12,980 | |
| Mauritania | 20.2 | 68.1 | 20.9 | 6,053 | |
| Morocco | 20.5 | 67.7 | 21.1 | 8,690 | |
| Eswatini | 20.5 | 70.3 | 25.7 | 9,928 | |
| Guyana | 20.7 | 65.8 | 28.1 | 37,068 | |
| Comoros | 20.8 | 68.3 | 14.9 | 3,466 | |
| Tanzania | 20.8 | 69.4 | 9.5 | 3,547 | |
| Benin | 21.3 | 68.3 | 10.1 | 3,588 | |
| Peru | 21.4 | 66.0 | 27.2 | 15,567 | |
| Kenya | 21.5 | 67.9 | 9.7 | 5,492 | |
| Congo | 21.6 | 68.1 | 10.8 | 6,205 | |
| Nicaragua | 21.7 | 67.3 | 32.6 | 7,278 | |
| Bolivia | 21.7 | 64.6 | 27.2 | 11,488 | |
| India | 21.9 | 66.8 | 7.2 | 8,347 | |
| Iraq | 22.3 | 67.5 | 36.0 | 13,433 | |
| Gabon | 22.4 | 64.8 | 20.3 | 18,662 | |
| Botswana | 22.6 | 66.2 | 16.9 | 18,647 | |
| Nigeria | 22.6 | 68.1 | 11.2 | 7,752 | |
| Zambia | 22.7 | 68.3 | 9.1 | 3,585 | |
| East Timor | 22.7 | 66.0 | 2.8 | 5,348 | |
| Solomon Islands | 23.2 | 67.0 | 20.2 | 2,330 | |
| Namibia | 23.2 | 66.2 | 15.7 | 9,953 | |
| Bhutan | 23.2 | 67.4 | 11.7 | 14,061 | |
| Guatemala | 23.2 | 66.4 | 25.1 | 12,144 | |
| Suriname | 23.4 | 65.4 | 29.3 | 18,743 | |
| El Salvador | 23.6 | 64.5 | 30.0 | 11,086 | |
| Sao Tome and Principe | 23.7 | 66.8 | 15.2 | 5,632 | |
| Iran | 24.4 | 64.4 | 24.8 | 16,378 | |
| Senegal | 24.4 | 65.6 | 9.4 | 4,229 | |
| Indonesia | 24.6 | 64.6 | 10.8 | 13,334 | |
| Cape Verde | 24.6 | 63.1 | 15.3 | 8,850 | |
| China | 24.7 | 60.5 | 8.2 | 21,499 | |
| Bosnia and Herzegovina | 24.8 | 62.5 | 25.3 | 19,298 | |
| Sudan | 24.8 | 64.0 | 14.9 | 3,132 | |
| Paraguay | 25.7 | 65.0 | 32.3 | 15,223 | |
| Ukraine | 25.8 | 61.5 | 27.6 | 13,787 | |
| Algeria | 25.9 | 62.9 | 23.4 | 14,782 | |
| Maldives | 26.0 | 59.0 | 16.5 | 21,358 | |
| Seychelles | 26.0 | 60.1 | 33.0 | 27,276 | |
| Tunisia | 26.2 | 61.8 | 26.8 | 12,712 | |
| Kyrgyzstan | 26.4 | 59.8 | 20.0 | 6,140 | |
| Jamaica | 26.6 | 60.7 | 34.0 | 11,097 | |
| Serbia | 26.7 | 59.3 | 24.9 | 24,652 | |
| Papua New Guinea | 26.7 | 62.0 | 26.5 | 4,126 | |
| Turkmenistan | 26.9 | 58.4 | 19.9 | 16,944 | |
| Georgia | 27.0 | 61.3 | 38.4 | 20,967 | |
| Moldova | 27.2 | 60.5 | 27.1 | 15,350 | |
| Saudi Arabia | 27.3 | 61.4 | 38.3 | 67,179 | |
| Azerbaijan | 27.3 | 60.8 | 27.6 | 21,051 | |
| Fiji | 27.5 | 60.8 | 37.5 | 12,118 | |
| Syria | 27.8 | 60.4 | 29.8 | 4,579 | |
| Tajikistan | 27.9 | 59.9 | 19.6 | 4,214 | |
| Guinea-Bissau | 27.9 | 63.9 | 10.4 | 2,601 | |
| Chile | 28.2 | 58.7 | 39.2 | 29,560 | |
| Panama | 28.3 | 59.5 | 35.9 | 33,915 | |
| Uzbekistan | 28.5 | 58.1 | 28.3 | 10,091 | |
| Lebanon | 29.0 | 59.9 | 30.8 | 11,475 | |
| Barbados | 29.1 | 56.8 | 38.3 | 20,495 | |
| Jordan | 29.4 | 59.5 | 33.2 | 10,158 | |
| Mexico | 29.6 | 58.2 | 36.0 | 21,392 | |
| Chad | 29.7 | 56.1 | 5.8 | 2,449 | |
| Colombia | 29.8 | 59.4 | 24.0 | 18,459 | |
| Dominica | 29.9 | 56.8 | 31.4 | 17,551 | |
| Honduras | 29.9 | 60.5 | 29.2 | 6,353 | |
| Saint Lucia | 30.0 | 55.9 | 33.7 | 22,811 | |
| Malaysia | 30.2 | 57.2 | 22.3 | 32,129 | |
| Oman | 30.3 | 57.6 | 28.8 | 39,780 | |
| Samoa | 30.3 | 56.7 | 62.1 | 6,450 | yes |
| North Macedonia | 30.6 | 57.6 | 30.1 | 22,822 | |
| Pakistan | 30.7 | 57.5 | 21.3 | 5,526 | |
| Japan | 30.9 | 55.1 | 4.9 | 46,819 | |
| Qatar | 31.0 | 55.6 | 41.3 | 114,740 | |
| Tuvalu | 31.1 | 56.7 | 63.6 | 5,045 | yes |
| Dominican Republic | 31.3 | 58.0 | 29.1 | 22,987 | |
| Kuwait | 31.6 | 55.8 | 41.0 | 51,380 | |
| Russia | 31.7 | 54.8 | 21.6 | 38,215 | |
| Mauritius | 31.8 | 55.5 | 20.2 | 25,005 | |
| Slovenia | 31.9 | 55.3 | 21.8 | 47,059 | |
| Trinidad and Tobago | 32.0 | 56.1 | 31.0 | 30,784 | |
| Armenia | 32.0 | 54.6 | 27.6 | 17,886 | |
| Venezuela | 32.3 | 57.1 | 23.2 | ||
| South Sudan | 32.3 | 55.3 | 7.6 | ||
| Uruguay | 32.3 | 55.3 | 34.5 | 30,840 | |
| Zimbabwe | 32.3 | 56.1 | 12.4 | 5,037 | |
| Belize | 32.4 | 55.0 | 41.7 | 12,565 | |
| Albania | 32.5 | 53.5 | 25.7 | 19,389 | |
| Costa Rica | 32.9 | 55.3 | 31.9 | 25,290 | |
| Saint Vincent and the Grenadines | 32.9 | 51.7 | 33.6 | 16,835 | |
| South Africa | 32.9 | 55.5 | 30.4 | 13,767 | |
| Malta | 33.0 | 54.7 | 33.1 | 56,874 | |
| South Korea | 33.0 | 54.3 | 6.8 | 53,229 | |
| New Zealand | 33.0 | 53.6 | 34.0 | 49,843 | |
| Turkey | 33.1 | 54.8 | 30.3 | 33,521 | |
| Finland | 33.3 | 51.8 | 25.4 | 57,068 | |
| Poland | 33.6 | 53.5 | 25.6 | 43,405 | |
| Romania | 34.0 | 53.9 | 35.6 | 39,257 | |
| Libya | 34.1 | 54.0 | 33.2 | 11,450 | |
| Lithuania | 34.3 | 50.6 | 26.5 | 46,643 | |
| Belarus | 34.4 | 51.8 | 26.0 | 26,538 | |
| Vanuatu | 34.4 | 55.5 | 20.8 | 3,659 | |
| Cyprus | 34.6 | 51.9 | 23.5 | 50,841 | |
| Bahrain | 34.8 | 52.8 | 34.6 | 57,573 | |
| Luxembourg | 34.9 | 51.5 | 20.5 | 132,571 | |
| Kazakhstan | 35.0 | 52.2 | 21.3 | 33,506 | |
| Montenegro | 35.1 | 50.4 | 19.9 | 25,583 | |
| Ecuador | 35.2 | 54.2 | 27.1 | 14,187 | |
| Antigua and Barbuda | 35.2 | 49.1 | 34.0 | 27,786 | |
| Norway | 35.8 | 49.7 | 20.2 | 95,110 | |
| Central African Republic | 35.9 | 52.9 | 8.1 | 1,137 | |
| United Arab Emirates | 36.2 | 50.9 | 30.2 | 70,076 | |
| Bahamas | 36.3 | 48.2 | 47.1 | 34,343 | |
| Portugal | 36.4 | 49.7 | 23.0 | 41,071 | |
| Netherlands | 36.5 | 50.3 | 16.7 | 71,324 | |
| Grenada | 36.8 | 49.1 | 30.4 | 16,376 | |
| Croatia | 36.8 | 50.0 | 35.0 | 39,864 | |
| Ireland | 36.8 | 49.3 | 29.9 | 123,007 | |
| Tonga | 37.1 | 46.0 | 70.8 | 6,811 | yes |
| Denmark | 37.2 | 49.5 | 14.9 | 69,089 | |
| Sweden | 37.3 | 49.2 | 18.1 | 62,544 | |
| Brazil | 37.4 | 50.4 | 28.8 | 18,554 | |
| French Polynesia | 37.5 | 47.8 | 48.7 | yes | |
| Saint Kitts and Nevis | 37.6 | 49.8 | 46.5 | 29,750 | |
| Argentina | 37.6 | 47.9 | 36.0 | 27,825 | |
| United Kingdom | 37.9 | 49.1 | 28.8 | 53,980 | |
| Kiribati | 38.1 | 50.9 | 44.7 | 3,127 | yes |
| Greece | 38.3 | 48.6 | 32.9 | 35,828 | |
| France | 38.4 | 48.4 | 12.9 | 53,674 | |
| Estonia | 38.4 | 48.2 | 24.9 | 43,125 | |
| Mongolia | 38.4 | 44.1 | 23.8 | 15,310 | |
| Israel | 38.4 | 47.4 | 23.3 | 48,132 | |
| Italy | 38.8 | 48.8 | 18.2 | 52,333 | |
| Nauru | 39.1 | 46.5 | 70.8 | 12,019 | yes |
| Iceland | 39.4 | 44.3 | 22.8 | 66,581 | |
| Micronesia (country) | 39.8 | 49.3 | 45.7 | 3,816 | yes |
| Canada | 40.1 | 46.9 | 27.0 | 58,583 | |
| Latvia | 40.3 | 46.8 | 27.6 | 37,719 | |
| Australia | 40.7 | 45.8 | 31.5 | 60,029 | |
| Germany | 41.0 | 46.8 | 24.3 | 63,778 | |
| Spain | 41.0 | 45.3 | 19.6 | 46,733 | |
| United States | 41.3 | 46.2 | 41.3 | 72,829 | |
| Marshall Islands | 41.5 | 44.6 | 41.3 | 6,938 | yes |
| Hungary | 41.9 | 47.6 | 35.6 | 40,611 | |
| Czechia | 42.4 | 46.2 | 30.8 | 48,391 | |
| Switzerland | 42.8 | 45.2 | 12.5 | 85,762 | |
| Bulgaria | 43.0 | 45.7 | 23.5 | 32,434 | |
| Belgium | 43.2 | 45.1 | 22.2 | 62,603 | |
| Austria | 44.1 | 44.3 | 17.7 | 65,694 | |
| Slovakia | 46.0 | 42.7 | 29.0 | 38,649 |
Method. Fat and carbohydrate share of daily dietary energy supply: FAO Food Balance Sheets, re-served by Our World in Data (share-of-dietary-energy-supply-from-fats-vs-gdp-per-capita and the carbohydrate equivalent), 2022, keyless. Obesity: OWID's own re-serving of NCD-RisC/WHO adult obesity prevalence (BMI>30, crude estimate, ages 18+, both sexes), 2022. GDP per capita (PPP): World Bank, already joined to the fat/carb share files by OWID itself. All three merged on ISO3 country code, non-country aggregates (OWID_WRL, WHO regional codes) excluded by construction; 183 countries carry all three series, 179 of those also carry a GDP figure. Eight small Pacific nations (Tonga, Nauru, Tuvalu, Samoa, Kiribati, Marshall Islands, Micronesia, French Polynesia) flagged as this sample's most extreme obesity outliers and checked with and without, not silently dropped. OLS with classical and HC3-robust SE, a log-GDP control, a Pacific-exclusion check, both combined, a Spearman rank correlation, and a 4,000-draw case-resample bootstrap.
Limits, stated plainly. This is a single year's cross-country cross-section, not a panel or natural experiment — it cannot separate "a fattier diet causes obesity" from "whatever makes a country's diet fattier (income, urbanization, food-system industrialization) also independently makes it more obese," even after the two controls fitted here. National dietary-energy-supply shares are food-availability estimates (FAO's own balance-sheet method), not individual intake data, and do not capture within-country inequality in diet or body weight. Obesity prevalence is itself a modeled estimate (NCD-RisC) for most countries, not a census measurement. No causal mechanism is tested or claimed.
diet_obesity_573.csv (183 countries: fat/carb share, obesity, GDP per capita, Pacific-outlier flag) · fit output (JSON).