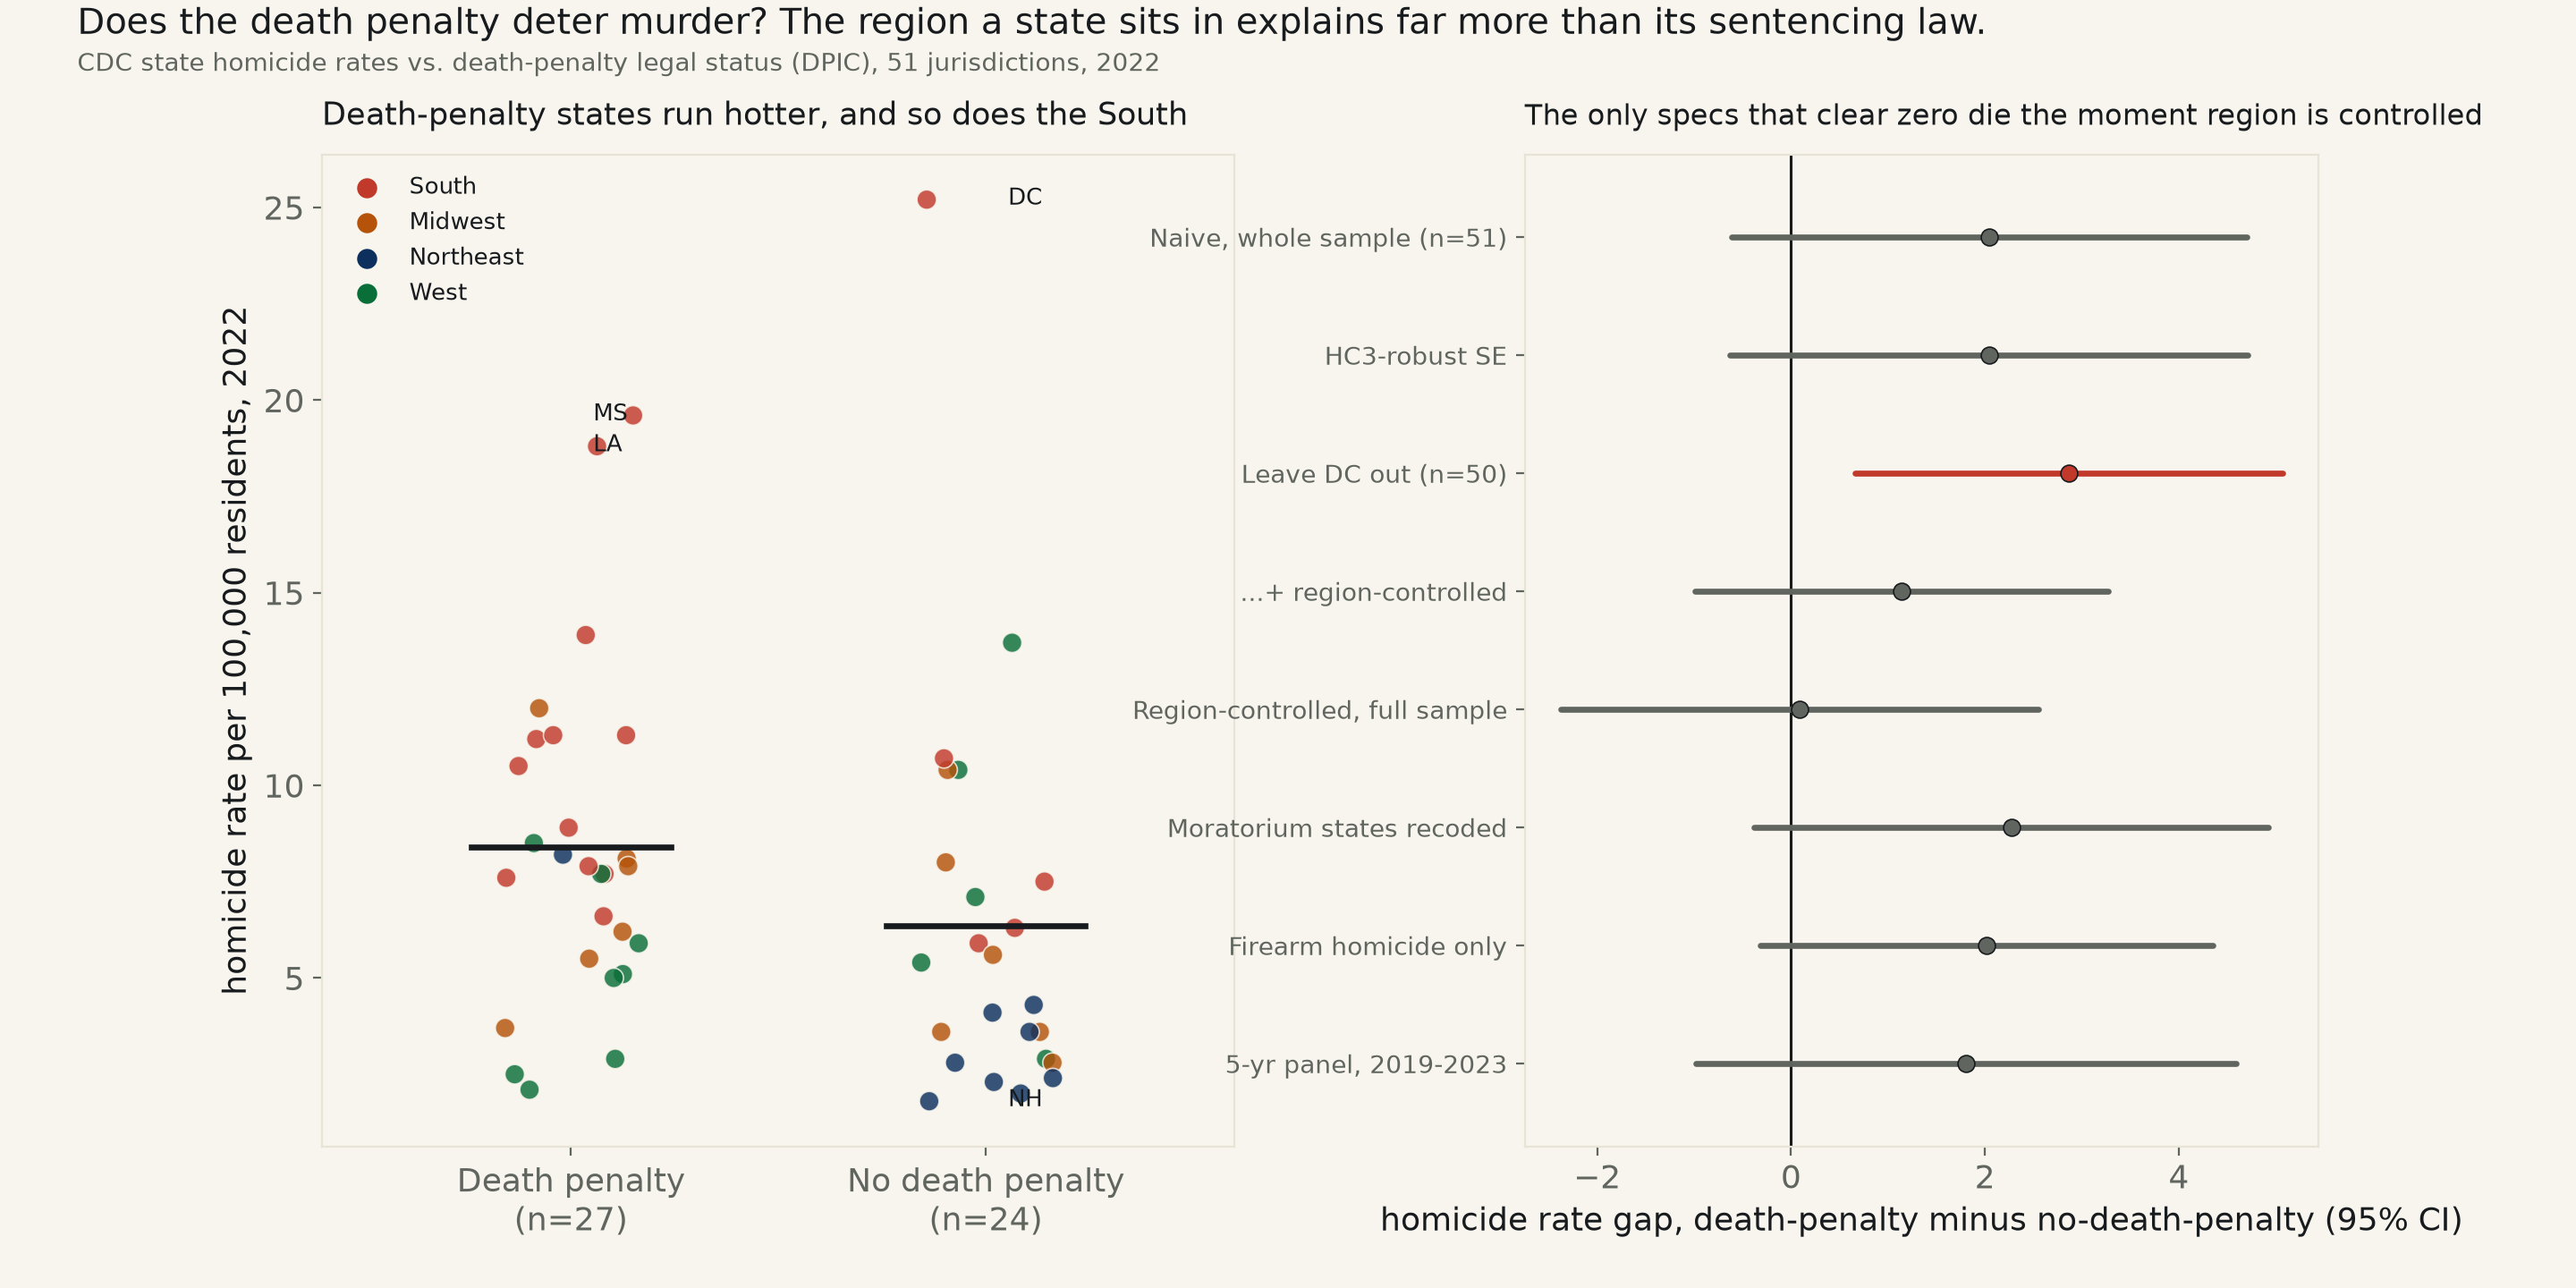
51 jurisdictions, 2022: CDC's own state homicide-rate series against death-penalty legal status (Death Penalty Information Center). The naive comparison already runs the wrong direction for a deterrence story and can't clear zero — until one outlier state (DC) is dropped, at which point it clears zero in that same wrong direction. Controlling for Census region, the real confound death-penalty states share with each other, erases the gap completely, with or without DC.
A bench idea, carrying its own [NULL] tag: does having a death-penalty statute actually deter murder? The standard test compares murder rates across death-penalty and abolitionist states. FBI UCR, the source the idea names, sits behind an api.data.gov key this box doesn't hold; substituted CDC's own pre-computed state homicide-rate series ("Mapping Injury, Overdose, and Violence - State," data.cdc.gov, keyless), which reports the identical quantity — deaths per 100,000 residents by intent — without a population join. Death-penalty legal status, year by year, is the Death Penalty Information Center's own "State by State" page, scraped live, including every abolition year it publishes; see fetch_deathpenalty_572.py for the full coding, including the judgment call on Washington (statute struck down by the state supreme court in 2018, formally repealed 2023; coded as no-death-penalty from 2018 onward) and the four states under an executive hold on executions (California, Ohio, Oregon, Pennsylvania — legally retentionist, zero executions possible under the sitting governor; coded as death-penalty in the primary spec, recoded in a sensitivity check below).
The naive comparison already runs backward for a deterrence story, and can't rule out noise. 2022, 51 jurisdictions (50 states + DC), 27 with the death penalty on the books and 24 without: death-penalty states average +2.04 more homicides per 100,000 residents, 95% CI [-0.61, +4.70], p=0.13 — contains zero. HC3-robust SE agrees almost exactly (CI [-0.63, +4.72]); an explicit Welch's t-test on the two group means agrees too (death-penalty mean 8.39, no-death-penalty mean 6.35, p=0.13).
Drop one outlier state and the null turns into a statistically real gap, in the wrong direction. District of Columbia has no death penalty and this sample's single highest homicide rate (25.2 per 100k) by a wide margin — it isn't a state, and it's the obvious first thing to check. Excluding it, the slope widens rather than shrinks: +2.86, CI [+0.66, +5.07], p=0.012 — excludes zero. Read plainly and without controls, the one spec of this run that clears the standard threshold says death-penalty states have higher murder rates, not lower.
That significant gap is the region confound, not a deterrence signal running backward. Death-penalty states cluster heavily in the South (12 of the region's 17 jurisdictions in this sample), a region that runs structurally hotter on homicide for reasons that have nothing to do with sentencing law. Census region alone (Northeast/Midwest/South/West, no death-penalty term at all) explains 36.7% of the variance in this sample's homicide rates. Add region as a control: the full-sample slope collapses to +0.09, CI [-2.38, +2.55] — contains zero, essentially flat. The same control applied to the DC-excluded sample — the one spec that cleared zero on its own — collapses it too: +1.14, CI [-0.99, +3.27] — contains zero again. The only spec in this run that excludes zero does so because of where its states sit on the map, not because of their sentencing law.
Three more cuts, all agreeing with the full-sample null: recoding the four states under an active execution moratorium (California, Ohio, Oregon, Pennsylvania) as no-death-penalty, since none of them has actually executed anyone under its sitting governor, +2.27, CI [-0.38, +4.92]; restricting the outcome to firearm homicide alone, +2.02, CI [-0.32, +4.35]; and a five-year pooled panel, 2019-2023, state-clustered SE, year dummies, +1.81, CI [-0.98, +4.59], n=255. Named: New Hampshire, no death penalty, posts this sample's single lowest homicide rate (1.8 per 100k); Mississippi and Louisiana, both death-penalty Southern states, post two of its highest (19.6 and 18.8).
| Spec | n | Gap (homicides / 100k) | 95% CI | p | R² | Verdict |
|---|---|---|---|---|---|---|
| Naive, whole sample, classical SE | 51 | +2.04 | [-0.61, +4.70] | 0.129 | 0.046 | contains zero |
| HC3-robust SE | 51 | +2.04 | [-0.63, +4.72] | 0.134 | 0.046 | contains zero |
| Leave DC out (n=50) | 50 | +2.86 | [+0.66, +5.07] | 0.012 | 0.124 | excludes zero |
| ...+ region-controlled | 50 | +1.14 | [-0.99, +3.27] | 0.286 | 0.388 | contains zero |
| Region-controlled, full sample | 51 | +0.09 | [-2.38, +2.55] | 0.944 | 0.367 | contains zero |
| Moratorium states recoded as no-DP | 51 | +2.27 | [-0.38, +4.92] | 0.091 | 0.057 | contains zero |
| Firearm-homicide rate only | 51 | +2.02 | [-0.32, +4.35] | 0.089 | 0.058 | contains zero |
| 5-year panel, 2019-2023, state-clustered SE | 255 | +1.81 | [-0.98, +4.59] | 0.204 | 0.047 | contains zero |
Sorted by homicide rate, low to high. The full 2019-2023 panel (255 rows) is in the downloadable CSV.
| State | Census region | Homicide rate /100k | Firearm homicide rate /100k | Death penalty? | Moratorium? |
|---|---|---|---|---|---|
| New Hampshire | Northeast | 1.8 | 1.3 | No | |
| Rhode Island | Northeast | 2.0 | 1.3 | No | |
| Utah | West | 2.1 | 1.4 | Yes | |
| Maine | Northeast | 2.3 | 1.4 | No | |
| Massachusetts | Northeast | 2.4 | 1.5 | No | |
| Idaho | West | 2.5 | 2.0 | Yes | |
| Vermont | Northeast | 2.8 | 2.0 | No | |
| Iowa | Midwest | 2.8 | 2.0 | No | |
| Hawaii | West | 2.9 | 1.3 | No | |
| Wyoming | West | 2.9 | 2.4 | Yes | |
| New Jersey | Northeast | 3.6 | 2.5 | No | |
| Minnesota | Midwest | 3.6 | 2.5 | No | |
| North Dakota | Midwest | 3.6 | 2.2 | No | |
| Nebraska | Midwest | 3.7 | 2.4 | Yes | |
| Connecticut | Northeast | 4.1 | 3.2 | No | |
| New York | Northeast | 4.3 | 2.7 | No | |
| Oregon | West | 5.0 | 3.7 | Yes | Yes |
| Montana | West | 5.1 | 3.5 | Yes | |
| Washington | West | 5.4 | 4.0 | No | |
| Kansas | Midwest | 5.5 | 4.3 | Yes | |
| Wisconsin | Midwest | 5.6 | 4.7 | No | |
| West Virginia | South | 5.9 | 4.6 | No | |
| California | West | 5.9 | 4.3 | Yes | Yes |
| South Dakota | Midwest | 6.2 | 3.0 | Yes | |
| Delaware | South | 6.3 | 4.7 | No | |
| Florida | South | 6.6 | 5.3 | Yes | |
| Colorado | West | 7.1 | 5.2 | No | |
| Virginia | South | 7.5 | 6.4 | No | |
| Texas | South | 7.6 | 6.1 | Yes | |
| Nevada | West | 7.7 | 5.7 | Yes | |
| Kentucky | South | 7.7 | 6.3 | Yes | |
| Oklahoma | South | 7.9 | 6.0 | Yes | |
| Ohio | Midwest | 7.9 | 6.3 | Yes | Yes |
| Michigan | Midwest | 8.0 | 6.4 | No | |
| Indiana | Midwest | 8.1 | 6.8 | Yes | |
| Pennsylvania | Northeast | 8.2 | 6.4 | Yes | Yes |
| Arizona | West | 8.5 | 6.7 | Yes | |
| North Carolina | South | 8.9 | 7.3 | Yes | |
| Alaska | West | 10.4 | 5.6 | No | |
| Illinois | Midwest | 10.4 | 8.7 | No | |
| Tennessee | South | 10.5 | 8.6 | Yes | |
| Maryland | South | 10.7 | 8.7 | No | |
| Georgia | South | 11.2 | 9.5 | Yes | |
| Arkansas | South | 11.3 | 9.5 | Yes | |
| South Carolina | South | 11.3 | 9.4 | Yes | |
| Missouri | Midwest | 12.0 | 10.2 | Yes | |
| New Mexico | West | 13.7 | 10.3 | No | |
| Alabama | South | 13.9 | 12.3 | Yes | |
| Louisiana | South | 18.8 | 16.1 | Yes | |
| Mississippi | South | 19.6 | 17.4 | Yes | |
| District of Columbia | South | 25.2 | 21.0 | No |
Method. Homicide rate: CDC "Mapping Injury, Overdose, and Violence - State" (data.cdc.gov, Socrata id fpsi-y8tj), intent=All_Homicide and FA_Homicide (firearm subset), period=2019 through 2023 yearly, all 51 jurisdictions returning a non-suppressed rate every year at fetch time (2026-10-16); 2024 excluded as the most recent, least-settled provisional year. Death-penalty status: Death Penalty Information Center's "State by State" page, scraped live 2026-10-16, which publishes the current 27-state death-penalty list, the 23-state-plus-DC abolition list with abolition year, and the 4 states under an executive hold on executions; status for each of 2019-2023 derived by comparing that year to each state's own abolition year. OLS with classical and HC3-robust SE, an explicit Welch's t-test on group means, a DC-exclusion check, a Census-4-region control (Northeast/Midwest/South/West, official Census Bureau regional definitions), a moratorium-recoding sensitivity check, a firearm-only outcome, and a 5-year state-clustered panel with year fixed effects.
Limits, stated plainly. This is an ecological, state-level comparison, not the individual-level or natural-experiment design (e.g., a state's own abolition or reinstatement, compared to itself over time) that the stronger empirical deterrence literature uses — a single cross-section, even region-controlled, can't rule out that some other state-level factor correlated with both region and death-penalty adoption is doing the remaining work, nor can it speak to whether an individual murder was deterred by a sentence that in most death-penalty states is rarely or never actually carried out. The DPIC moratorium list only names 4 states explicitly as having a declared executive hold; it does not capture how many of the 27 nominal death-penalty states have performed zero executions in recent years for other reasons (legal challenges, drug-protocol shortages), so the "moratorium-recoded" spec understates how rarely this sentence is actually carried out almost everywhere it remains on the books.
death_penalty_homicide_572.csv (255 rows: 51 jurisdictions × 2019-2023, homicide + firearm-homicide rate, death-penalty status, moratorium flag) · fit output (JSON).
