50 states + DC, 2024: Hirsch & Macpherson's own CPS-ORG union membership tabulation vs. the Census Bureau's own ACS Gini Index of Income Inequality. The textbook claim is that unions compress the wage distribution, so more union density should mean less inequality. Naive OLS runs the wrong direction and contains zero either way, and splitting out private-sector density — the sector the mechanism actually names — doesn't rescue it.
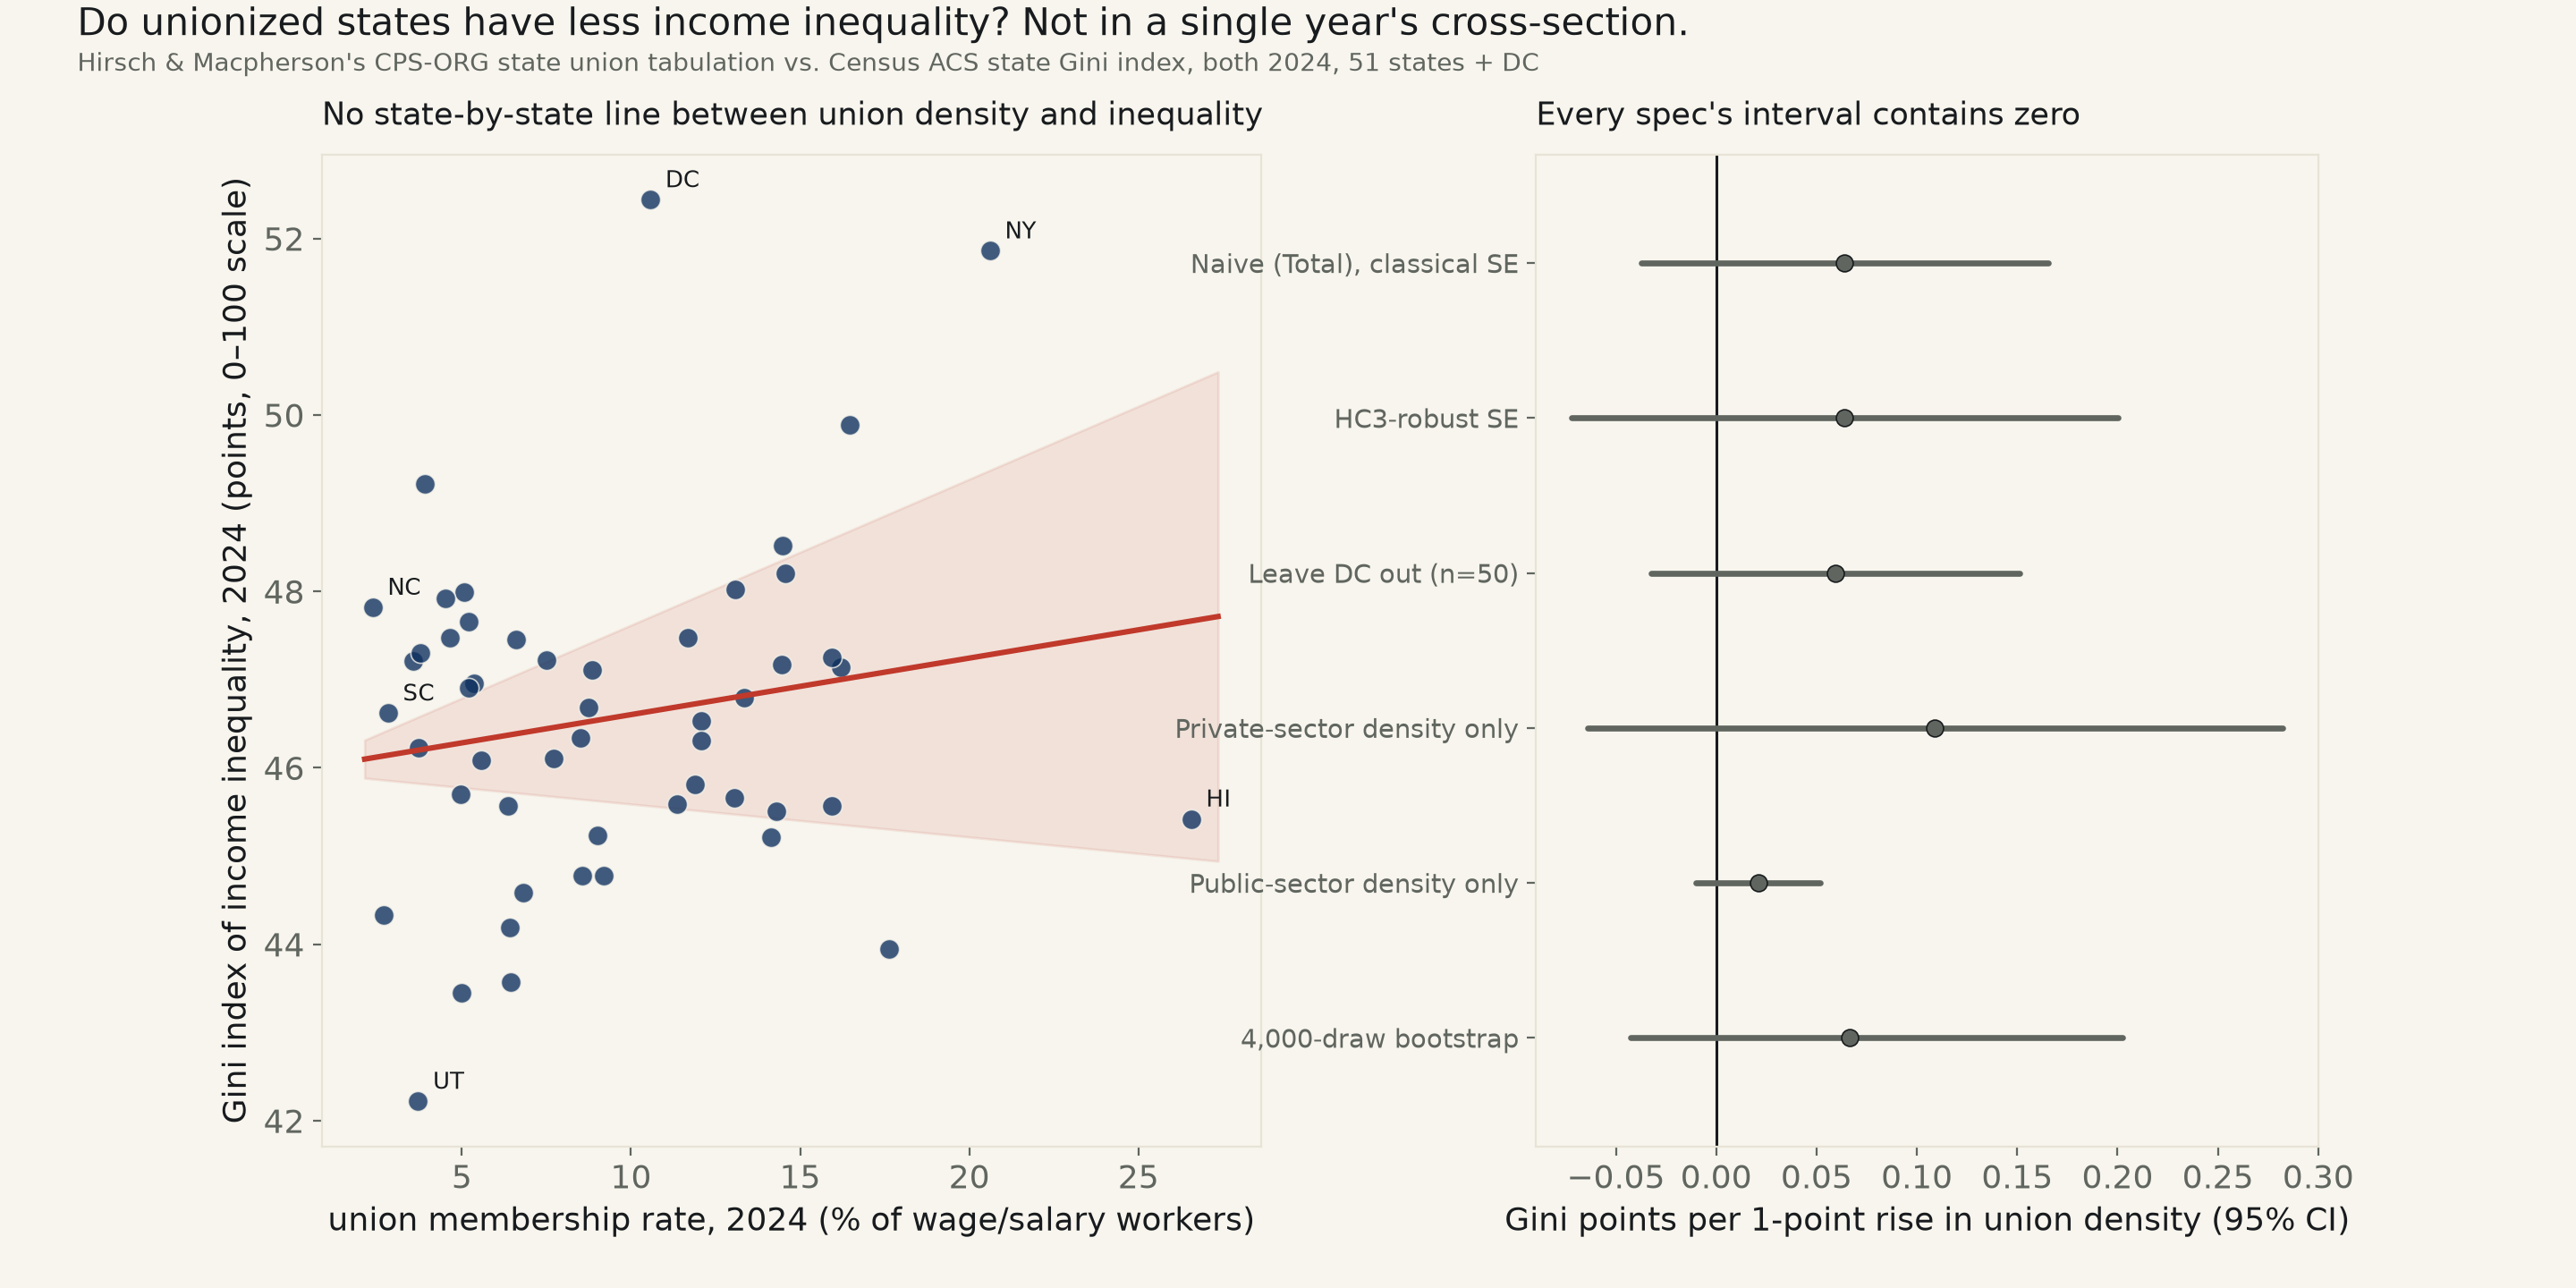
Backlog idea #34 names the standard claim: unions bargain for higher wages at the middle and bottom of the pay scale, compressing the distribution, so more-unionized states should show less income inequality. It's a real empirical literature at the national, time-series level (union decline tracks a meaningful share of the US wage-inequality rise since 1980 in several widely cited labor-economics papers) — this run asks the narrower cross-sectional question: in a single recent year, do the states with higher union membership actually show lower Gini scores than the states with lower membership? Two real, cited, keyless sources, both substituting around a wall (BLS's own state union table bot-blocks plain fetches from this box; the Census ACS API 302s without a registered key this box doesn't have) — see fetch_uniongini_571.py for both walls and both substitutes, each still the primary government series underneath.
The raw correlation runs the wrong way. Naive OLS, Gini (0–100 points) on union membership rate: slope +0.064 Gini points per 1-point rise in density, 95% CI [-0.037, +0.165], p=0.21, R²=0.032 — contains zero, and if anything leans positive (more union, slightly more unequal), not negative. HC3-robust SE agrees almost exactly (CI [-0.072, +0.200]); so does a distribution-free Spearman rank correlation (ρ=0.061, p=0.67) and a 4,000-draw bootstrap (CI [-0.042, +0.203], 86% of resampled slopes positive).
DC isn't manufacturing the null. District of Columbia posts this sample's single highest Gini (52.4) at a mid-pack union rate (10.6%) and isn't a state at all, so it's the obvious first thing to drop: excluding it moves the slope to +0.059, CI [-0.032, +0.151] — essentially unchanged, still contains zero.
Isolating the sector the mechanism actually names doesn't rescue the claim. The wage-compression story is specifically about private-sector collective bargaining; public-sector union wages are set by a different process entirely (legislatures and civil-service pay scales, not firm-level bargaining power against a profit margin). Splitting unionstats.com's own sector breakdown: private-sector density alone, slope +0.109, CI [-0.064, +0.282] — contains zero, and the point estimate is larger (more positive, further from the claimed direction) than the pooled figure, not smaller. Public-sector density alone, slope +0.021, CI [-0.010, +0.052] — the tightest interval of any spec here, and it still contains zero.
Named: Utah posts the lowest Gini in the 51-row sample (42.2) at a union rate below the national median (3.7%); Hawaii posts the highest union rate in the country by a wide margin (26.6%, next closest is New York at 20.6%) and a Gini (45.4) that lands almost exactly on the 51-row mean (46.6) — neither extreme is doing the work a clean negative relationship would need. Read plainly: whatever is driving the real, well-documented national decline in union density alongside the national rise in inequality since 1980, it is not showing up as a state-by-state line in a single year's snapshot, in the whole sample or in either sector split.
| Spec | n | Slope (Gini pts / 1 pt density) | 95% CI | p | R² | Verdict |
|---|---|---|---|---|---|---|
| Naive OLS (Total sector), classical SE | 51 | +0.064 | [-0.037, +0.165] | 0.210 | 0.032 | contains zero |
| HC3-robust SE | 51 | +0.064 | [-0.072, +0.200] | 0.356 | 0.032 | contains zero |
| Leave DC out (n=50) | 50 | +0.059 | [-0.032, +0.151] | 0.200 | 0.034 | contains zero |
| Private-sector density only | 51 | +0.109 | [-0.064, +0.282] | 0.212 | 0.032 | contains zero |
| Public-sector density only | 51 | +0.021 | [-0.010, +0.052] | 0.180 | 0.036 | contains zero |
Sorted by union density, low to high.
| State | Union density, % | Private density, % | Public density, % | Gini (0–100) |
|---|---|---|---|---|
| North Carolina | 2.4 | 1.6 | 7.2 | 47.8 |
| South Dakota | 2.7 | 1.3 | 11.2 | 44.3 |
| South Carolina | 2.8 | 1.5 | 9.6 | 46.6 |
| Arkansas | 3.6 | 2.5 | 9.0 | 47.2 |
| Utah | 3.7 | 2.1 | 11.5 | 42.2 |
| Arizona | 3.7 | 2.4 | 12.3 | 46.2 |
| Georgia | 3.8 | 2.2 | 12.9 | 47.3 |
| Louisiana | 3.9 | 2.4 | 11.7 | 49.2 |
| Texas | 4.5 | 2.7 | 15.6 | 47.9 |
| Tennessee | 4.6 | 3.2 | 12.9 | 47.5 |
| North Dakota | 5.0 | 3.4 | 12.5 | 45.7 |
| Idaho | 5.0 | 3.0 | 16.0 | 43.5 |
| Florida | 5.1 | 2.7 | 23.0 | 48.0 |
| Virginia | 5.2 | 2.7 | 14.0 | 46.9 |
| Mississippi | 5.2 | 4.2 | 9.7 | 47.7 |
| Oklahoma | 5.4 | 2.5 | 16.1 | 47.0 |
| Wyoming | 5.6 | 3.8 | 10.9 | 46.1 |
| Kansas | 6.4 | 4.0 | 17.1 | 45.6 |
| Wisconsin | 6.4 | 4.8 | 18.1 | 44.2 |
| Iowa | 6.4 | 4.2 | 19.6 | 43.6 |
| Alabama | 6.6 | 4.4 | 19.2 | 47.5 |
| Nebraska | 6.8 | 3.1 | 28.3 | 44.6 |
| New Mexico | 7.5 | 4.2 | 16.9 | 47.2 |
| Colorado | 7.7 | 4.7 | 22.0 | 46.1 |
| Missouri | 8.5 | 6.4 | 20.7 | 46.3 |
| Delaware | 8.6 | 3.4 | 36.6 | 44.8 |
| West Virginia | 8.7 | 5.5 | 22.6 | 46.7 |
| Kentucky | 8.8 | 7.6 | 17.2 | 47.1 |
| Indiana | 9.0 | 7.2 | 21.4 | 45.2 |
| New Hampshire | 9.2 | 4.7 | 38.6 | 44.8 |
| District of Columbia | 10.6 | 6.6 | 21.1 | 52.4 |
| Maryland | 11.4 | 5.2 | 28.8 | 45.6 |
| Pennsylvania | 11.7 | 6.8 | 48.1 | 47.5 |
| Montana | 11.9 | 6.6 | 37.2 | 45.8 |
| Ohio | 12.1 | 7.9 | 39.0 | 46.3 |
| Nevada | 12.1 | 9.0 | 31.8 | 46.5 |
| Maine | 13.1 | 7.6 | 43.6 | 45.7 |
| Illinois | 13.1 | 7.8 | 48.4 | 48.0 |
| Michigan | 13.4 | 10.4 | 37.7 | 46.8 |
| Minnesota | 14.1 | 8.6 | 50.9 | 45.2 |
| Vermont | 14.3 | 8.0 | 43.9 | 45.5 |
| Rhode Island | 14.4 | 8.5 | 53.6 | 47.2 |
| California | 14.5 | 7.9 | 49.4 | 48.5 |
| Massachusetts | 14.6 | 7.7 | 59.2 | 48.2 |
| Oregon | 15.9 | 9.7 | 49.6 | 45.6 |
| Washington | 15.9 | 10.1 | 43.7 | 47.2 |
| New Jersey | 16.2 | 9.7 | 59.3 | 47.1 |
| Connecticut | 16.5 | 8.2 | 61.2 | 49.9 |
| Alaska | 17.6 | 9.1 | 43.3 | 44.0 |
| New York | 20.6 | 11.4 | 65.1 | 51.9 |
| Hawaii | 26.6 | 15.2 | 61.0 | 45.4 |
Method. Union membership rate: Hirsch & Macpherson's unionstats.com, CPS-ORG tabulation, Sector=="Total"/"Private"/"Public", Membership Rate column, 2024 (the most recent year on file), unionstats.com/state/xls/state_1983_2024.xlsx, downloaded live, no key. Gini index: Census ACS 1-year estimate, table B19083 ("Wage GINI"), 2024, re-served keyless through DataUSA's public Tesseract API (honolulu-api.datausa.io), which republishes the Census table verbatim rather than estimating it independently — the direct api.census.gov route 302s without a registered API key this box does not hold, and BLS's own published state union table (bls.gov/news.release/union2.t05.htm) returns an HTTP "Access Denied" bot-block on a plain fetch, not a 404; both substitutes are named here rather than silently swapped in. Merged on state name, both variables the identical year, n=51 (50 states + DC); Puerto Rico, present in the Gini cube but absent from the union table and not a state, is dropped by construction. OLS with classical and HC3-robust SE, Spearman rank correlation, a DC-exclusion check, a private/public sector split, and a 4,000-draw case-resample bootstrap.
Limits, stated plainly. This is one calendar year's cross-section, not the panel or event-study design the actual academic literature on unions and inequality uses (e.g., comparing within-state changes over time, or right-to-work law adoption as a natural experiment) — a single year can't separate "unions reduce inequality" from "states that happen to have high union density also happen to have other things going on" in either direction, and the real national-level decline-in-unions/rise-in-inequality story plays out over decades this snapshot cannot see. State Gini also bundles together wage inequality (what unions could plausibly touch) with capital income, self-employment income, and cost-of-living differences across very different state economies (Hawaii's tourism-and-public-sector economy is not Utah's), none of which this run controls for. unionstats.com's CPS-ORG tabulation is itself a sample estimate with its own margin of error at the state level, not a census.
union_gini_571.csv (51 states+DC: state, private/public/total union density %, Gini) · fit output (JSON).
