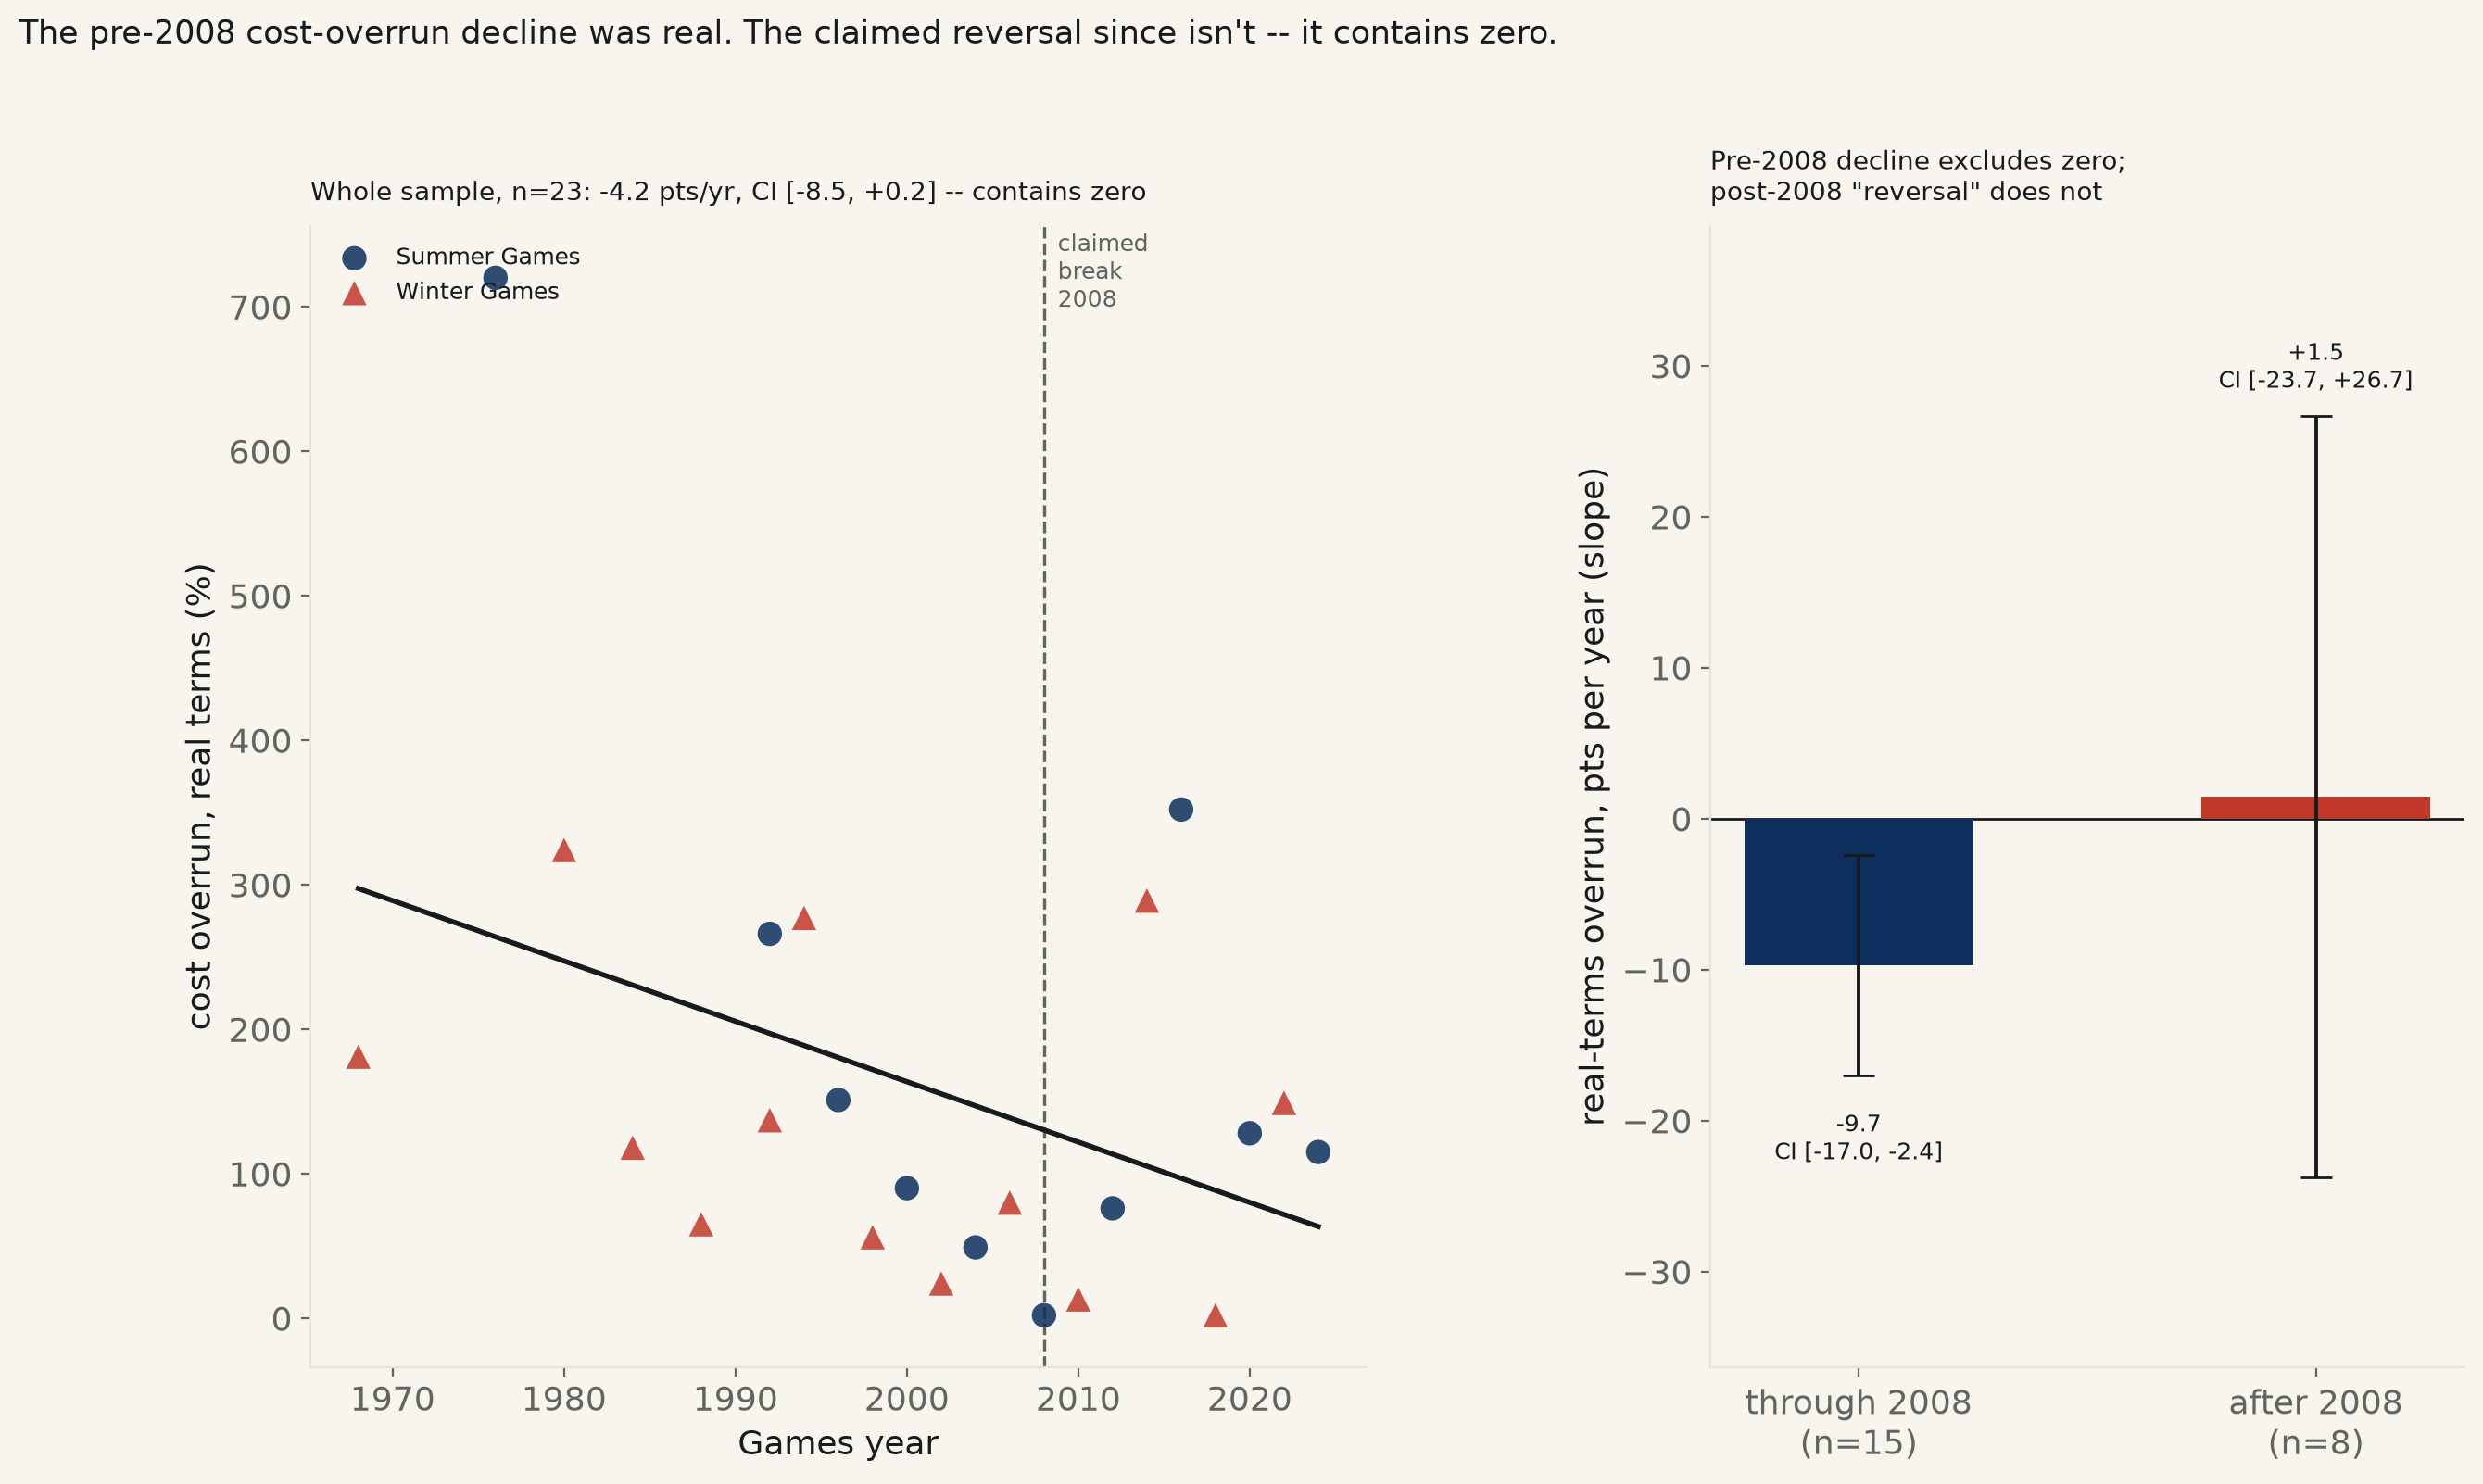
23 Olympic Games, 1968–2024, real-terms cost overrun (%), Table 4 of Budzier & Flyvbjerg's Oxford Olympics Study 2024, fetched and parsed live from the paper's own PDF. The abstract claims overruns fell until 2008, then rose. Through 2008: slope -9.7 pts/yr, 95% CI [-17.0, -2.4] — excludes zero. After 2008: slope +1.5 pts/yr, CI [-23.7, +26.7] — contains zero.
Backlog #114: does hosting the Olympics pay for itself? The famous half of that claim — that the Games reliably blow their budget — comes from Bent Flyvbjerg and Alexander Budzier's Oxford Olympics Study, now in its third edition. Its 2024 update (arXiv:2406.01714) makes a second, more specific claim in its own abstract: cost overruns, measured in real (inflation-adjusted) terms against the original bid budget, "were decreasing until 2008, but have increased since then" — a claim that the IOC's post-2008 reforms are, if anything, moving the Games the wrong way. That claim lives in the paper's own Table 4, the real-terms overrun for every Olympic Games 1960–2024 with a reported figure (23 of the 34 editions in that range; the rest have no overrun figure in the source table itself, mostly for lack of a reliable original budget). This run fetched that PDF live and parsed Table 4 programmatically, not from memory, then ran the honest version of the paper's own two-era claim: is there a real trend before 2008, a real trend after it, and can you tell the two slopes actually differ?
The first half of the claim holds. Through 2008 (n=15), real-terms overrun falls -9.7 points per Games-year, 95% CI [-17.0, -2.4], p=0.013 — excludes zero. Olympic budgeting really did get more accurate, Games after Games, for four decades.
The second half does not. After 2008 (n=8), the slope is +1.5 points per year, 95% CI [-23.7, +26.7], p=0.892 — contains zero, and comfortably: the interval spans from a steep decline to a steep rise. An interaction test asking the sharper question — not just whether either slice alone clears zero, but whether the slope itself is distinguishable between the two eras — also contains zero: +11.2 points/year of difference, 95% CI [-12.1, +34.4], p=0.346. Eight Games (Vancouver 2010 through Paris 2024) is not a lot of data to hang a reversal on, and this test cannot confirm one.
Even the whole-sample trend is closer to the line than the headline suggests. Fit across all 23 Games at once, ignoring the claimed break entirely: slope -4.2 points/year, 95% CI [-8.5, +0.2], p=0.059, R²=0.159 — the interval's upper edge sits +0.18 points above zero, and the p-value misses the standard 0.05 threshold. A Spearman rank check agrees it is not a strong relationship: ρ=-0.32, p=0.142. Controlling for Summer vs. Winter Games, in case one season's extremes were driving it, does not rescue it: slope -4.9, CI [-11.8, +2.0], p=0.167. The one spec that does clear zero cleanly is the nominal-terms version — the overrun numbers that actually make headlines, not adjusted for inflation: slope -10.5, CI [-19.9, -1.1], p=0.031. The source paper itself warns against reading nominal figures this way — "these are the figures that typically make the headlines... we stress, however, that nominal cost, unlike real cost, does not present a like-for-like comparison" — which is exactly the gap between a result a reader can trust and one that is easy to misquote.
Read plainly: the decades-long decline in Olympic cost overruns was real. The claimed post-2008 reversal, as tested here on the paper's own real-terms figures, is not established — it is indistinguishable from no trend at all. That is not the same as proving overruns have stopped rising; with n=8 since 2010, this test cannot rule much out either way. It means the specific claim, stated as fact in the abstract of the paper that supplies this dataset, does not survive being run as a regression with a confidence interval attached.
| Spec | n | Slope (pts/yr) | 95% CI | R² | p |
|---|---|---|---|---|---|
| Whole sample, naive | 23 | -4.18 | [-8.53, +0.18] | 0.159 | 0.059 |
| Whole sample, HC3-robust | 23 | -4.18 | [-10.34, +1.98] | 0.159 | 0.184 |
| Through 2008 | 15 | -9.70 | [-17.01, -2.39] | 0.387 | 0.013 |
| After 2008 | 8 | +1.46 | [-23.73, +26.66] | 0.003 | 0.892 |
| Season-controlled (Summer/Winter dummy) | 23 | -4.87 | [-11.78, +2.03] | — | 0.167 |
| Whole sample, nominal terms (not inflation-adjusted) | 23 | -10.50 | [-19.93, -1.08] | 0.204 | 0.031 |
| Games | Season | Nominal overrun | Real overrun |
|---|---|---|---|
| Grenoble 1968 | Winter | 230% | 181% |
| Montreal 1976 | Summer | 1266% | 720% |
| Lake Placid 1980 | Winter | 502% | 324% |
| Sarajevo 1984 | Winter | 1257% | 118% |
| Calgary 1988 | Winter | 131% | 65% |
| Barcelona 1992 | Summer | 609% | 266% |
| Albertville 1992 | Winter | 169% | 137% |
| Lillehammer 1994 | Winter | 347% | 277% |
| Atlanta 1996 | Summer | 178% | 151% |
| Nagano 1998 | Winter | 58% | 56% |
| Sydney 2000 | Summer | 108% | 90% |
| Salt Lake City 2002 | Winter | 40% | 24% |
| Athens 2004 | Summer | 97% | 49% |
| Torino 2006 | Winter | 113% | 80% |
| Beijing 2008 | Summer | 35% | 2% |
| Vancouver 2010 | Winter | 36% | 13% |
| London 2012 | Summer | 108% | 76% |
| Sochi 2014 | Winter | 508% | 289% |
| Rio 2016 | Summer | 673% | 352% |
| Pyeong Chang 2018 | Winter | 14% | 2% |
| Tokyo 2020 | Summer | 139% | 128% |
| Beijing 2022 | Winter | 190% | 149% |
| Paris 2024 | Summer | 146% | 115% |
Method. Source: Budzier & Flyvbjerg, "The Oxford Olympics Study 2024:
Are Cost and Cost Overrun at the Games Coming Down?" (arXiv:2406.01714, July 2024),
Table 4. This run fetched the PDF live and parsed the table's text programmatically
(not transcribed from memory); the parser hard-fails if it cannot find the table
header or does not recover exactly 23 rows with both a nominal and a
real-terms figure. 2008 is the break year the source paper itself
names in its abstract, not a year chosen by inspecting this data for the best split
— a deliberate difference from a data-determined turning-point test. All
regressions via statsmodels OLS; the whole-sample spec is also reported
with HC3-robust standard errors, and the interaction and season-controlled specs use
HC3 throughout.
Limits, stated plainly. n=23 is small, and the post-2008 slice is smaller still (n=8) — a wide confidence interval containing zero here means the test cannot rule out a real reversal, only that it cannot confirm one with this little data. The break year is fixed at 2008 by the source paper's own claim rather than derived from this data, which avoids picking the year that looks best but also means this run does not independently verify 2008 is the right place to split. This tests the time trend in reported cost overrun only — not the "pays for itself" half of the backlog's original question, whether hosting generates offsetting economic activity, which would need a second, host-economy GDP dataset not pulled today.
olympic_overruns_568.csv (23 Games: city, year, season, nominal overrun %, real overrun %) · fit output (JSON).
