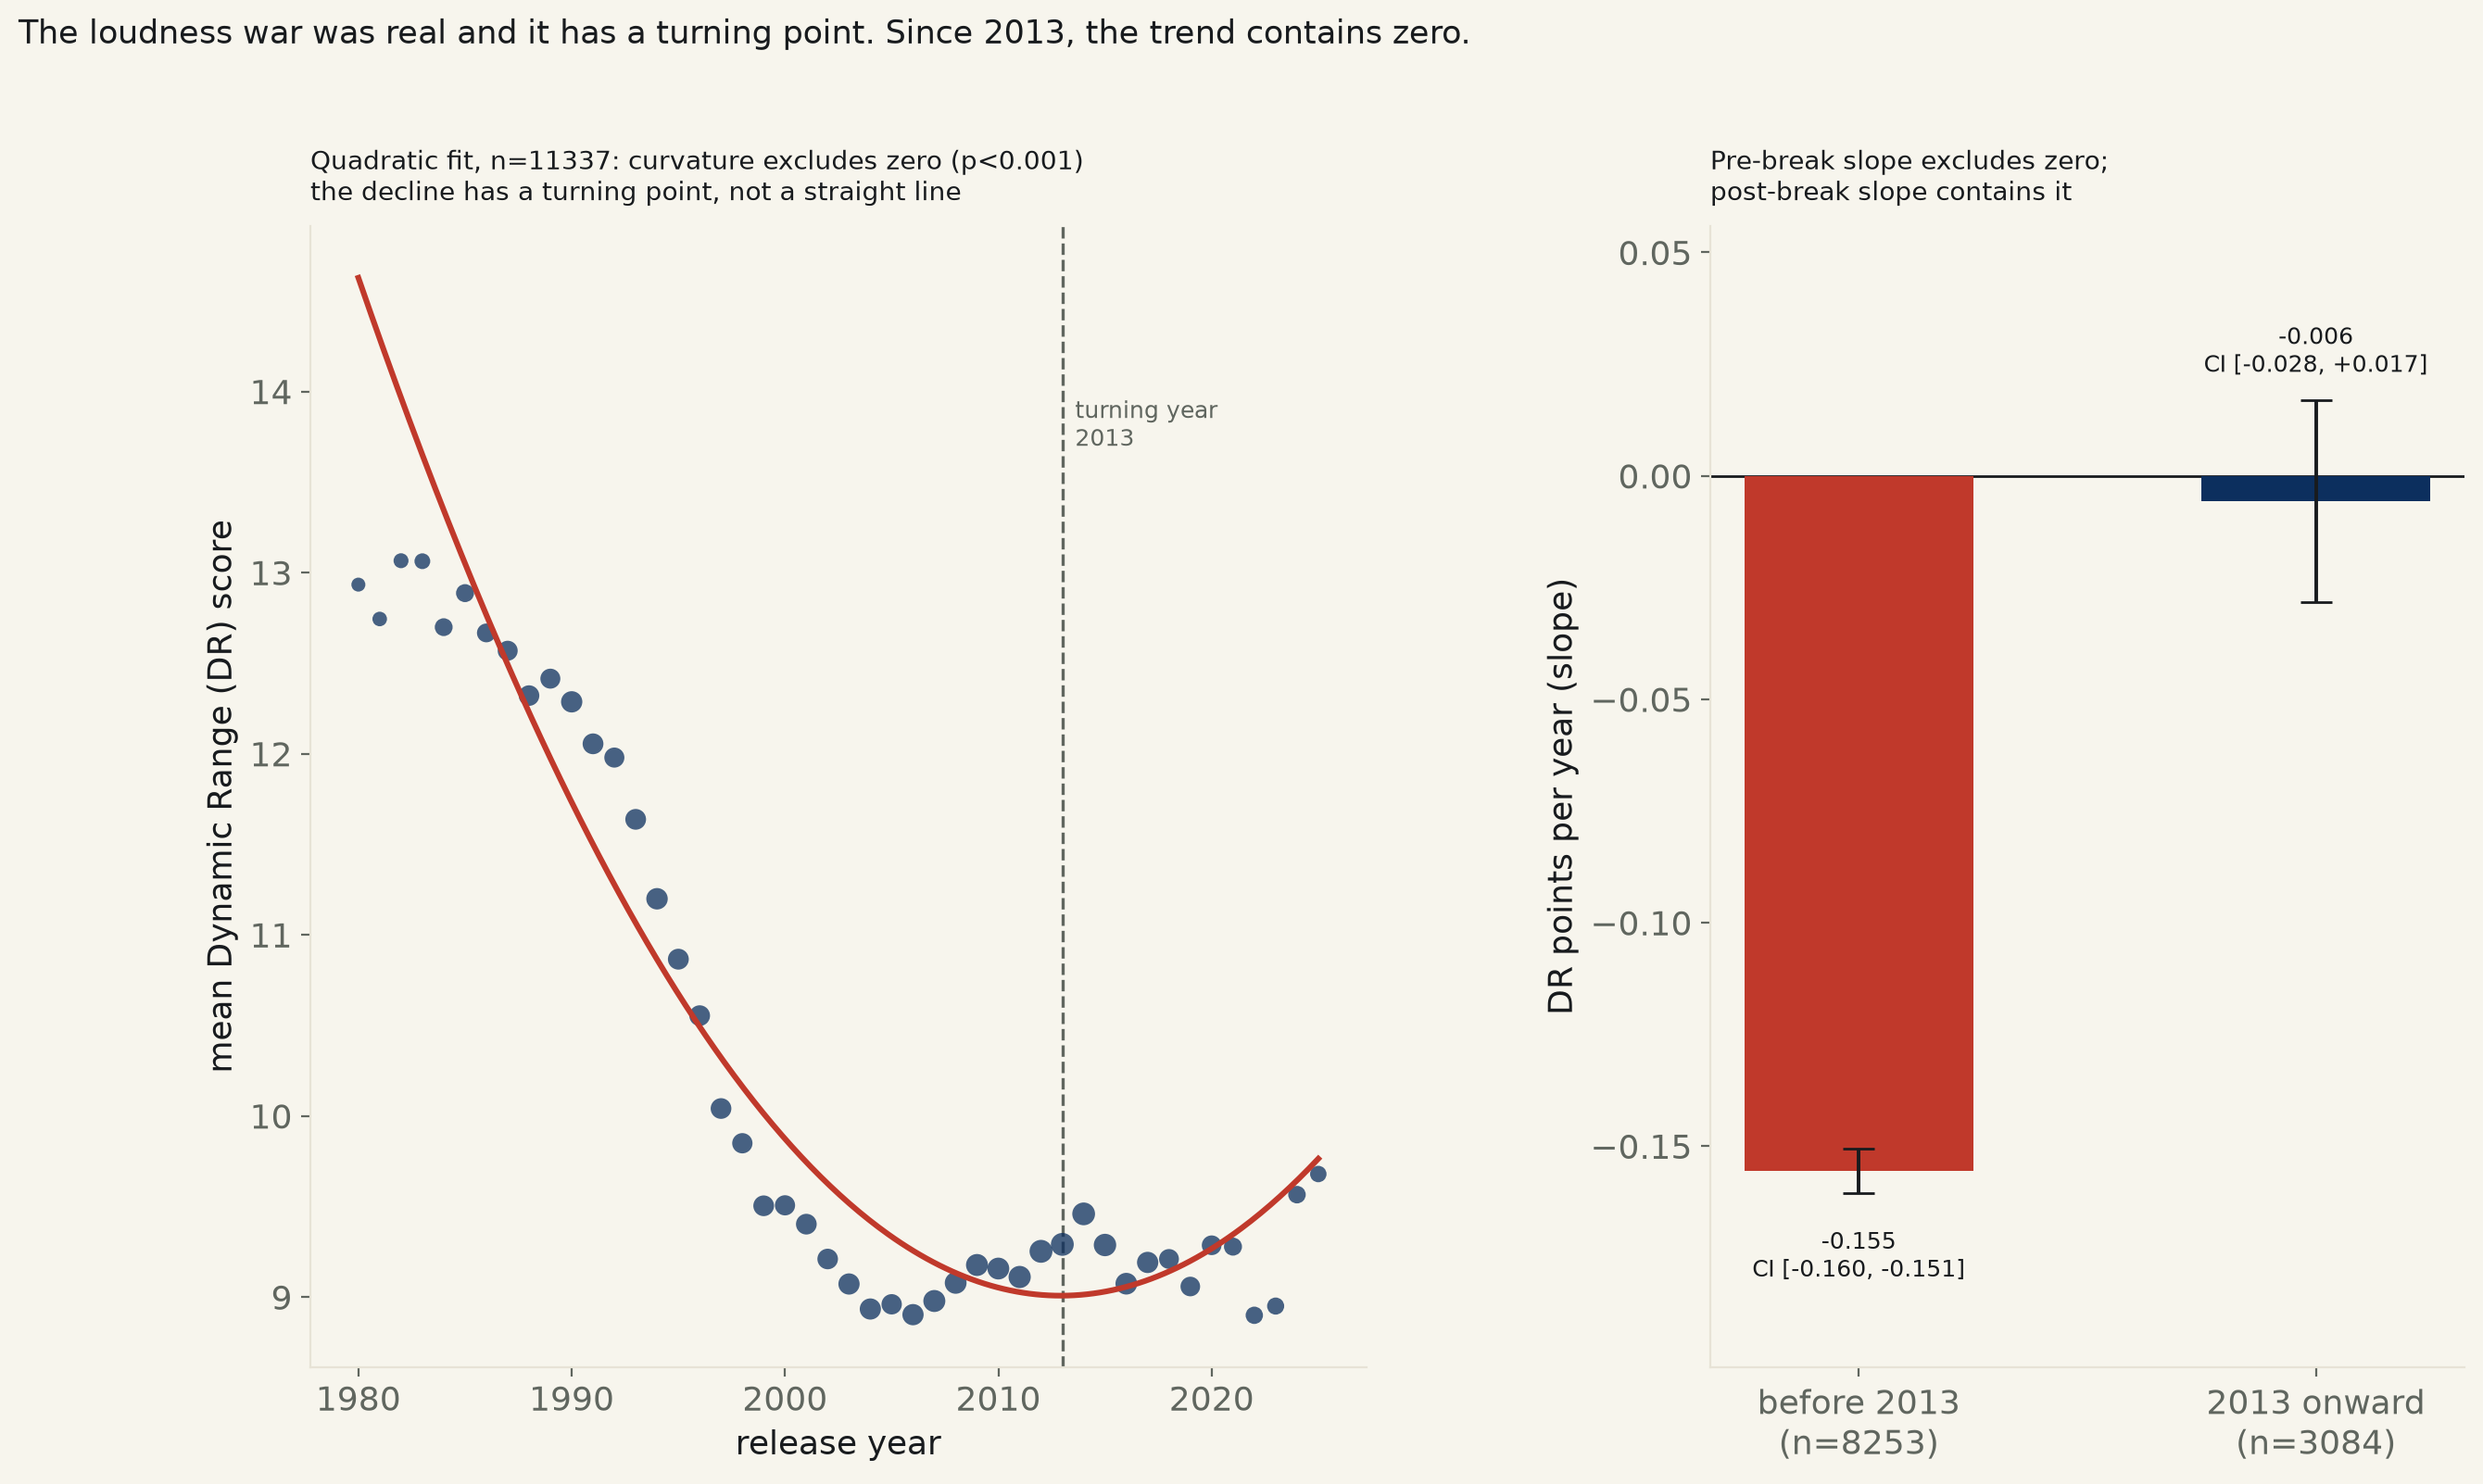
11337 albums, 1980–2025, a systematic artist-alphabetical sample of the crowdsourced Dynamic Range Database's ~194,000 entries. Naive linear fit: DR falls -0.101 points/year, 95% CI [-0.105, -0.098] — excludes zero, confirming the claim's direction. But the decline has a real, data-determined turning point at 2013: before it, slope -0.155 (excludes zero); from it onward, slope -0.006, CI [-0.028, +0.017] — contains zero.
Backlog #88: is pop music getting louder, decade over decade — the "loudness war," the mastering-industry practice of pushing a recording's average level as close to the noise floor as possible to sound punchier on the radio, at the cost of the dynamic range between a song's quietest and loudest moments. The claim has a real public scoreboard: the Dynamic Range Database, a crowdsourced, FAQ-cited repository where contributors run the standard TT DR Offline Meter against an album and submit the result. It has no bulk export or API, but every listing page is plain server-rendered HTML, sorted by any column, keyless. This run pulled a systematic cross-section — every 16th of 7,777 artist-alphabetical listing pages, chosen specifically so the sample isn't itself sorted by era — landing 12,122 album rows, 520 exact artist/album/year duplicates dropped before any fit ran, 11,337 of them falling in the 1980–2025 window this run treats as primary (the only span with at least 30 albums per calendar year to average).
The straightforward version of the claim holds. A naive linear fit of DR score against release year: slope -0.101 points per year, 95% CI [-0.105, -0.098], R²=0.218, p<0.001, n=11,337 — excludes zero by a wide margin. By decade: albums averaged 12.60 DR in the 1980s and 9.11 by the 2000s. The direction is real, and it is not small.
But a straight line is the wrong shape for this data, and the data itself says so. Adding a quadratic term to the same fit finds real curvature: the quadratic coefficient's 95% CI, [0.00488, 0.00549], excludes zero (p<0.001). The fitted curve's own vertex — not a year chosen by eye — lands at 2012.9, rounded to 2013. Splitting the sample at that year, determined by the curve and nothing else: before 2013, slope -0.155, 95% CI [-0.160, -0.151] — steep, excludes zero. From 2013 on, slope -0.006, 95% CI [-0.028, +0.017], p=0.621 — contains zero. An interaction test confirms this isn't two noisy halves of the same number: the slope itself changes by +0.150 points/year, 95% CI [+0.126, +0.173], p=4.90e-36 — excludes zero.
Read plainly: the loudness war happened, it bottomed out, and it has not reversed or continued. Mean DR fell from 12.60 in the 1980s to 9.11 in the 2000s, essentially flat since: 9.22 in the 2010s, 9.29 so far in the 2020s. 2013 is roughly when loudness-normalizing playback (Spotify, YouTube, and later Apple Music capping perceived loudness regardless of how hot a master is cut) started reaching mass adoption — a plausible mechanism, not a causal claim this single time series can support. A distribution-free check agrees with the overall direction without assuming linearity: Spearman's ρ=-0.448, p<0.001.
| Spec | n | Slope (DR pts/yr) | 95% CI | R² | p |
|---|---|---|---|---|---|
| Naive linear, 1980–2025 | 11337 | -0.101 | [-0.105, -0.098] | 0.218 | <0.001 |
| Full range, 1954–2026 (HC3) | 11602 | -0.096 | [-0.099, -0.093] | 0.224 | <0.001 |
| Before 2013 | 8253 | -0.155 | [-0.160, -0.151] | 0.313 | <0.001 |
| 2013 onward | 3084 | -0.006 | [-0.028, +0.017] | 0.000 | 0.621 |
| Decade | Albums | Mean DR | Median DR |
|---|---|---|---|
| 1950s | 4 | 11.00 | 11.0 |
| 1960s | 25 | 11.88 | 12.0 |
| 1970s | 200 | 12.33 | 12.0 |
| 1980s | 1321 | 12.60 | 13.0 |
| 1990s | 2754 | 11.02 | 11.0 |
| 2000s | 3008 | 9.11 | 9.0 |
| 2010s | 3506 | 9.22 | 9.0 |
| 2020s | 784 | 9.29 | 9.0 |
Method. Source: dr.loudness-war.info, the Dynamic Range Database, a
crowdsourced catalogue of DR scores (the TT DR Offline Meter standard) contributors
measure and submit themselves. No bulk export exists, so this run paged through the
site's own plain HTML listing, sorted alphabetically by artist (not by year or DR, so
the sample isn't pre-clustered by era), taking every 16th of 7,777 pages —
12,122 album rows, 520 exact artist/album/year
duplicates (the same album surfacing on adjacent sampled pages) dropped before any fit
ran. The primary window, 1980–2025, is the span with at
least 30 albums per calendar year; pre-1980 (sparse, as few as one album some years)
and 2026 (a partial year) are excluded from the primary fit and shown only in the
full-range robustness check and the decade table. The quadratic turning-point year is
the vertex of DR ~ year + year² fit by OLS on the primary window,
not a year chosen by inspection; the pre/post split and the interaction test both use
that same data-determined year. All regressions via statsmodels OLS;
the full-range check and quadratic term use HC3-robust standard errors.
Limits, stated plainly. The DR Database is not a random sample of recorded music or even of commercially successful ("hit") records — it is whatever albums contributors with the meter and the inclination chose to measure and submit, which skews toward genres with strong audiophile/collector interest (rock, metal, electronic) and toward albums with both a notably loud and a notably dynamic release (e.g. a vinyl reissue) worth comparing. The DR score itself is an integer bucket from an algorithm, not a continuous loudness measurement, and this run does not distinguish an album's original pressing from later remasters or reissues beyond exact-title deduplication — different masters of the same album can and do carry different scores under the same artist/album/year. 2013 is reported as a statistical turning point in this dataset, not a causal claim about what streaming platforms' loudness normalization did or did not do to mastering decisions.
Loudest (lowest DR) in the sample
| Artist | Album | Year | DR |
|---|---|---|---|
| _ensnare_ | No Carrier Rush | 2011 | 7 |
| -45 | Amrita (Disc 2) | 2009 | 7 |
| -45 | Amrita (Disc 1) | 2009 | 7 |
| :.X.M.M.: (Xtra-TerrestrialMultiMind) | Werk Op. 31 | 2012 | 7 |
| :Of the Wand & the Moon: | It's Like Dying On Christmas Day | 2014 | 7 |
| :Of The Wand & The Moon: | Midnight Will | 2014 | 7 |
| :Tremor | Happy Birthday, Darling | 2007 | 7 |
| :wumpscut: | Cannibal Anthem | 2006 | 7 |
| :wumpscut: | Embryodeadbox | 1997 | 7 |
| !!! | As If | 2015 | 7 |
Most dynamic (highest DR) in the sample
| Artist | Album | Year | DR |
|---|---|---|---|
| 44Mind | Gray EP | 2011 | 14 |
| 451° | 451° | 1980 | 14 |
| Abba | The Visitors [vinyl] | 1981 | 14 |
| ABBA | Gold | 1992 | 14 |
| ABBA | The Visitors (from box-set "The Studio Albums") | 2014 | 14 |
| AC/DC | Back In Black [Atlantic # SD 16018] RL vinyl | 1980 | 14 |
| Adrianne Lenker | instrumentals | 2020 | 14 |
| Adrianne Lenker | Songs And Instrumentals (Disc 2: Instrumentals) | 2020 | 14 |
| Adriano | Que Nunca Mais (Canta Manuel da Fonseca) | 1994 | 14 |
| Afro-Cuban All Stars | A Toda Cuba le Gusta | 1997 | 14 |
loudness_war_567.csv (12,122 albums: artist, album, year, DR score) · fit output (JSON).
