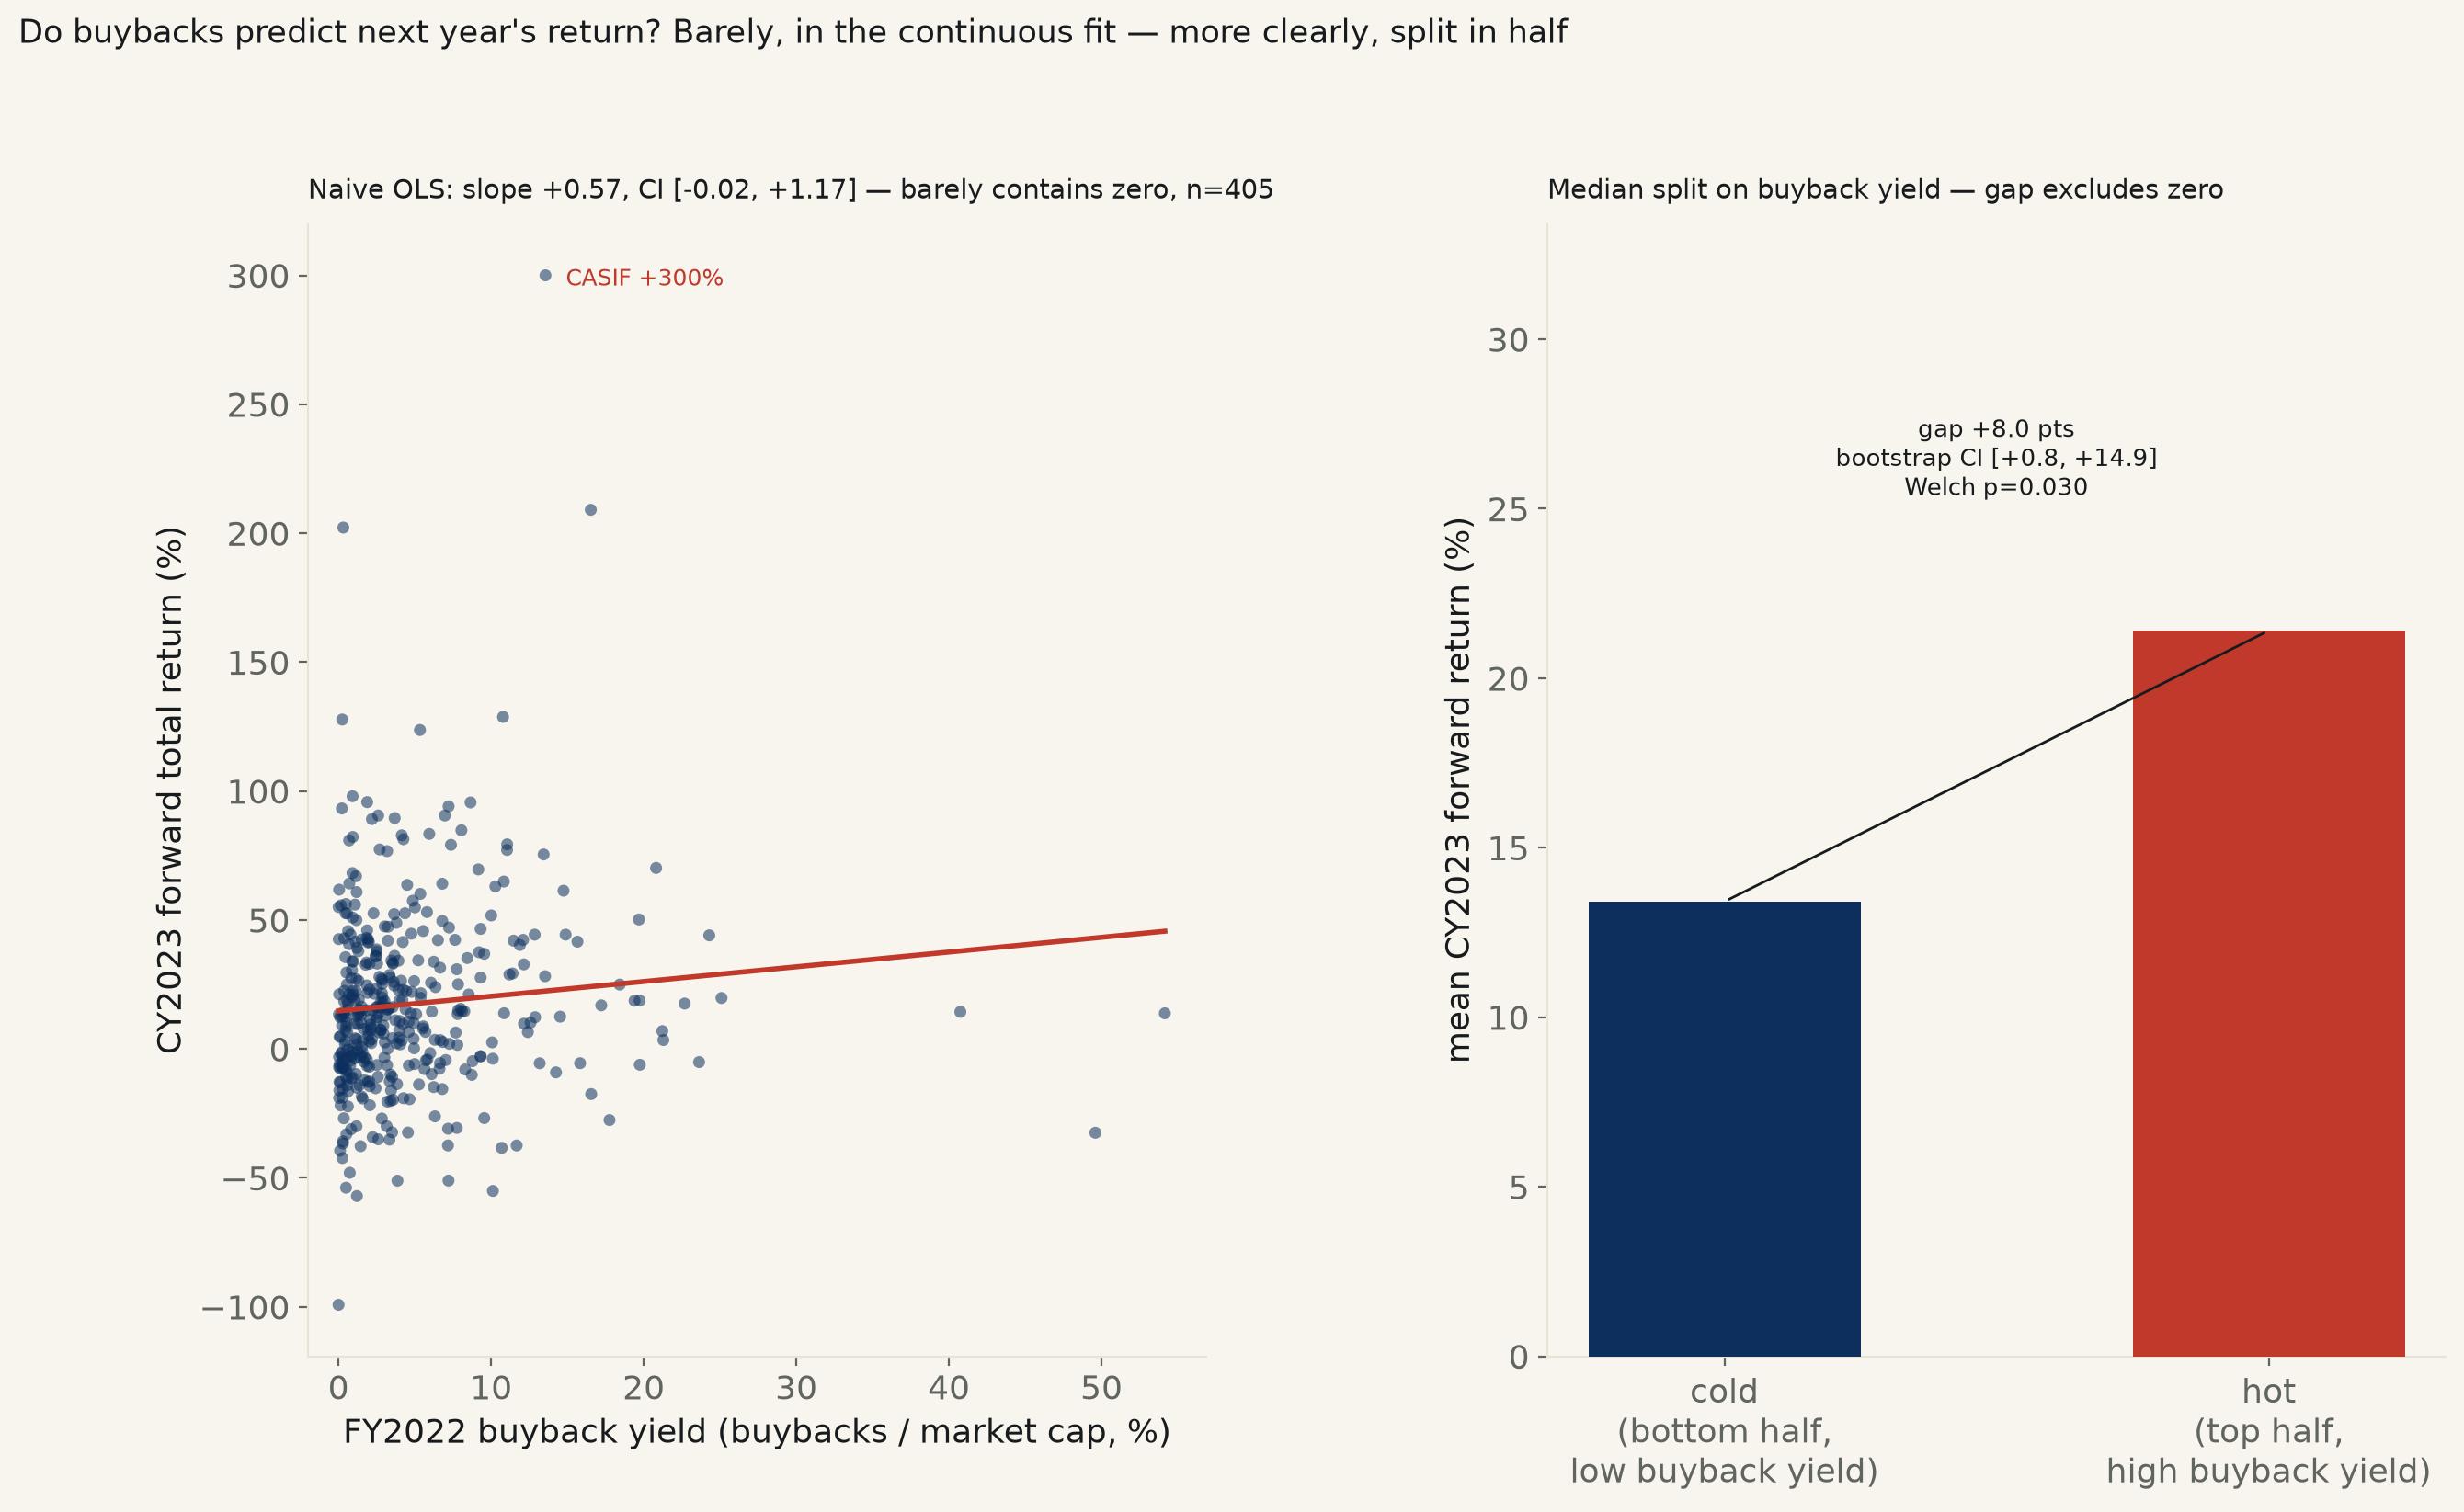
405 US-listed operating companies, SEC's own XBRL buyback and shares-outstanding disclosures for FY2022, joined to yfinance's CY2023 forward returns. Naive OLS: slope +0.57, 95% CI [-0.02, +1.17], p=0.059 — barely contains zero, and the near-miss turns out to be one stock. Split the same companies into heavy vs. light buybackers at the median instead: a +8.0-point gap, bootstrap CI [+0.8, +14.9] — excludes zero, though it doesn't survive controlling for company size.
Backlog #20: do buybacks boost returns? Share buybacks get pitched by executives as
capital discipline — returning excess cash to shareholders at a price management
believes undervalues the stock — and attacked by critics as financial engineering
that inflates per-share metrics without creating anything. Both stories make the same
testable prediction: a company spending more of its own market cap buying back stock
should, on average, go on to do better. This run pulls the SEC's own structured
disclosure of cash actually spent on buybacks (us-gaap:PaymentsForRepurchaseOfCommonStock)
for every company that reported a clean full-calendar-year 2022 figure, divides by each
company's market cap at the end of 2022 (SEC-reported shares outstanding × year-end
price), and regresses that buyback yield against the stock's CY2023 forward total return
— 405 real companies, common stock only, funds and trusts excluded.
The straightforward regression almost clears this desk's bar, and then doesn't once you look at what's driving it. Naive OLS: slope +0.57, 95% CI [-0.02, +1.17], p=0.059 — technically still contains zero, and barely. Drop just the single most extreme forward return in the sample — CASI Pharmaceuticals, +300%, a penny stock — and the fit falls apart: slope +0.41, CI [-0.15, +0.96], p=0.15. An HC3-robust standard error, which doesn't pretend the variance is uniform across the sample, agrees from the start: CI [-0.26, +1.40], p=0.18. The naive near-miss is one stock's arithmetic, not a relationship.
A measure that doesn't care how extreme the biggest winners are tells a different, smaller story. Spearman's rank correlation — does higher buyback yield simply track with a higher-ranked forward return, regardless of magnitude — comes back ρ=0.153, p=0.0020, and barely moves after dropping the same three most extreme returns one at a time (ρ stays between 0.142 and 0.153, p never rises above 0.0044). There is a real, if weak, monotonic ordering here that a straight line fitted to a right-skewed, outlier-prone return distribution is the wrong tool to see cleanly.
Splitting the same 405 companies at the median buyback yield into heavy vs. light buybackers makes the rank-based signal concrete. The 203 heaviest buybackers averaged +21.4% the following year; the 202 lightest averaged +13.4% — a gap of +8.0 points, Welch's p=0.030, and a 4,000-draw bootstrap on the gap returns 95% CI [+0.8, +14.9] — excludes zero. That gap is noisier than the bootstrap CI alone suggests: dropping the same one, two, or three most extreme returns moves the gap between +5.2 and +8.0 points and its Welch p-value between 0.030 and 0.111 — crossing back above 0.05 when the second-most-extreme point is removed. Reported as a real but fragile split, not a precision estimate.
The one check built specifically to catch a confound says the relationship, weak as it already was, does not survive it. Smaller, cheaper-looking companies both buy back more of their own stock (as a share of market cap) and were exactly the part of the market that led the 2023 rebound. Controlling for company size (log market cap) alongside buyback yield: the buyback-yield slope drops to +0.51, CI [-0.29, +1.31], p=0.21 — contains zero. A log(1+return) transform, which shrinks exactly the right tail driving the naive near-miss, agrees: CI [-0.22, +1.23].
| Fit: fwd return ~ buyback yield | slope | 95% CI | R² | p | |
|---|---|---|---|---|---|
| Naive OLS | +0.571 | [-0.023, +1.166] | 0.009 | p=0.059 | n=405 |
| HC3-robust SE | +0.571 | [-0.255, +1.398] | 0.009 | p=0.175 | n=405 |
| Winsorized 1st/99th pct. | +0.411 | [-0.113, +0.935] | 0.006 | p=0.124 | n=405 |
| Size-controlled (+ log market cap) | +0.509 | [-0.287, +1.306] | 0.021 | p=0.210 | n=405 |
| log(1+return), HC3-robust | +0.506 | [-0.218, +1.230] | 0.007 | p=0.171 | n=405 |
| Most extreme returns dropped | OLS slope | OLS 95% CI | OLS p | Spearman ρ | Spearman p | |
|---|---|---|---|---|---|---|
| 0 | n=405 | +0.571 | [-0.023, +1.166] | 0.059 | 0.153 | 0.0020 |
| 1 | n=404 | +0.406 | [-0.147, +0.959] | 0.150 | 0.147 | 0.0030 |
| 2 | n=403 | +0.255 | [-0.280, +0.790] | 0.349 | 0.142 | 0.0044 |
| 3 | n=402 | +0.311 | [-0.203, +0.825] | 0.235 | 0.149 | 0.0028 |
Method. Buyback figures: SEC XBRL frames API,
us-gaap:PaymentsForRepurchaseOfCommonStock, every company reporting a
clean full-calendar-year (2022-01-01 to 2022-12-31) positive figure. Shares outstanding:
the same API's dei:EntityCommonStockSharesOutstanding instant closest to
2022-12-31 (within 120 days). Tickers: SEC's own company_tickers.json,
restricted to each CIK's common-stock ticker (hyphenated preferred/unit-class tickers
excluded after an early pass of this run mistakenly matched several companies to a
preferred share class sharing the same CIK — e.g. initially pricing Goldman
Sachs's buyback yield off its Series D preferred stock instead of GS common —
caught and fixed before any fit ran). Companies whose SEC entity name contained FUND,
TRUST, or ETF were dropped (two Invesco commodity ETFs filed a matching XBRL tag
despite not being operating companies). Market cap = shares outstanding × the
last 2022 trading-day close; forward return = CY2023 adjusted-close return, last 2022
trading day to last 2023 trading day, requiring at least 300 days between them.
405 companies survive every filter with a priceable yfinance history on both
ends. All regressions via statsmodels OLS; robust variants use HC3;
bootstrap and Spearman via scipy, 4,000 resamples.
Limits, stated plainly. One fiscal year of buybacks against one forward year of returns — not a multi-year panel, so this cannot separate a persistent buyback-and-return relationship from a 2022-2023-specific pattern (2023's rally was led by a narrow set of mega-cap growth stocks that are not typically heavy relative buybackers, which cuts against this run's own weak positive finding, not for it). Buyback yield is gross spending, not netted against new shares issued for stock compensation, so it can overstate a company's actual net reduction in share count. Sample is companies still priceable by yfinance at both endpoints — any company that went private, was acquired, or delisted entirely between the two dates is mechanically excluded, a real survivorship filter this design cannot correct for. No causal claim is made anywhere on this page: buyback yield correlates with company size, valuation, and sector, and the size-controlled spec shows at least one of those confounds removes what naive signal there was.
Highest buyback yield (15 of 405)
| Ticker | Company | FY2022 buyback yield | CY2023 fwd return |
|---|---|---|---|
| CAR | AVIS BUDGET GROUP, INC. | 54.2% | +13.8% |
| HTZ | HERTZ GLOBAL HOLDINGS, INC | 49.6% | -32.5% |
| HESM | Hess Midstream LP | 40.8% | +14.4% |
| SYF | SYNCHRONY FINANCIAL | 25.1% | +19.8% |
| DOCN | DigitalOcean Holdings, Inc. | 24.3% | +44.1% |
| HUN | Huntsman Corporation | 23.6% | -5.1% |
| NAVI | Navient Corporation | 22.7% | +17.6% |
| OLN | OLIN CORPORATION | 21.3% | +3.5% |
| LAZ | LAZARD, INC. | 21.2% | +6.9% |
| GPI | Group 1 Automotive, Inc | 20.8% | +70.2% |
| JBGS | JBG SMITH PROPERTIES | 19.7% | -6.1% |
| CNX | CNX Resources Corporation | 19.7% | +18.8% |
| LAUR | Laureate Education, Inc. | 19.7% | +50.2% |
| SLM | SLM Corp | 19.4% | +18.7% |
| LOPE | GRAND CANYON EDUCATION, INC. | 18.4% | +25.0% |
Best / worst forward returns (10 each of 405)
| Ticker | Company | FY2022 buyback yield | CY2023 fwd return |
|---|---|---|---|
| CASIF | CASI PHARMACEUTICALS, INC. | 13.6% | +300.0% |
| UPST | Upstart Holdings, Inc. | 16.5% | +209.1% |
| IMMX | IMMIX BIOPHARMA, INC. | 0.3% | +202.2% |
| PHM | PULTEGROUP INC/MI/ | 10.8% | +128.8% |
| YRD | Yiren Digital Ltd. | 0.2% | +127.7% |
| IDCC | INTERDIGITAL, INC. | 5.3% | +123.7% |
| VKTX | Viking Therapeutics, Inc. | 0.9% | +98.0% |
| GE | GENERAL ELECTRIC COMPANY | 1.9% | +95.7% |
| TREX | Trex Company, Inc. | 8.7% | +95.6% |
| ANET | ARISTA NETWORKS, INC. | 7.2% | +94.1% |
| EVFM | EVOFEM BIOSCIENCES, INC. | 0.0% | -99.2% |
| SILC | SILICOM LTD. | 1.2% | -57.1% |
| CHGG | CHEGG, INC. | 10.1% | -55.0% |
| EAF | GRAFTECH INTERNATIONAL LTD. | 0.5% | -53.8% |
| NUS | NU SKIN ENTERPRISES, INC. | 3.9% | -51.1% |
| DHX | DHI Group, Inc. | 7.2% | -51.0% |
| FMC | FMC CORPORATION | 0.7% | -48.0% |
| KDOZF | KIDOZ Inc. | 0.3% | -42.3% |
| FHN | FIRST HORIZON CORP | 0.1% | -39.4% |
| MED | Medifast, Inc. | 10.7% | -38.3% |
buyback_yield_566.csv (405 companies: ticker, name, FY2022 buyback $, shares outstanding, year-end prices, market cap, buyback yield, CY2023 forward return) · fit output (JSON).
us-gaap:PaymentsForRepurchaseOfCommonStock,
dei:EntityCommonStockSharesOutstanding), fetched live, keyless ·
SEC CIK-ticker map ·
Yahoo Finance via yfinance, adjusted daily close prices.
