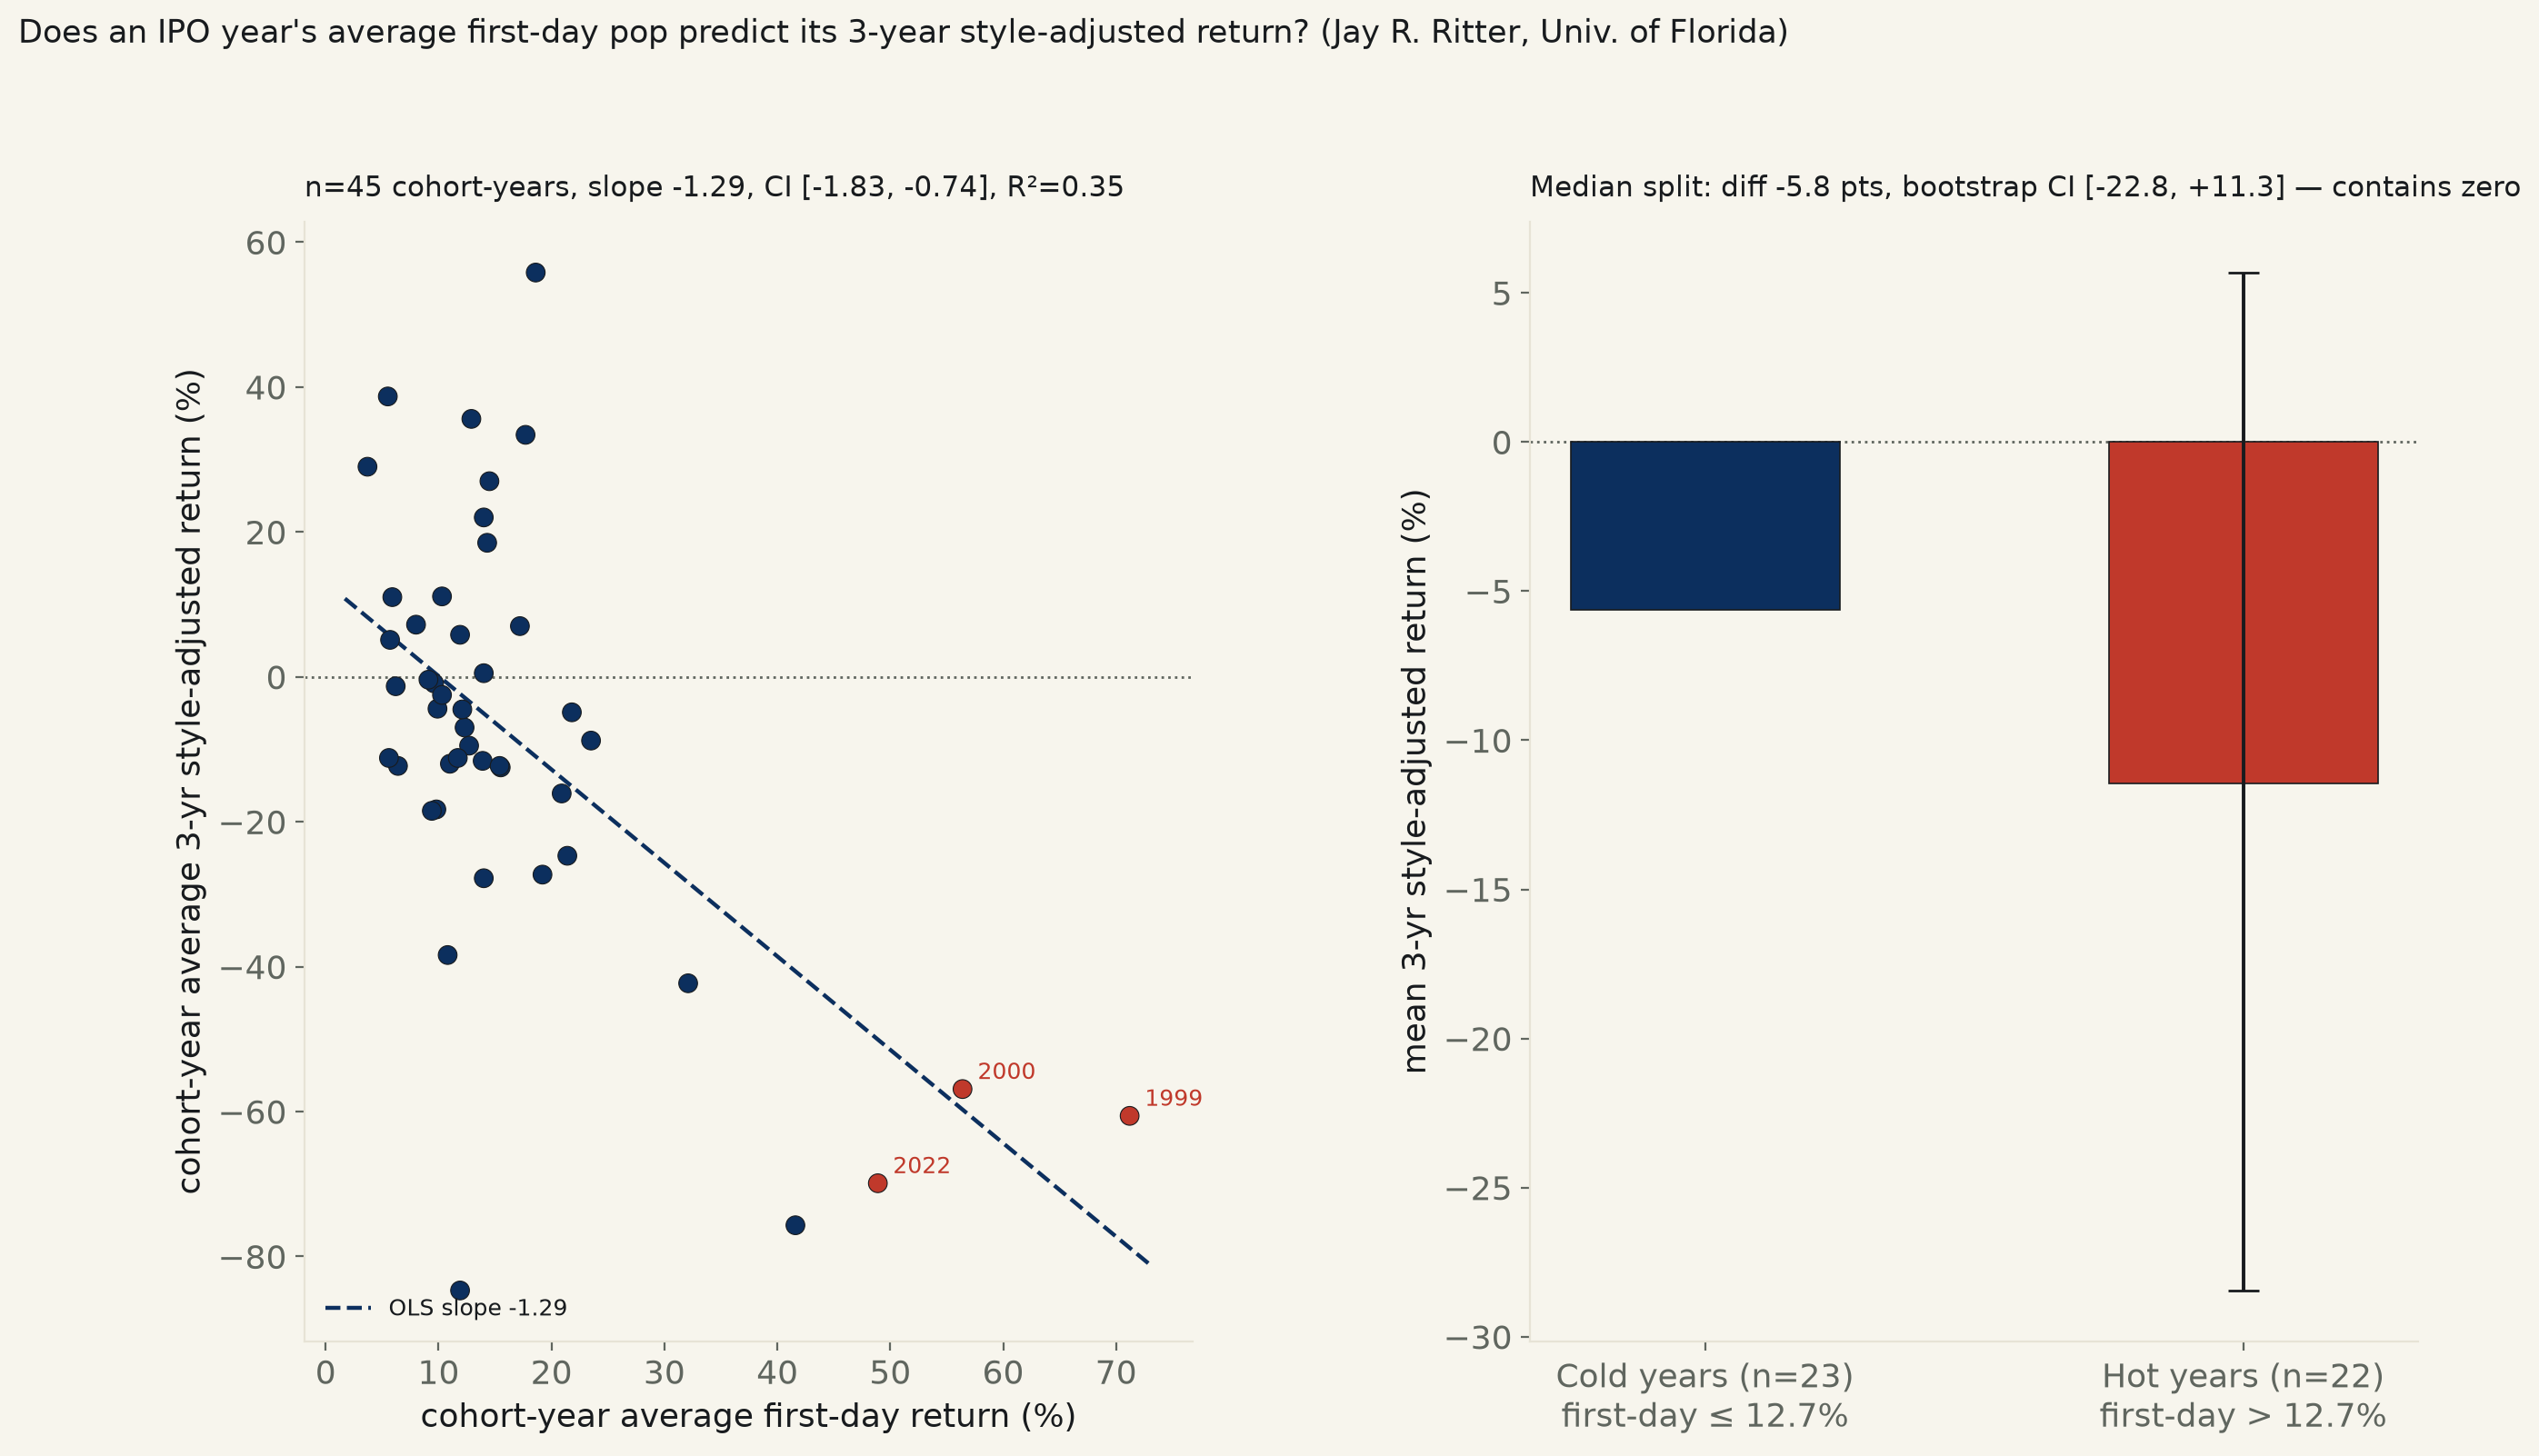
45 IPO cohort-years, 1980–2024 (9253 IPOs total), fetched live from Ritter's own published tables. Across all 45 years, each year's average first-day return predicts that year's average 3-year style-adjusted return: slope -1.29, 95% CI [-1.83, -0.74], R²=0.35 — excludes zero, survives dropping the dot-com bubble years. Split the same years into hot vs. cold halves at the median instead — the backlog's own two-population framing — and the gap no longer clears zero: -5.8 points, bootstrap CI [-22.8, +11.3].
"IPOs that pop on day one underperform afterward" is one of the oldest claims in market-structure folklore, usually told as a morality tale about hype outrunning fundamentals. Jay Ritter (University of Florida) has published the actual arithmetic behind that story for decades: year by year since 1980, the average first-day return every IPO cohort got, and the average 3-year buy-and-hold return that same cohort went on to deliver, measured three ways — the raw IPO return, the return against the overall market, and the return against a matched non-IPO firm of similar size and book-to-market ratio (the cleanest "compared to what" baseline). This run fetches his live tables and fits the regression the folklore implies, honestly, at the only granularity his public data supports: the cohort-year, not the individual firm.
The continuous regression says yes, clearly. Across all 45 cohort-years, 1980–2024, a year's average first-day return predicts that year's average 3-year style-adjusted return with slope -1.29 — every extra point of first-day pop comes with 1.29 points less style-adjusted return three years out — 95% CI [-1.83, -0.74], R²=0.35, p<0.001. It isn't an artifact of which long-run yardstick is used: the raw IPO return (slope -1.59, CI [-2.28, -0.91]) and the market-adjusted return (slope -0.84, CI [-1.47, -0.20]) both point the same way and both exclude zero. And it isn't just the dot-com bubble doing the work: drop 1999 and 2000 — the two most extreme pop-years in the sample, average first-day returns of 71.2% and 56.4% — and the fit gets tighter, not weaker: slope -1.63, CI [-2.49, -0.78], R²=0.27, n=43.
The backlog's own framing for this question was a two-population split, and that version of the test does not clear zero. Median-splitting the same 45 years at 12.7% average first-day return into "hot" (22 years) and "cold" (23 years) halves: hot years average -11.4% style-adjusted 3-year return, cold years -5.6% — a gap of -5.8 points in the predicted direction, but Welch's t-test gives p=0.52, and a 10,000-draw bootstrap on the gap returns 95% CI [-22.8, +11.3] — comfortably contains zero. These two results are not in conflict; they are describing different shapes in the same data. The continuous relationship is real, but it is not "every hot year beats every cold year by some margin" — it is a small number of truly extreme years (1999, 2000, and 2022's SPAC/meme-stock hangover cohort, the three points furthest right on the chart) pulling a line through a cloud of years that otherwise show no clean separation. A median split throws away exactly the information — how extreme the pop was — that the continuous fit is actually using.
One more pattern holds regardless of any of this. IPO cohort-years underperform their own size- and book-to-market-matched peers in 30 of 45 years (66.7%) — the well-documented "new issues puzzle" from the finance literature, visible here as a simple count, independent of whether that year's IPOs popped hard or barely moved on day one.
| Fit: y ~ avg first-day return | slope | 95% CI | R² | p | |
|---|---|---|---|---|---|
| 3-yr style-adjusted return (main) | -1.29 | [-1.83, -0.74] | 0.35 | p<0.001 | n=45 |
| 3-yr market-adjusted return | -0.84 | [-1.47, -0.20] | 0.14 | p=0.011 | n=45 |
| 3-yr raw IPO return (no adjustment) | -1.59 | [-2.28, -0.91] | 0.34 | p<0.001 | n=45 |
| 3-yr style-adjusted, dropping 1999–2000 | -1.63 | [-2.49, -0.78] | 0.27 | p<0.001 | n=43 |
Method. Source: Jay R. Ritter's (University of Florida) live
IPO Data page, Table 19
(the updated version of Table I from Ritter & Welch, "A Review of IPO Activity,
Pricing, and Allocations," Journal of Finance, 2002), fetched and parsed live at
run time (fetch_iporeturns_565.py downloads the PDF, runs
pdftotext -layout, and regex-parses every 1980–2024 row — nothing
hand-transcribed). Each row is Ritter's own equally-weighted average across every
qualifying U.S. IPO that cohort-year (penny stocks, unit offers, small best-efforts
deals, ADRs, REITs, closed-end funds, banks/S&Ls, and IPOs not CRSP-listed within six
months are excluded by his own screen). "3-year buy-and-hold return" runs from the first
CRSP-listed closing price (i.e., first-day return is the starting line, not part of the
measured return) to the earlier of the 3-year anniversary, delisting, or Dec 31, 2025.
Style-adjusted return subtracts the return on a matched non-IPO firm (closest market cap
and book-to-market, ≥5 years CRSP-listed). All regressions are OLS
(scipy.stats.linregress) on the 45 cohort-year averages, 95% CI via
the t-distribution. The hot/cold split is a median split on average first-day return
(12.7%); the group comparison uses Welch's t-test
(unequal variance) plus an independent 10,000-draw percentile bootstrap, resampling each
group separately, as a check that doesn't assume normality.
Limits, stated plainly. This is a cohort-year regression, n=45, not a firm-level one — Ritter's public tables report year averages, not a downloadable firm-by-firm panel (that requires a CRSP/WRDS subscription this desk doesn't have), so this run cannot say whether buying one specific hot IPO predicts that firm's own underperformance, only how an entire year's cohort average relates to that same cohort's average outcome. Nothing here is causal: a hot first-day market could mean IPOs were priced too optimistically that year (the standard story), or it could mean something about macro conditions at issuance that independently predicts weaker conditions three years later — this run cannot distinguish those. By Ritter's own caption, the 3-year window is right-censored at Dec 31, 2025, so the 2023 and 2024 cohorts' "3-year" figures are actually shorter, partial windows; restricting the main fit to 1980–2022 instead tightens the result slightly: slope −1.34, CI [−1.82, −0.86], R²=0.44, n=43 — the conclusion does not depend on the two truncated years. The continuous fit's R²=0.35 means the vast majority of year-to-year variation in long-run returns is explained by something other than that year's first-day pop.
| Year | # IPOs | Avg 1st-day return | Avg 3-yr return, raw | Avg 3-yr return, mkt-adj | Avg 3-yr return, style-adj |
|---|---|---|---|---|---|
| 1980 | 71 | +14.3% | +89.8% | +37.0% | +18.5% |
| 1981 | 192 | +5.9% | +12.3% | -27.0% | +11.0% |
| 1982 | 77 | +11.0% | +37.5% | -31.5% | -12.0% |
| 1983 | 451 | +9.9% | +15.9% | -37.7% | -4.4% |
| 1984 | 171 | +3.7% | +50.2% | -28.5% | +29.0% |
| 1985 | 186 | +6.4% | +5.6% | -41.3% | -12.3% |
| 1986 | 393 | +6.2% | +16.9% | -22.6% | -1.3% |
| 1987 | 285 | +5.6% | -2.6% | -19.1% | -11.2% |
| 1988 | 105 | +5.5% | +58.0% | +9.7% | +38.7% |
| 1989 | 116 | +8.0% | +48.1% | +13.2% | +7.2% |
| 1990 | 110 | +10.8% | +9.7% | -35.9% | -38.4% |
| 1991 | 286 | +11.9% | +31.2% | -1.8% | +5.8% |
| 1992 | 412 | +10.3% | +37.4% | -0.2% | +11.1% |
| 1993 | 510 | +12.7% | +44.1% | -8.7% | -9.5% |
| 1994 | 402 | +9.6% | +78.0% | -5.7% | -0.9% |
| 1995 | 462 | +21.4% | +28.6% | -58.0% | -24.7% |
| 1996 | 677 | +17.2% | +25.2% | -56.8% | +7.0% |
| 1997 | 474 | +14.0% | +58.3% | -2.0% | +22.0% |
| 1998 | 283 | +21.8% | +22.9% | +5.1% | -4.9% |
| 1999 | 476 | +71.2% | -47.6% | -32.5% | -60.6% |
| 2000 | 380 | +56.4% | -60.1% | -30.9% | -56.9% |
| 2001 | 80 | +14.0% | +18.0% | +14.6% | -27.8% |
| 2002 | 66 | +9.1% | +68.6% | +39.0% | -0.4% |
| 2003 | 63 | +11.7% | +34.0% | -7.7% | -11.2% |
| 2004 | 173 | +12.3% | +51.4% | +6.9% | -7.0% |
| 2005 | 159 | +10.3% | +14.6% | +3.1% | -2.5% |
| 2006 | 157 | +12.1% | -28.8% | -11.1% | -4.5% |
| 2007 | 159 | +14.0% | -16.5% | -0.4% | +0.5% |
| 2008 | 21 | +5.7% | +11.4% | +8.1% | +5.1% |
| 2009 | 41 | +9.8% | +37.0% | -5.1% | -18.3% |
| 2010 | 91 | +9.4% | +36.4% | -9.6% | -18.5% |
| 2011 | 81 | +13.9% | +38.6% | -8.7% | -11.6% |
| 2012 | 93 | +17.7% | +81.9% | +31.8% | +33.4% |
| 2013 | 158 | +20.9% | +12.1% | -14.4% | -16.1% |
| 2014 | 206 | +15.5% | +17.1% | -9.7% | -12.5% |
| 2015 | 118 | +19.2% | +24.5% | -9.9% | -27.3% |
| 2016 | 75 | +14.5% | +70.5% | +29.5% | +27.0% |
| 2017 | 106 | +12.9% | +52.8% | +22.6% | +35.6% |
| 2018 | 134 | +18.6% | +79.1% | +23.4% | +55.8% |
| 2019 | 113 | +23.5% | +12.5% | -25.1% | -8.8% |
| 2020 | 165 | +41.6% | -48.1% | -78.6% | -75.7% |
| 2021 | 311 | +32.1% | -49.1% | -68.6% | -42.3% |
| 2022 | 38 | +48.9% | -29.5% | -72.2% | -69.9% |
| 2023 | 54 | +11.9% | -30.9% | -88.3% | -84.7% |
| 2024 | 72 | +15.4% | -4.7% | -33.2% | -12.3% |
iporeturns_565.csv (year, # IPOs, avg first-day return, avg 3-yr return raw/market-adjusted/style-adjusted) · fit output (JSON).
