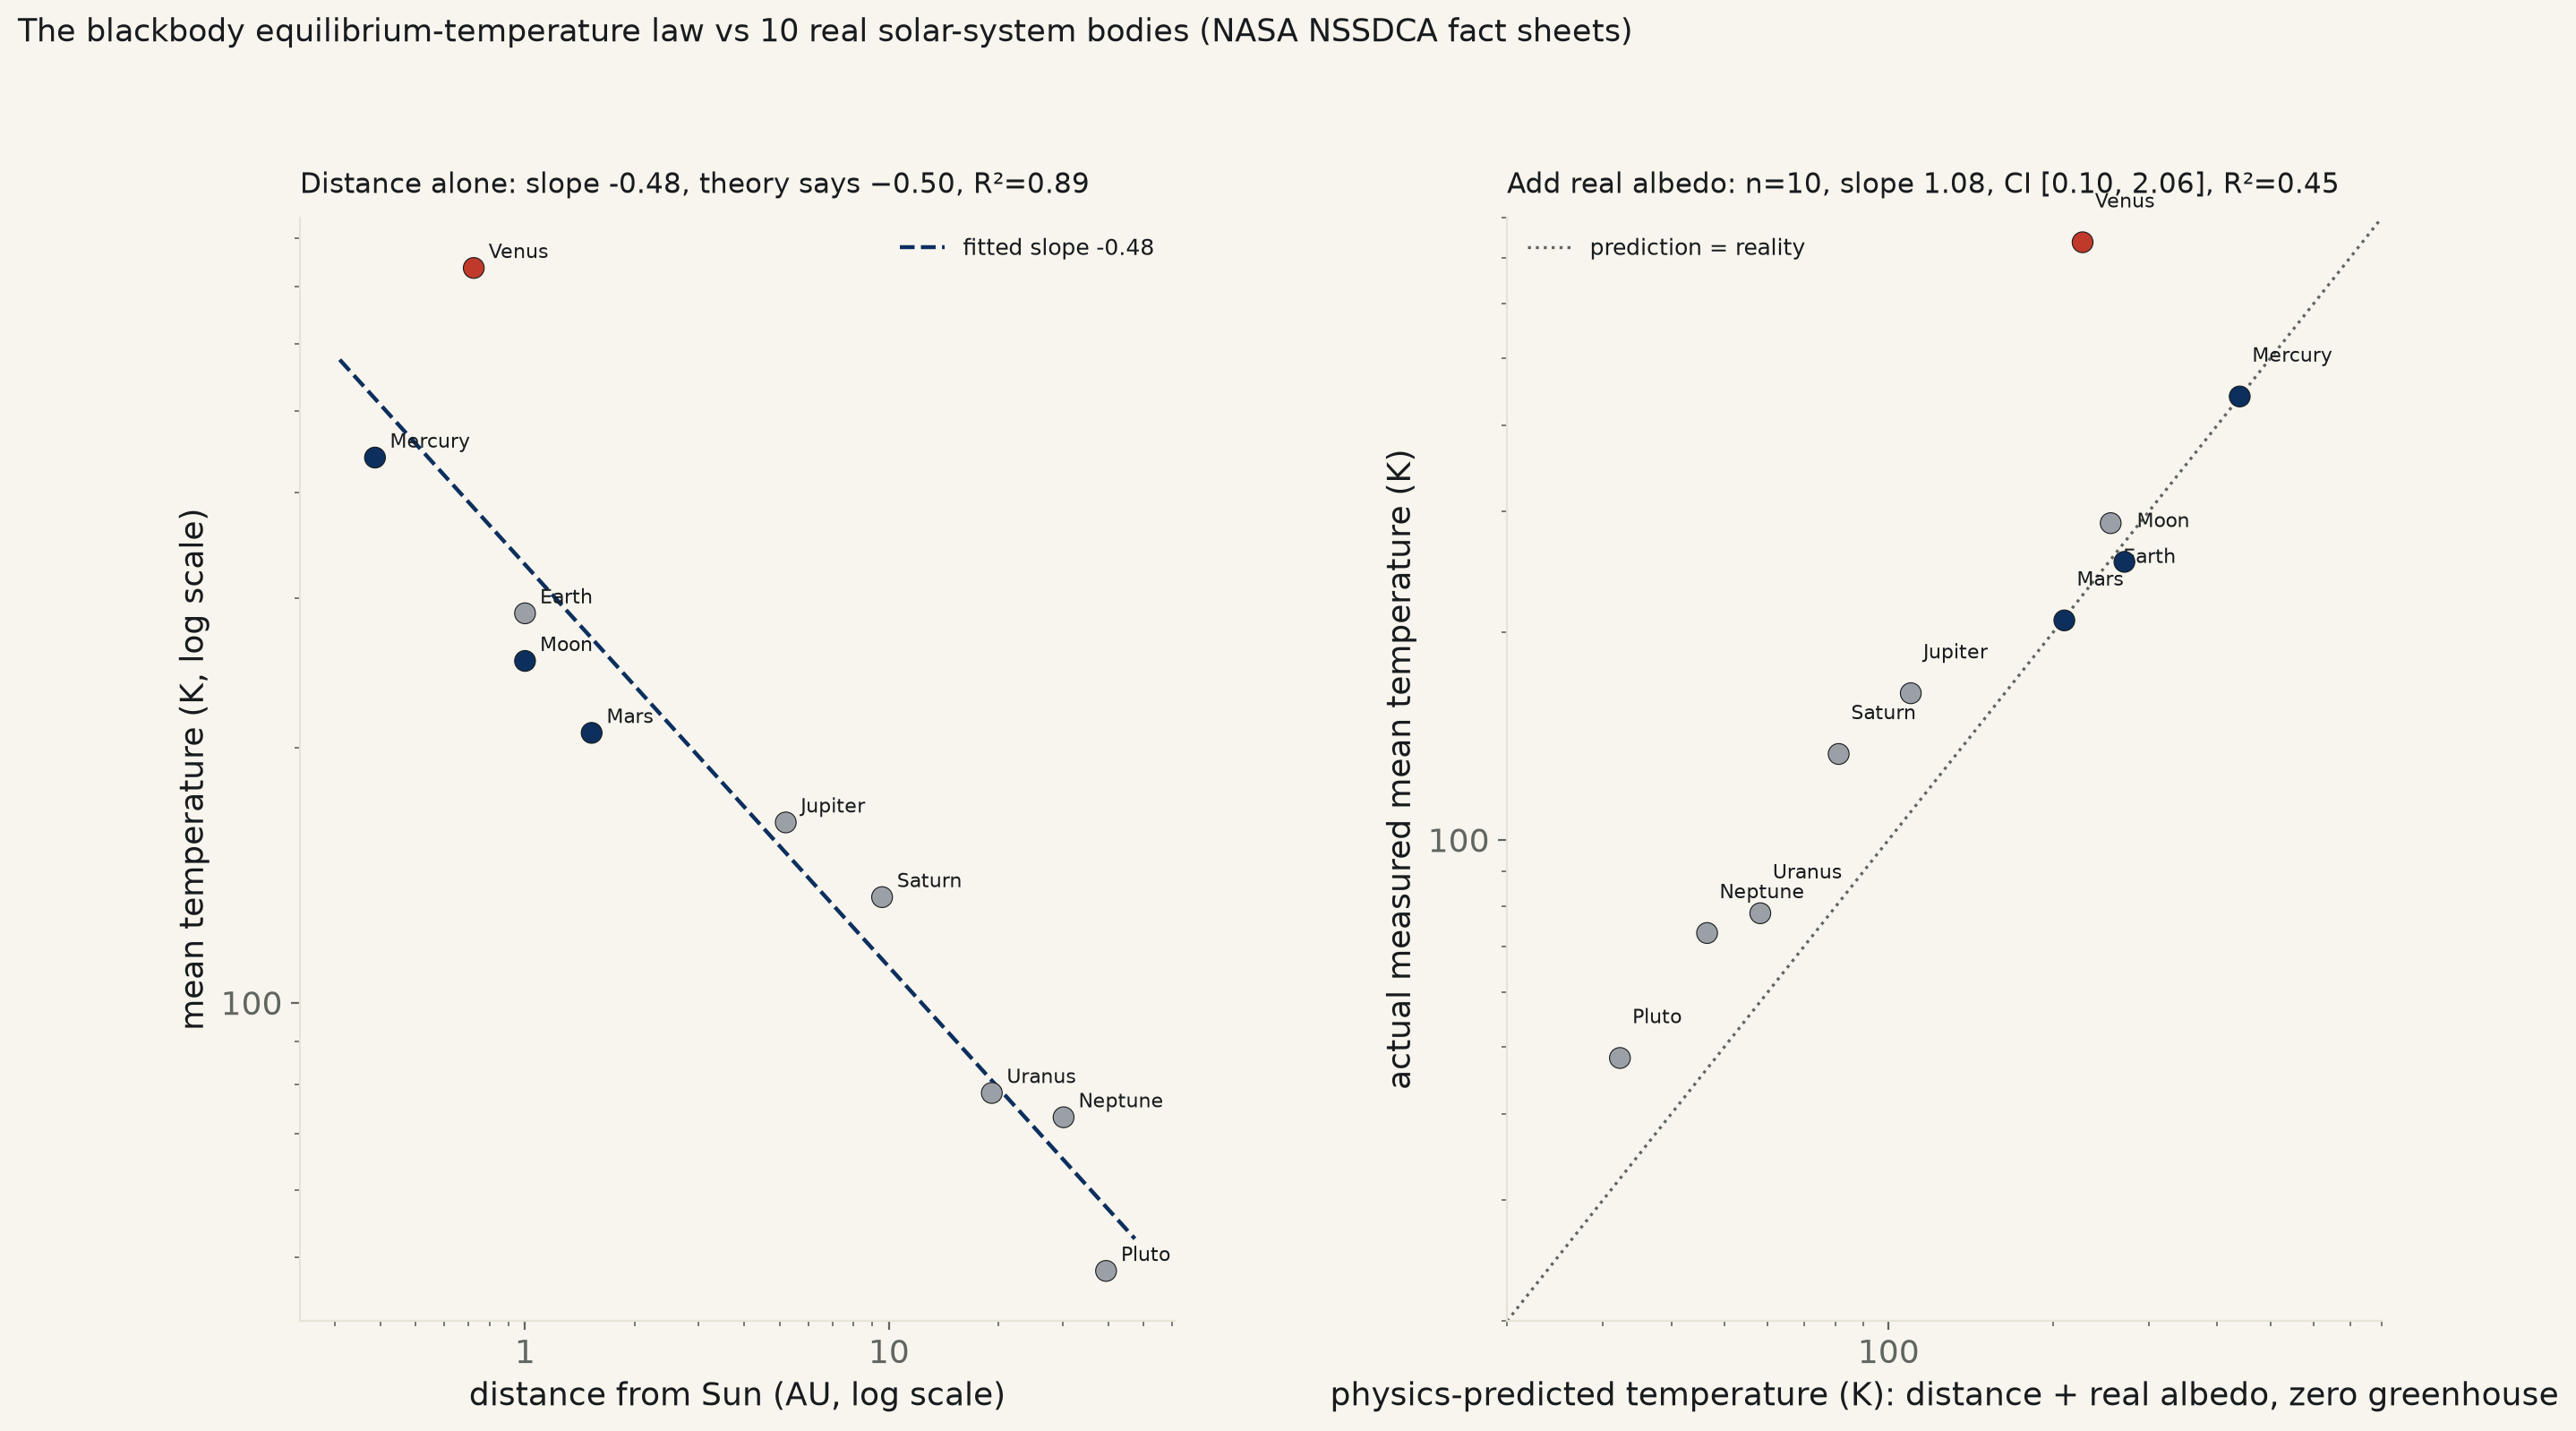
10 solar-system bodies, NASA's own fact sheets, fetched live. Distance alone predicts temperature with slope -0.48 (theory: −0.50), R²=0.89. Add each body's own real albedo and the fit should tighten — across all 10 it barely holds together, R²=0.45, because Venus runs +510 K hotter than predicted. Drop that one planet: slope 0.91, CI [+0.77, +1.04], R²=0.97 — prediction equals reality for the other nine.
The equilibrium-temperature law is one of the first things a planet gets taught to do in an astronomy class: balance the sunlight a body absorbs against the thermal radiation it gives off, and you get a predicted temperature from nothing but distance from the Sun and how much of that sunlight the surface reflects back (its Bond albedo). No atmosphere, no greenhouse, no internal heat — just geometry and the Stefan-Boltzmann law. This run pulls every figure live from NASA's own Planetary Fact Sheets — distance, measured mean temperature, and each body's own Bond albedo — for the 8 planets plus the Moon and Pluto, and asks how far the simplest version of the law gets.
Distance alone, ignoring albedo entirely, is most of the story. log₁₀(temperature) on log₁₀(distance) across all 10 bodies gives slope -0.48, 95% CI [-0.61, -0.34] — a hair off the textbook −0.50 that falling off as the inverse square root of distance predicts, R²=0.89. Just knowing how far a world sits from the Sun gets you most of the way to its temperature.
Add each body's own real albedo and the picture should tighten — and it does, except for one planet that blows the whole fit up. Regressing actual measured temperature on the full physics prediction (distance and albedo, zero greenhouse) across all 10 bodies gives slope +1.08, 95% CI [+0.10, +2.06] — technically excludes zero, p=0.034, but the interval runs from barely-positive to implausibly steep, and R² is only 0.45. One point is doing that: Venus. Predicted 227 K from its distance and its own measured 0.77 albedo (Venus reflects more sunlight than any other planet), Venus actually sits at 737 K — a residual of +510 K, hotter than Mercury despite receiving less than a third of Mercury's sunlight per square meter. Drop that single planet and the same fit tightens dramatically: slope 0.91, 95% CI [+0.77, +1.04] — consistent with 1, prediction equals reality — R²=0.97, n=9. The law isn't loosely true across the board; it's almost exactly true for nine worlds and catastrophically wrong for one.
Venus isn't alone in running hot, just alone in running this hot. Split the sample into airless, geologically inert bodies with no atmosphere to speak of (Mercury, Moon, Mars) against everything else (Venus, Earth, Jupiter, Saturn, Uranus, Neptune, Pluto): the inert group's residuals average -6.1 K — indistinguishable from the prediction. The rest average +101.6 K warmer than predicted. A Welch's t-test on that gap does not clear significance (t=-1.57, p=0.17) — with only 3 and 7 bodies in each group and Venus dominating the second group's variance, this desk cannot formally distinguish the two populations, even though the table makes the pattern easy to see by eye: every gas giant runs 20–53 K warmer than the zero-greenhouse prediction (they radiate real leftover heat from their own formation, not reflected sunlight), Earth runs 33 K warmer (a real, much smaller greenhouse effect), and the three airless rocky/icy bodies — Mercury, the Moon, Mars — land within 2 K of the line either way.
Read plainly. The law is not a loose approximation that happens to miss by a little everywhere; nine of ten bodies land close enough to call it confirmed, and the tenth lands 510 K away. A single quoted "R²=0.45, p=0.03" for the whole sample would bury that shape entirely.
| Specification | slope | 95% CI | R² | p | n |
|---|---|---|---|---|---|
| Distance only, log(T) ~ log(d) (theory: −0.50) | -0.48 | [-0.61, -0.34] | 0.894 | p<0.001 | 10 |
| Distance + real albedo vs actual temperature, whole sample | +1.08 | [+0.10, +2.06] | 0.449 | p=0.034 | 10 |
| Same, dropping Venus | +0.91 | [+0.77, +1.04] | 0.974 | p<0.001 | 9 |
| Body | Distance (AU) | Predicted (K) | Actual (K) | Residual (K) |
|---|---|---|---|---|
| Mercury | 0.39 | 439.6 | 440.2 | +0.6 |
| Venus | 0.72 | 226.6 | 737.2 | +510.5 |
| Earth | 1.00 | 255.1 | 288.2 | +33.0 |
| Moon | 1.00 | 270.3 | 253.2 | -17.2 |
| Mars | 1.52 | 209.8 | 208.2 | -1.7 |
| Jupiter | 5.20 | 109.8 | 163.2 | +53.3 |
| Saturn | 9.57 | 81.0 | 133.2 | +52.1 |
| Uranus | 19.16 | 58.2 | 78.2 | +20.0 |
| Neptune | 30.18 | 46.5 | 73.2 | +26.6 |
| Pluto | 39.48 | 32.2 | 48.2 | +15.9 |
Method. Source: NASA NSSDCA's Planetary Fact Sheet
(nssdc.gsfc.nasa.gov/planetary/factsheet/),
fetched live at run time, not transcribed from memory. Distance from the Sun and mean
temperature come from the site's own cross-body comparison table; Bond albedo comes
from each body's individual fact-sheet page (<body>fact.html), parsed
separately because the comparison table does not carry it. The Moon's heliocentric
distance is taken as Earth's (the comparison table lists the Moon's distance from
Earth, footnoted by NASA itself, not its distance from the Sun). Predicted
temperature uses the standard zero-greenhouse blackbody equilibrium formula, calibrated
with the solar constant (1361 W/m² at 1 AU) and the Stefan-Boltzmann constant —
physical constants, not fitted values, in the same spirit as run 030's use of Newton's
exponents. 1 AU is calibrated from the dataset's own fetched Earth distance, not a
separately hardcoded figure. OLS throughout (scipy.stats.linregress);
the inert-vs-rest comparison uses Welch's t-test (unequal variances, badly justified
by a 3-vs-7 split to begin with).
Limits, stated plainly. n=10 is a census of the solar system's major bodies, not a sample drawn from a larger population — standard errors and p-values are reported because the method calls for them, but they describe sampling uncertainty that doesn't really apply to "every planet there is." The whole-sample slope's 95% CI, [+0.10, +2.06], is wide enough to be nearly uninformative on its own; it is reported honestly rather than dropped, but the drop-Venus fit is the more honest single number for how well the law performs on everything else. "Mean temperature" as NASA publishes it is a single averaged figure per body, not a modeled equilibrium temperature with redistribution assumptions specified — for Mercury in particular (no atmosphere, extreme day/night swing) a published "mean" can depend on how that average was taken, which this run does not control for. Major moons besides Earth's (Titan, Europa, Triton) are not included, though several would sharpen the atmosphere/no-atmosphere split further.
planet_temp_561.csv (distance, Bond albedo, mean temperature, per body) · fit output (JSON).
