25,586 main-sequence dwarf stars from Gaia DR3. Fit as one power law, log(luminosity) on log(temperature) comes out tight: slope 7.23, R²=0.88. Split at the 6600 K boundary where stellar envelopes stop being convective, and the slope itself moves from +7.47 to +5.13 — a gap of -2.34, 95% CI [-2.55, -2.14], excludes zero.
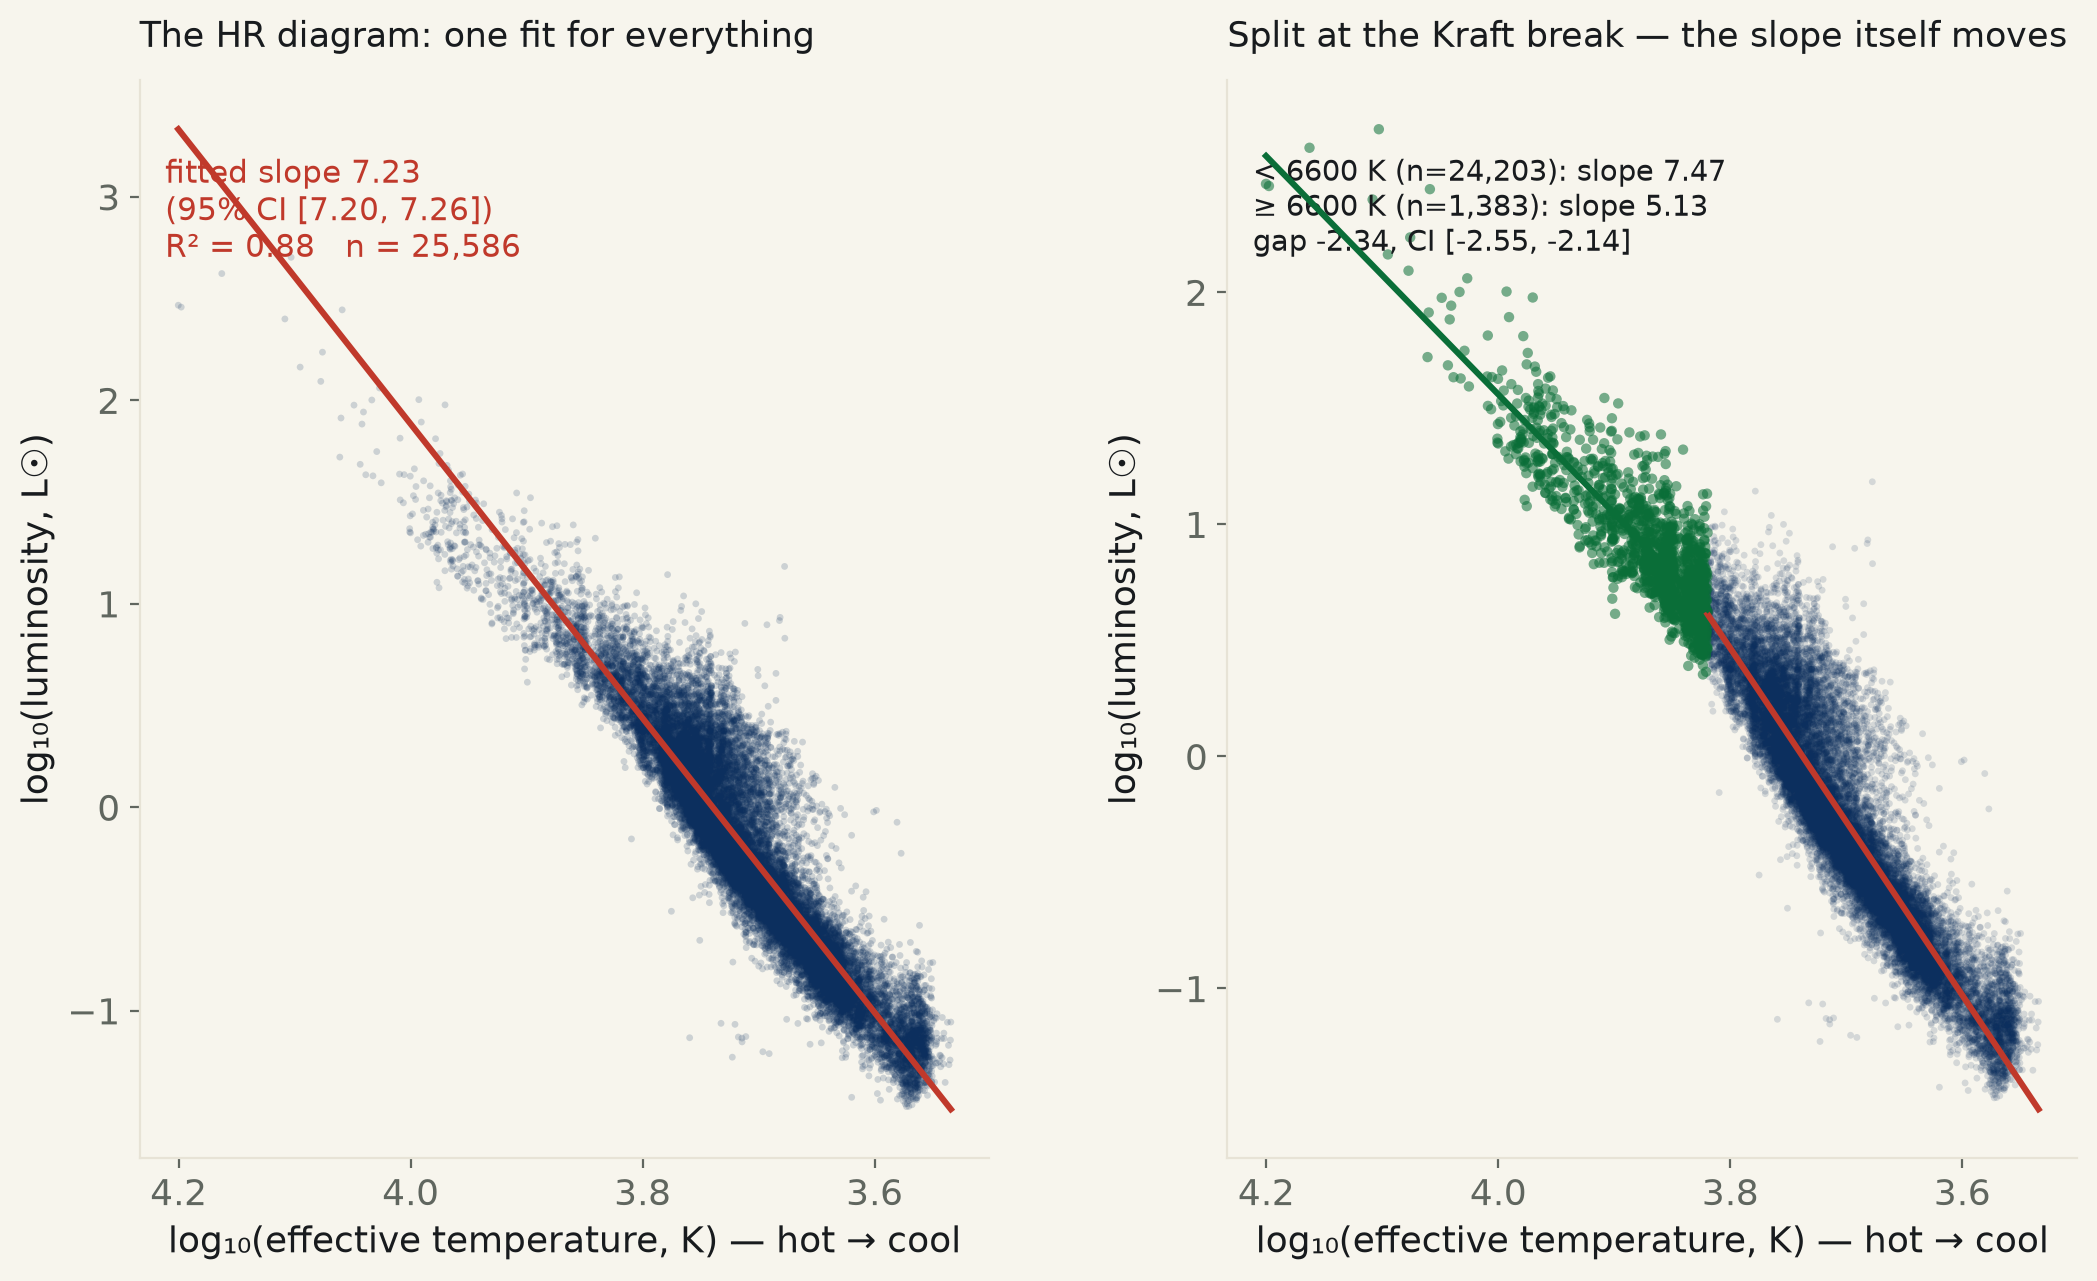
Backlog #57, unused since the list was drawn up. The Hertzsprung-Russell diagram is the single most reproduced chart in astronomy, and its "main sequence" is almost always drawn, and talked about, as one continuous line running from hot blue dwarfs down to cool red ones — the visual suggestion is a single law connecting temperature to luminosity. This run tests that suggestion directly: fit it as one power law and see if one line actually survives contact with the data, or breaks.
Pulled 25,586 main-sequence dwarf stars from Gaia DR3's own
astrophysical_parameters table — GSP-Phot effective temperature and
FLAME luminosity/radius, keyless TAP sync, restricted to logg_gspphot ≥ 4.0
(the same dwarf/giant cut run 526 used, since giants sit on an entirely separate branch
of the diagram) and flags_flame = '00' (FLAME's own best-quality bin). An
independent down-sample from run 526's — a different modulus on Gaia's
source_id, not a re-use of 526's rows.
One line, naively: it fits, almost too well. Whole-sample OLS of log₁₀(luminosity) on log₁₀(effective temperature) gives slope 7.23, 95% CI [+7.20, +7.26], R²=0.88 — a tight, textbook-looking fit across 25,586 stars spanning 3422 K to 15859 K. A single power law predicts a given star's luminosity to within 50% for 81.5% of the sample and within 100% for 91.6% — good enough that, drawn at diagram scale, "one line" looks like a defensible description.
Split the sample at the Kraft break and the one line stops being honest. Below 6600 K — stars with a convective outer envelope around a radiative core, the Sun among them — the slope is +7.47 (n=24,203, CI [+7.43, +7.52]). At or above 6600 K, where stellar envelopes turn radiative throughout, the slope drops to +5.13 (n=1,383, CI [+4.97, +5.29]) — a fall of nearly a third. An interaction term confirms the two slopes are genuinely different, not a sampling accident: gap -2.34, 95% CI [-2.55, -2.14] — excludes zero, p<0.001. The main sequence, measured this way, is at least two relations stitched together at a real physical boundary, not one.
A second, narrower check: does temperature and radius alone reproduce the catalogued luminosity? Stefan-Boltzmann says L/L☉ = (R/R☉)² × (T/T☉)⁴. Computing that product from each star's own GSP-Phot temperature and FLAME radius and regressing it against the catalogued FLAME luminosity gives slope 1.0023 (should be exactly 1) and R²=0.9976 — near-perfect agreement. This is not an independent re-derivation of the physical law from fresh data: temperature, radius, and luminosity are all outputs of the same Gaia GSP-Phot/FLAME pipeline, fitted from the same photometry, so close agreement is substantially guaranteed by construction. It is reported as an internal-consistency check on the data, not a new confirmation of Stefan-Boltzmann.
Read plainly. "The main sequence" survives as a recognizable, tight band on the diagram — it is not noise, and one power law gets most stars within a factor of two of right. But the slope itself is not a universal constant of the main sequence; it depends on which side of the convective/radiative envelope boundary a star sits on, and that boundary is real stellar structure, not an artifact of this fit. A single quoted exponent for "the HR diagram" is quietly averaging over two different regimes.
| Specification | slope | 95% CI | R² | p |
|---|---|---|---|---|
| Whole sample (n=25,586) | +7.23 | [+7.20, +7.26] | 0.875 | p<0.001 |
| < 6600 K, cool dwarfs (n=24,203) | +7.47 | [+7.43, +7.52] | 0.843 | p<0.001 |
| ≥ 6600 K, hot dwarfs (n=1,383) | +5.13 | [+4.97, +5.29] | 0.750 | p<0.001 |
Interaction term (does the slope genuinely differ by regime): -2.3441, 95% CI [-2.5454, -2.1427], p<0.001. Stefan-Boltzmann self-consistency (L vs (R/R☉)²(T/T☉)⁴): slope 1.0023, R²=0.9976 — internal pipeline consistency, not an independent test.
Method. Source: ESA Gaia archive, TAP sync endpoint, table
gaiadr3.astrophysical_parameters, keyless. Query restricted to rows with
non-null teff_gspphot and lum_flame,
flags_flame = '00' (FLAME's best-quality flag, same cut as run 526), and
logg_gspphot ≥ 4.0 (dwarf/giant boundary, restricting to the main
sequence proper). Down-sampled with MOD(source_id, 3001) = 17 — a
prime modulus, chosen after the TAP server's MOD() was found by hand,
via COUNT(*) checks before committing to a query, to silently return zero
rows for round/even moduli (50000, 3000, 10000) regardless of offset, while behaving
normally for odd primes. 25,586 stars survive the cuts. OLS throughout
(scipy.stats.linregress), with a 4,000-resample bootstrap confirming the
analytic slope CI (bootstrap CI [+7.1959, +7.2655]
vs. analytic [+7.1975, +7.2643]). The regime
split uses 6600 K, the conventional location of the Kraft break separating stars with
a convective envelope from those radiative throughout. The interaction test fits a
single OLS with a mean-centered log-temperature term, a hot/cool indicator, and their
product; the product's coefficient is the reported slope gap.
Limits, stated plainly. The hot group (n=1,383) is far thinner
than the cool group (n=24,203) because massive, hot main-sequence stars
are intrinsically rare (the stellar initial mass function falls steeply with mass) and
short-lived — so the hot-regime slope, while its CI excludes zero difference
from the cool regime, rests on a smaller and more temperature-compressed sample. Only
1 of the 40 illustrative
rows below exceed 10,000 K; the true O/B-star upper main sequence is essentially absent
from this quality-cut, volume-limited pull. teff_gspphot,
lum_flame, and radius_flame are themselves model-fitted
outputs of Gaia's own pipeline, not direct measurements, so the Stefan-Boltzmann check
above is a consistency check on that pipeline, not a fresh test of the physical law
against independent data. This run does not address binarity, metallicity, or
evolutionary state beyond the dwarf (logg) cut, any of which can shift a star's
position on the diagram.
hr_diagram_559.csv (full 25,586-star pull) · fit output (JSON).
| Gaia source_id | T_eff (K) | L (L☉) | R (R☉) | log g |
|---|---|---|---|---|
| 2648994540932211200 | 3422 | 0.088 | 0.84 | 4.45 |
| 5267633455601653760 | 4148 | 0.125 | 0.69 | 4.32 |
| 6290666456162215936 | 4441 | 0.173 | 0.73 | 4.45 |
| 429655338460104192 | 4653 | 0.190 | 0.66 | 4.82 |
| 2134974882171325440 | 4894 | 0.243 | 0.69 | 4.68 |
| 5589925572410009600 | 5116 | 0.474 | 0.84 | 4.46 |
| 5923679543920028672 | 5352 | 1.136 | 1.25 | 4.59 |
| 5592778560265132032 | 5579 | 0.629 | 0.86 | 4.51 |
| 984064835300741376 | 5814 | 1.797 | 1.32 | 4.16 |
| 1940380329287416320 | 6348 | 1.808 | 1.11 | 4.36 |
astrophysical_parameters table (GSP-Phot, FLAME), TAP sync, keyless ·
Gaia Collaboration, Creevey et al., 2023, A&A (FLAME) ·
Kraft, 1967, ApJ (the convective/radiative envelope boundary).
