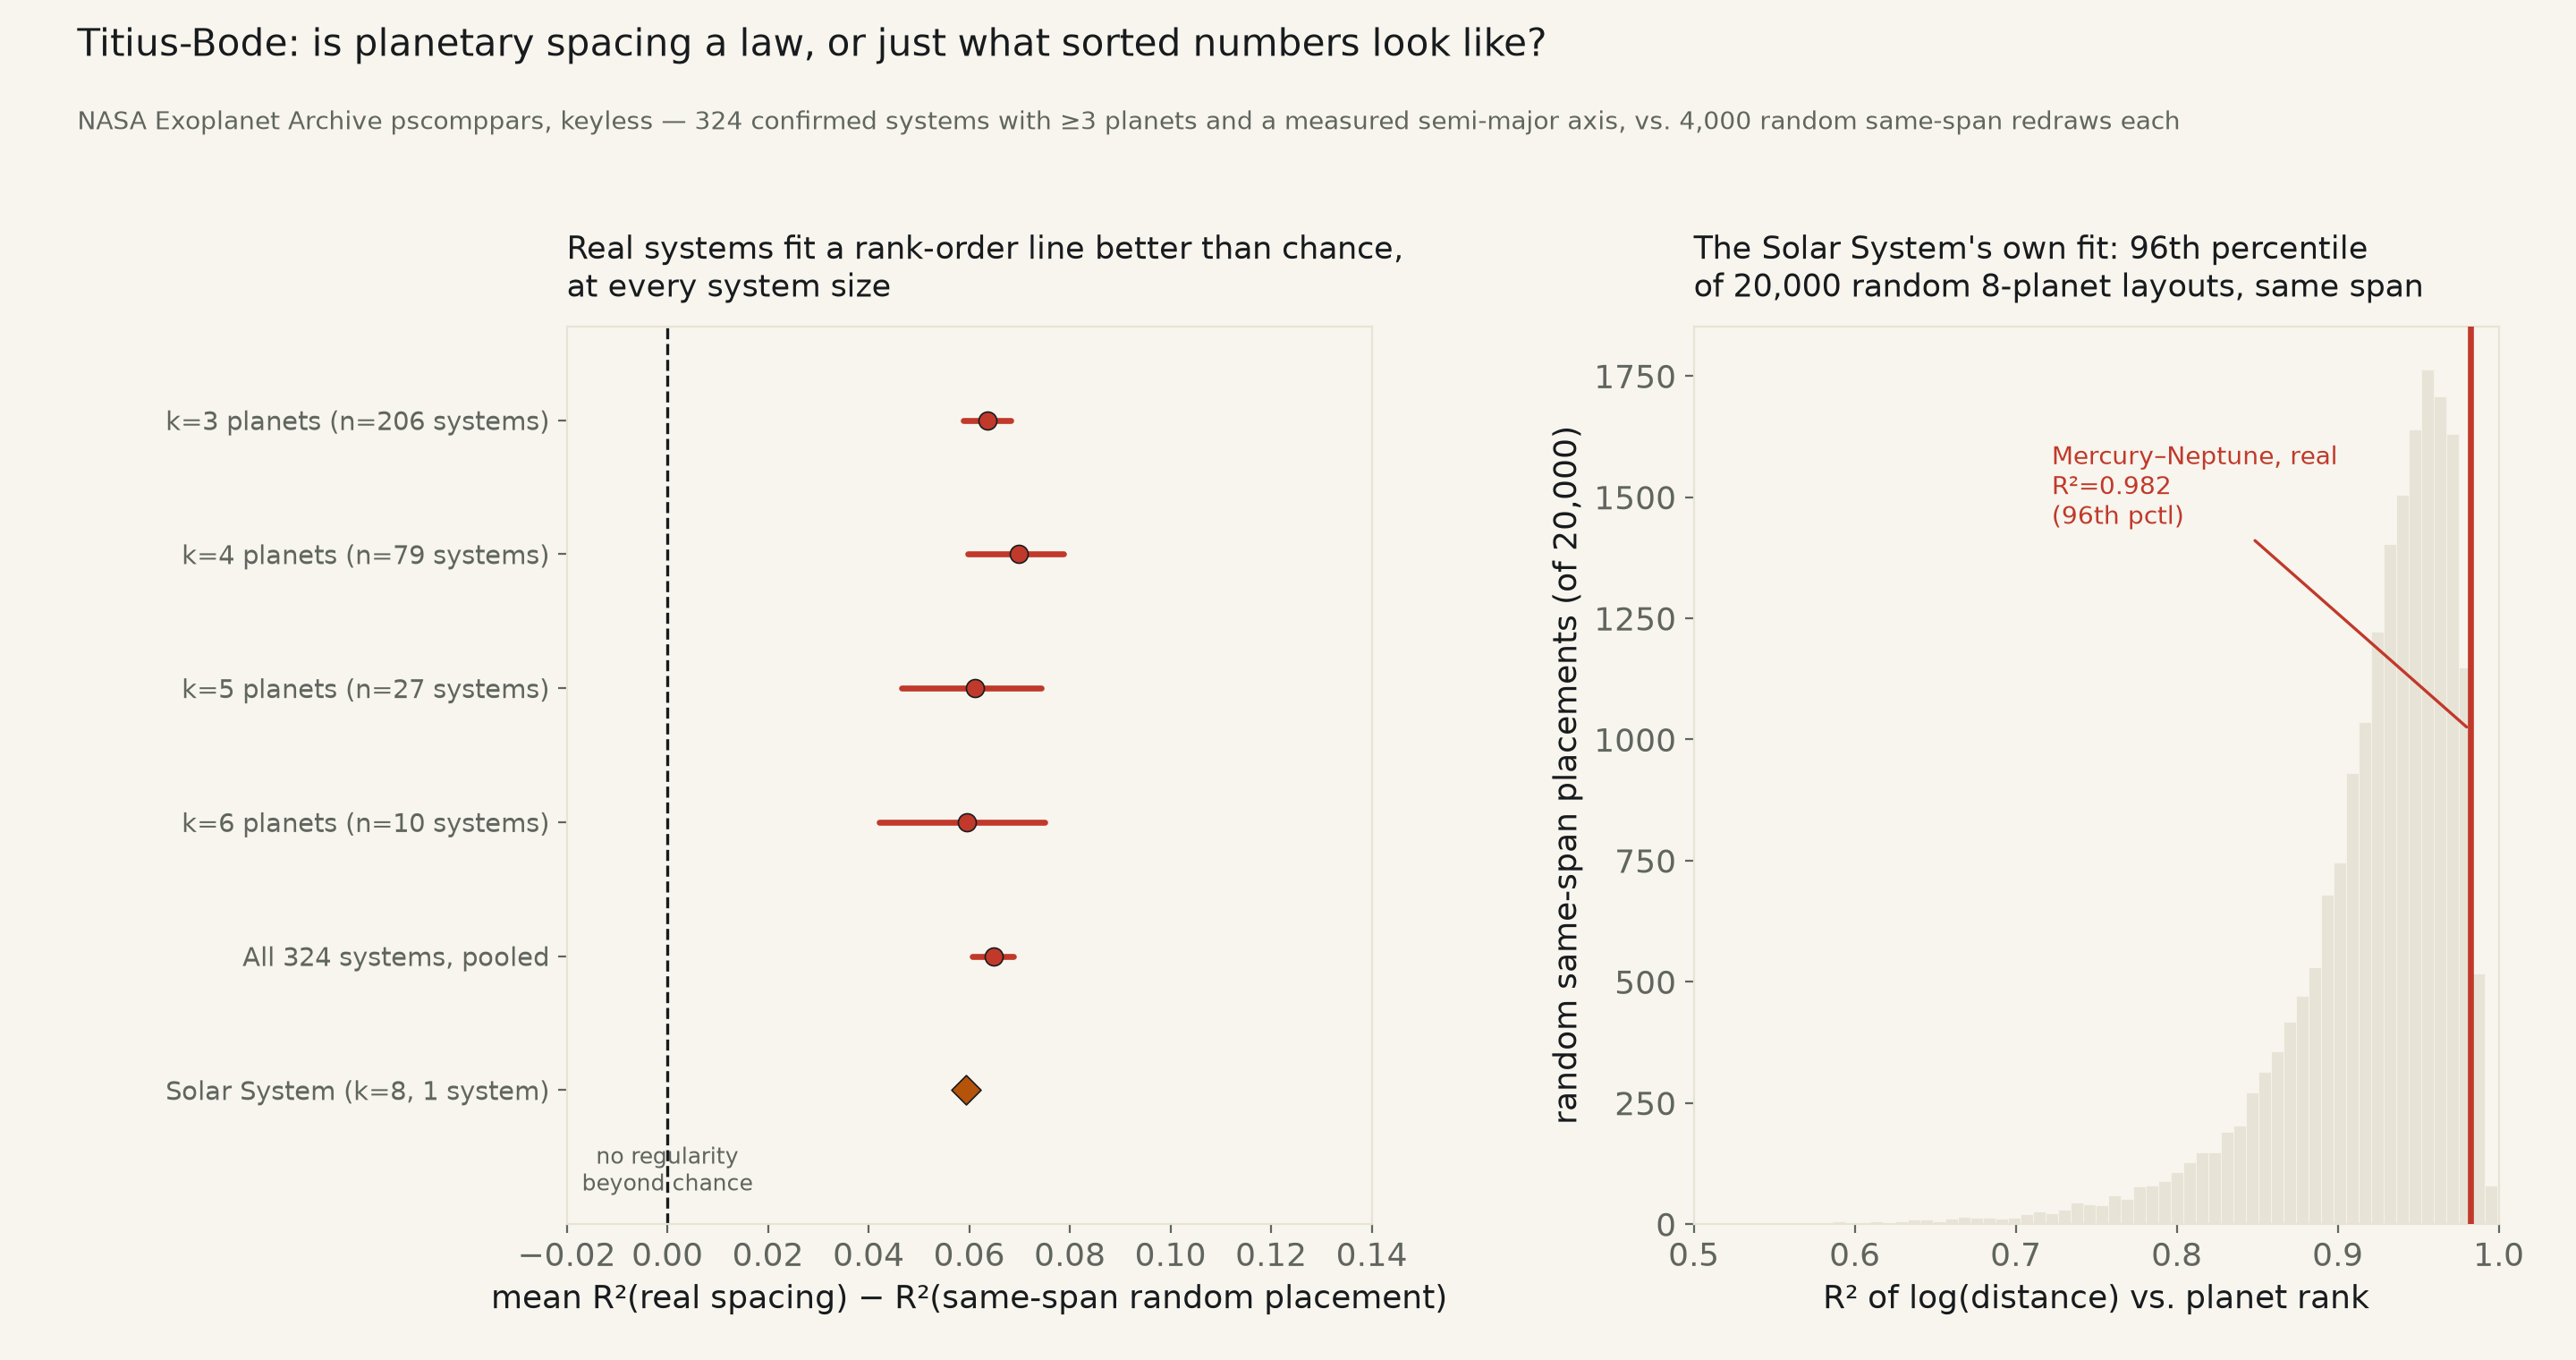
324 confirmed multi-planet systems, each checked against 4,000 random same-span redraws of its own interior planets. Real systems fit a log-distance-vs-rank line better than chance by mean +0.065 R², 95% CI [+0.061, +0.069] — excludes zero. The Solar System's own Mercury–Neptune fit sits at the 96th percentile of its own null. Not proof of the 1766 formula — proof of a real regularity underneath it.
Backlog #53. In 1766, Johann Titius (popularized by Johann Bode) proposed that planets fall at distances from the Sun following a simple doubling progression — a "law" that predicted the asteroid belt's location before Ceres was found, then missed Neptune's real distance by 29%, and was never a 1766 law at all so much as a formula fit to the six planets known at the time. The standard debunk: sort any handful of increasing numbers and plot log(value) against rank, and the result tends to look suspiciously like a tidy progression — that's a property of sorted lists, not of planets.
This run does not re-test Titius and Bode's specific 1766 formula (a fixed doubling sequence anchored to Mercury). It tests the weaker, falsifiable claim underneath the folklore: are real multi-planet systems' distances more regularly spaced — more log-linear in rank — than you'd get from scattering the same number of planets at random (log-uniform) distances across the same span? Pulled 324 confirmed systems with 3 or more planets and a measured semi-major axis from the NASA Exoplanet Archive's own composite-parameters table, keyless. For each system, its innermost and outermost planet are held fixed (they define the span by construction) and the interior planets are redrawn log-uniform at random 4,000 times, to build each system's own null distribution of what "no regularity beyond chance" looks like for a layout of that exact size and span.
The Solar System itself, first, as the illustrative case Titius-Bode was literally fit to. Mercury through Neptune, sorted by distance: log(AU) regressed on rank gives R²=0.982, slope 0.284 in log10 — each step out is on average 1.92× farther than the last, not far from the "roughly doubling" folk memory of the original formula. Against 20,000 random 8-planet layouts spanning the same 0.387–30.07 AU range, that real fit lands at the 96th percentile — genuinely more regular than most random arrangements of the same size and span, not merely a trivial consequence of sorting 8 numbers.
Across all 324 real exoplanet systems, the same pattern holds. Mean real R²=0.969 (median 0.983) versus a mean null R²=0.904 (median 0.906) from each system's own random redraws. The paired gap: ΔR²=+0.0648, 95% CI [+0.0607, +0.0687] — excludes zero by a wide margin, t=31.7, p≈4.9e-101. A second, independent check agrees: under a true null, about 5% of systems should land above their own null's 95th percentile by chance alone. 77 of 324 real systems do — 23.8%, 95% CI [19.2%, 28.8%], roughly five times the 5% chance rate, binomial p≈1.9e-30.
Checked by system size, so the effect isn't just "small systems are easy to fit." The gap holds at essentially the same size whether a system has 3 planets (n=206, ΔR²=+0.0636, CI [+0.0589, +0.0683]), 4 (n=79, +0.0699, CI [+0.0597, +0.0788]), 5 (n=27, +0.0611, CI [+0.0465, +0.0744]), or 6 (n=10, +0.0596, CI [+0.0421, +0.0750]) — no sign the regularity is an artifact that fades as more planets give a fit more ways to go wrong. The two densest systems in the pull, TRAPPIST-1 (7 planets, R²=0.994) and KOI-351/Kepler-90 (8 planets, tied with the Solar System for the most confirmed planets around any single star, R²=0.960), both sit well above their own null means.
Read plainly. This is not a resurrection of the 1766 formula — that specific doubling sequence, anchored at Mercury, is not what was fit here, and this run makes no claim about predicting a planet at any particular numbered slot. What it does show is that real planetary systems are measurably, repeatedly more evenly spaced in log-distance than chance alone would produce, holding at every system size this pull can check. That lines up with the real (and much less mystical) literature on "peas in a pod" architecture — multi-planet systems found to have unusually uniform sizes and regular spacing, generally attributed to how closely-packed systems form and which configurations survive dynamically stable over billions of years, not to any law of celestial arithmetic. One honest limitation this run cannot rule out: transit surveys, the source of most of this pull, are mechanically better at detecting multiple transiting planets in flatter, more evenly spaced systems in the first place — so some of this measured regularity may be the detection method's own selection effect, not only the systems' physics.
| Specification | mean ΔR² | 95% CI | Verdict |
|---|---|---|---|
| All 324 systems, pooled (ΔR²) | +0.0648 | [+0.0607, +0.0687] | excludes zero, p=4.9e-101 |
| k=3 planets only (n=206 systems) | +0.0636 | [+0.0589, +0.0683] | excludes zero |
| k=4 planets only (n=79 systems) | +0.0699 | [+0.0597, +0.0788] | excludes zero |
| k=5 planets only (n=27 systems) | +0.0611 | [+0.0465, +0.0744] | excludes zero |
| k=6 planets only (n=10 systems) | +0.0596 | [+0.0421, +0.0750] | excludes zero |
Exceedance check: under a true null, ~5% of systems should land above their own null's 95th percentile by chance. Observed: 77/324 = 23.8%, 95% CI [19.2%, 28.8%], binomial p≈1.9e-30.
Method. Source: NASA Exoplanet Archive's Planetary Systems Composite
Parameters table (pscomppars), TAP sync endpoint, keyless. Pulled every
row with a non-null, positive semi-major axis (pl_orbsmax) belonging to a
hostname with 3 or more such rows after that filter — 324 systems,
322 of them with 3–6 planets (plus
TRAPPIST-1 at 7 and KOI-351/Kepler-90 at 8, shown individually, outside the by-size
bootstrap groups below n=5). Per system: sort planets by distance, assign rank 1..k,
fit OLS of log10(AU) on rank, record R². Null: redraw the k−2
interior planets' log-distances uniformly between the system's own real innermost and
outermost values (which are held fixed, since they define the span by construction),
4,000 times per system, refit identically, average the R². ΔR² is the
paired difference per system; its 95% CI is a 20,000-resample bootstrap over the
324 systems. The Solar System panel uses the standard NASA Planetary
Fact Sheet semi-major axis values and the identical procedure, with 20,000 (not 4,000)
null draws since it is a single illustrative system, not part of the pooled statistic.
Limits, stated plainly. This tests orbital distance only, using the Archive's best current composite value per planet — not orbital period, not mass, not eccentricity, and not the specific 1766 Titius-Bode numerical formula (a fixed doubling sequence), which this run does not fit or predict from. Transit surveys, the source of most multi-planet detections in this pull, are mechanically better at finding several transiting planets in flatter, more evenly spaced, more similarly-sized systems in the first place; some of the measured regularity here may be that detection selection effect rather than purely the underlying physics. Systems with 7–8 planets (TRAPPIST-1, KOI-351) are too few to bootstrap a group CI and are reported as individual cases, not pooled into the by-size breakdown.
exo_multiplanet_558.csv (full 324-system, 1144-planet-row pull) · fit output (JSON).
| System | planets | R² real | R² null (mean of 4,000) | ΔR² |
|---|---|---|---|---|
| KOI-351 | 8 | 0.9599 | 0.9217 | +0.0383 |
| TRAPPIST-1 | 7 | 0.9943 | 0.9172 | +0.0771 |
| HD 10180 | 6 | 0.9927 | 0.9088 | +0.0839 |
| HD 110067 | 6 | 0.9935 | 0.9076 | +0.0859 |
| HD 191939 | 6 | 0.9338 | 0.9090 | +0.0248 |
| HD 219134 | 6 | 0.9133 | 0.9096 | +0.0037 |
| HD 34445 | 6 | 0.9741 | 0.9069 | +0.0672 |
| K2-138 | 6 | 0.9455 | 0.9075 | +0.0380 |
| Kepler-11 | 6 | 0.9624 | 0.9079 | +0.0544 |
| Kepler-20 | 6 | 0.9952 | 0.9089 | +0.0863 |
| TOI-1136 | 6 | 0.9871 | 0.9095 | +0.0776 |
| TOI-178 | 6 | 0.9833 | 0.9089 | +0.0743 |
| 55 Cnc | 5 | 0.9762 | 0.9024 | +0.0739 |
| GJ 667 C | 5 | 0.9408 | 0.9008 | +0.0399 |
| HD 108236 | 5 | 0.9768 | 0.9007 | +0.0761 |
| HD 134606 | 5 | 0.9147 | 0.9013 | +0.0134 |
| HD 23472 | 5 | 0.9884 | 0.9019 | +0.0865 |
| HD 40307 | 5 | 0.9854 | 0.9010 | +0.0844 |
| HIP 41378 | 5 | 0.9413 | 0.9024 | +0.0389 |
| Kepler-102 | 5 | 0.9873 | 0.8987 | +0.0886 |
pscomppars), TAP sync, keyless ·
NASA Planetary Fact Sheet (Solar System semi-major axes) ·
Titius–Bode law, background ·
Weiss & Marcy et al., 2018, AJ ("peas in a pod" multi-planet regularity, background, not refit here).
