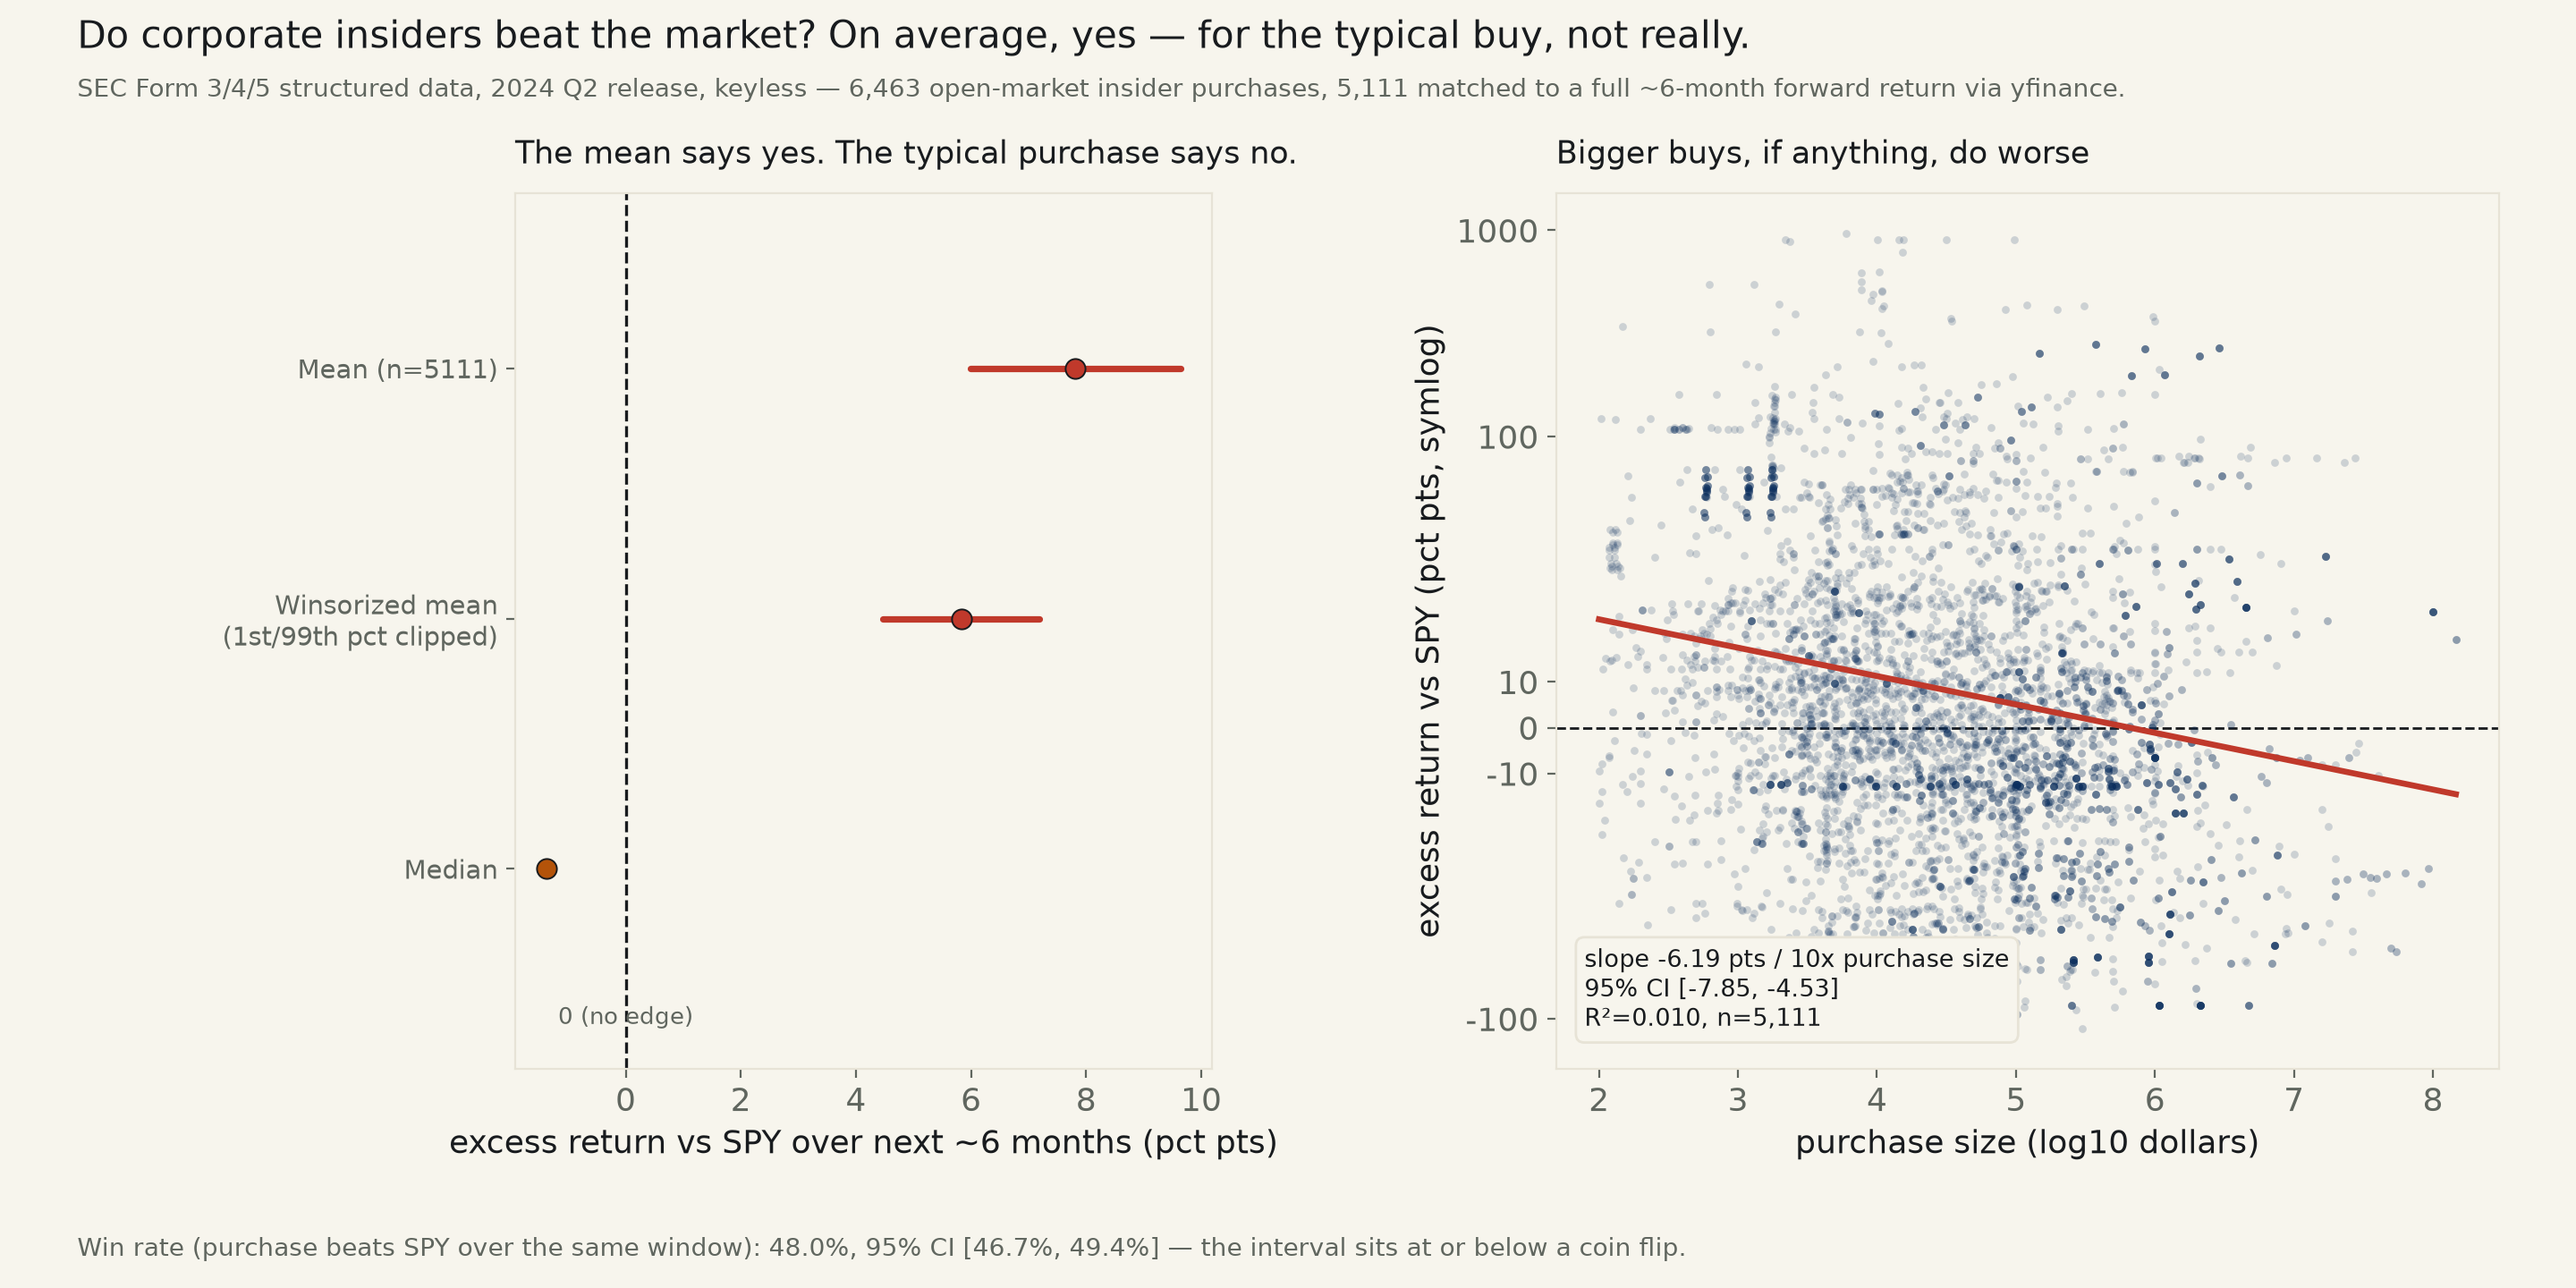
5,111 open-market insider purchases, SEC Form 4, 2024 Q2, matched to a ~6-month forward return against SPY. Mean excess return +7.8 points, 95% CI [+6.0, +9.6] — excludes zero. Median -1.4 points, win rate 48.0% — at or below a coin flip. The average is earned in the tail.
Backlog #18: “do corporate insiders beat the market?” — the
open-market version of insider trading, not the congressional kind this desk has already
checked three times over (004,
007,
017). Officers, directors and 10%+ owners have to
disclose every open-market purchase of their own company's stock on SEC Form 4 within
two business days. The folk theory is straightforward: these are the people who actually
know how the quarter is going, so when they buy with their own money, it's a signal worth
following. This run pulls the SEC's own structured Form 3/4/5 data set for 2024 Q2
— every non-derivative transaction coded P (open-market purchase,
shares acquired) — and matches each one to its ticker's forward return against SPY
over the ~126 trading days (roughly six months) that follow.
The headline says yes. Across 5,111 purchases matched to a full forward-return window (of 6,463 collected; the rest were tickers yfinance couldn't price, mostly thinly-traded micro-caps), the mean excess return — stock forward return minus SPY's forward return over the identical window — is +7.8 percentage points, 95% CI [+6.0, +9.6], p<0.001. That's not a fragile result: clip the top and bottom 1% of the distribution and it barely moves, +5.8 pts, CI [+4.5, +7.2]. Insiders, on average, bought stocks that went on to beat the market.
The typical purchase says no. The median excess return is -1.4 points — essentially flat, on the losing side of flat. The win rate — the share of purchases that actually beat SPY over the same window — is 48.0%, 95% CI [46.7%, 49.4%] — an interval that sits entirely at or below a coin flip. Those two paragraphs describe the same 5,111 purchases. The mean and the median disagree about the sign because the distribution has a long right tail: a purchase in Power Solutions International (PSIX) ran +903 points against SPY; one in TSS, Inc. (TSSI) ran +970. A handful of insiders bought right before a moonshot. Most didn't buy anything the market didn't already know.
Checked plainly: does a bigger purchase mean more conviction, and a bigger edge? The claim implies it should — an insider putting in $2 million is telling you something a $2,000 token buy isn't. It runs backward. Regressing excess return on the log₁₀ of the purchase's dollar value: slope -6.19 points per 10× increase in purchase size, 95% CI [-7.85, -4.53], p<0.001 — excludes zero, and it's negative. R²=0.010 is small, so dollar size is explaining almost none of the variance, but the direction is consistent and a rank-based check agrees: Spearman ρ=-0.186, p<0.001. Bigger buys, in this data, do not signal more; if anything they do slightly worse. The moonshots above were both comparatively small purchases.
Read plainly. There is a real, repeatable-looking average edge here, and it survives the obvious outlier check. But "insiders beat the market" as usually meant — follow the filing, buy what they buy — describes at best a coin flip for any single purchase, because the average is earned entirely in the tail: a small number of insider buys that preceded an enormous run-up, concentrated in exactly the kind of illiquid micro-cap stock where a Form 4 doesn't require much money to file. This is one quarter of purchases carried forward through mid-2024 to early 2025, a period when small caps broadly rallied; the SPY benchmark nets out the overall market's move but not a small-cap risk premium these purchases likely carry as a group, which this run does not attempt to isolate.
| Specification | estimate | 95% CI | Verdict |
|---|---|---|---|
| Mean, all matched purchases (n=5,111) | +7.8 pts | [6.0, 9.6] | excludes zero, p<0.001 |
| Winsorized mean (1st/99th pct clipped) | +5.8 pts | [4.5, 7.2] | excludes zero, p<0.001 |
| Median | -1.4 pts | — | no interval fit (single point statistic) |
| Win rate (beats SPY) | 48.0% | [46.7%, 49.4%] | excludes a coin flip |
Conviction regression: excess_return_pct ~ log₁₀(dollar value of purchase), OLS. Slope -6.19 pts/10×, 95% CI [-7.85, -4.53], R²=0.010, p<0.001. Spearman ρ=-0.186, p<0.001 (rank-based agreement, robust to the outliers OLS is sensitive to).
| Purchase date | Ticker | Issuer | Purchase size | Excess return vs SPY, ~6mo |
|---|---|---|---|---|
| 2024-04-03 | TSSI | TSS, Inc. | $6,000 | +969.8 pts |
| 2024-04-25 | PSIX | POWER SOLUTIONS INTERNATIONAL, INC. | $15,500 | +902.8 pts |
| 2024-06-20 | MNPR | Monopar Therapeutics | $15,176 | +781.9 pts |
| 2024-06-10 | NXL | Nexalin Technology, Inc. | $1,300 | +545.5 pts |
| 2024-06-12 | NUTX | Nutex Health, Inc. | $10,800 | +504.3 pts |
| 2024-04-23 | HROW | HARROW, INC. | $120,547 | +436.0 pts |
| 2024-05-02 | LUMN | Lumen Technologies, Inc. | $960,000 | +382.0 pts |
| 2024-05-06 | CRVS | Corvus Pharmaceuticals, Inc. | $34,600 | +361.2 pts |
| 2024-06-03 | CTTH | CTT PHARMACEUTICAL HOLDINGS, INC. | $148 | +340.2 pts |
| 2024-05-21 | AONC | American Oncology Network, Inc. | $632 | +320.5 pts |
| 2024-05-28 | WGS | GeneDx Holdings Corp. | $377,245 | +278.4 pts |
| 2024-05-17 | CLOV | CLOVER HEALTH INVESTMENTS, CORP. /DE | $9,300 | +230.2 pts |
| 2024-06-04 | PDYN | Palladyne AI Corp. | $20,949 | +222.5 pts |
| 2024-05-14 | AMLX | Amylyx Pharmaceuticals, Inc. | $5,198 | +218.9 pts |
| 2024-06-11 | ACRS | Aclaris Therapeutics, Inc. | $1,080,000 | +211.1 pts |
| 2024-04-25 | EDBL | Edible Garden AG Inc | $4,277 | -112.3 pts |
| 2024-05-07 | ELYS | Elys BMG Group, Inc. | $301,846 | -111.9 pts |
| 2024-06-24 | ARDS | Aridis Pharmaceuticals, Inc. | $50,000 | -109.5 pts |
| 2024-05-30 | XXII | 22nd Century Group, Inc. | $9,810 | -105.7 pts |
| 2024-05-14 | SONX | Sonendo, Inc. | $45,000 | -105.5 pts |
| 2024-03-29 | AZTR | Azitra, Inc. | $9,996 | -101.7 pts |
| 2024-04-15 | KITT | Nauticus Robotics, Inc. | $6,546 | -100.0 pts |
| 2024-03-28 | SOAR | Volato Group, Inc. | $10,590 | -99.9 pts |
| 2024-04-24 | NCPL | Netcapital Inc. | $31,106 | -99.4 pts |
| 2024-04-04 | NXMH | Next Meats Holdings, Inc. | $95,842 | -98.7 pts |
| 2024-04-17 | ROII | RiskOn International, Inc. | $1,122 | -97.1 pts |
| 2024-04-11 | SHWZ | Medicine Man Technologies, Inc. | $105 | -96.2 pts |
| 2024-06-13 | ALXO | ALX ONCOLOGY HOLDINGS INC | $102,360 | -95.3 pts |
| 2024-04-19 | ALZN | Alzamend Neuro, Inc. | $690 | -94.0 pts |
| 2024-04-12 | ASTI | Ascent Solar Technologies, Inc. | $1,800 | -93.1 pts |
Method. Source: the SEC's own Insider Transactions Data Set,
2024 Q2 release, keyless structured TSV files (NONDERIV_TRANS.tsv joined to
SUBMISSION.tsv for the issuer's trading symbol). Filtered to transaction code
P (open-market purchase) with shares acquired, valid share count and price,
and a transaction date inside the quarter the file actually covers (some late-filed
corrections carry dates outside it and are dropped rather than guessed at). A further
469 rows were dropped for an implausible dollar value (under $100 or
over $1 billion for a single Form 4 — filer data-entry errors, most visibly a run of
Kayne Anderson Energy Infrastructure Fund filings that compute to tens of trillions of
dollars), leaving 6,463 purchases. Forward return: close price on the
first trading day on/after the purchase date, to the close price 126 trading sessions later
(~6 calendar months), via yfinance, for both the ticker and SPY over the identical two
dates. 1,352 purchases didn't match to a full window
(ticker not priced by yfinance, or too recent for a full 126-day forward window to exist in
the pull) and are excluded, not imputed.
Limits, stated plainly. One quarter of purchases (2024 Q2, with some late-filed 2024 H1 dates mixed in), carried forward into a period when small- and micro-cap stocks broadly rallied; SPY nets out the S&P 500's own move but not a size or beta premium these purchases likely carry as a group, since insider-heavy tickers skew smaller and more volatile than the index. This run makes no attempt to isolate that premium, so the +7.8-point mean should be read as "insiders' purchases beat SPY," not "insiders beat a risk-matched benchmark." No distinction is drawn between officers, directors, and 10%+ owners, or between a CEO's purchase and a board member's; all open-market buys are pooled. One quarter is a snapshot, not a track record — a different quarter, especially one followed by a down market, could show a different sign on the mean even if the median/win-rate pattern held.
insider_purchases_557.csv (all 6,463 collected purchases) · insider_purchases_557_returns.csv (all 5,111 matched, with forward returns) · fit output (JSON).
