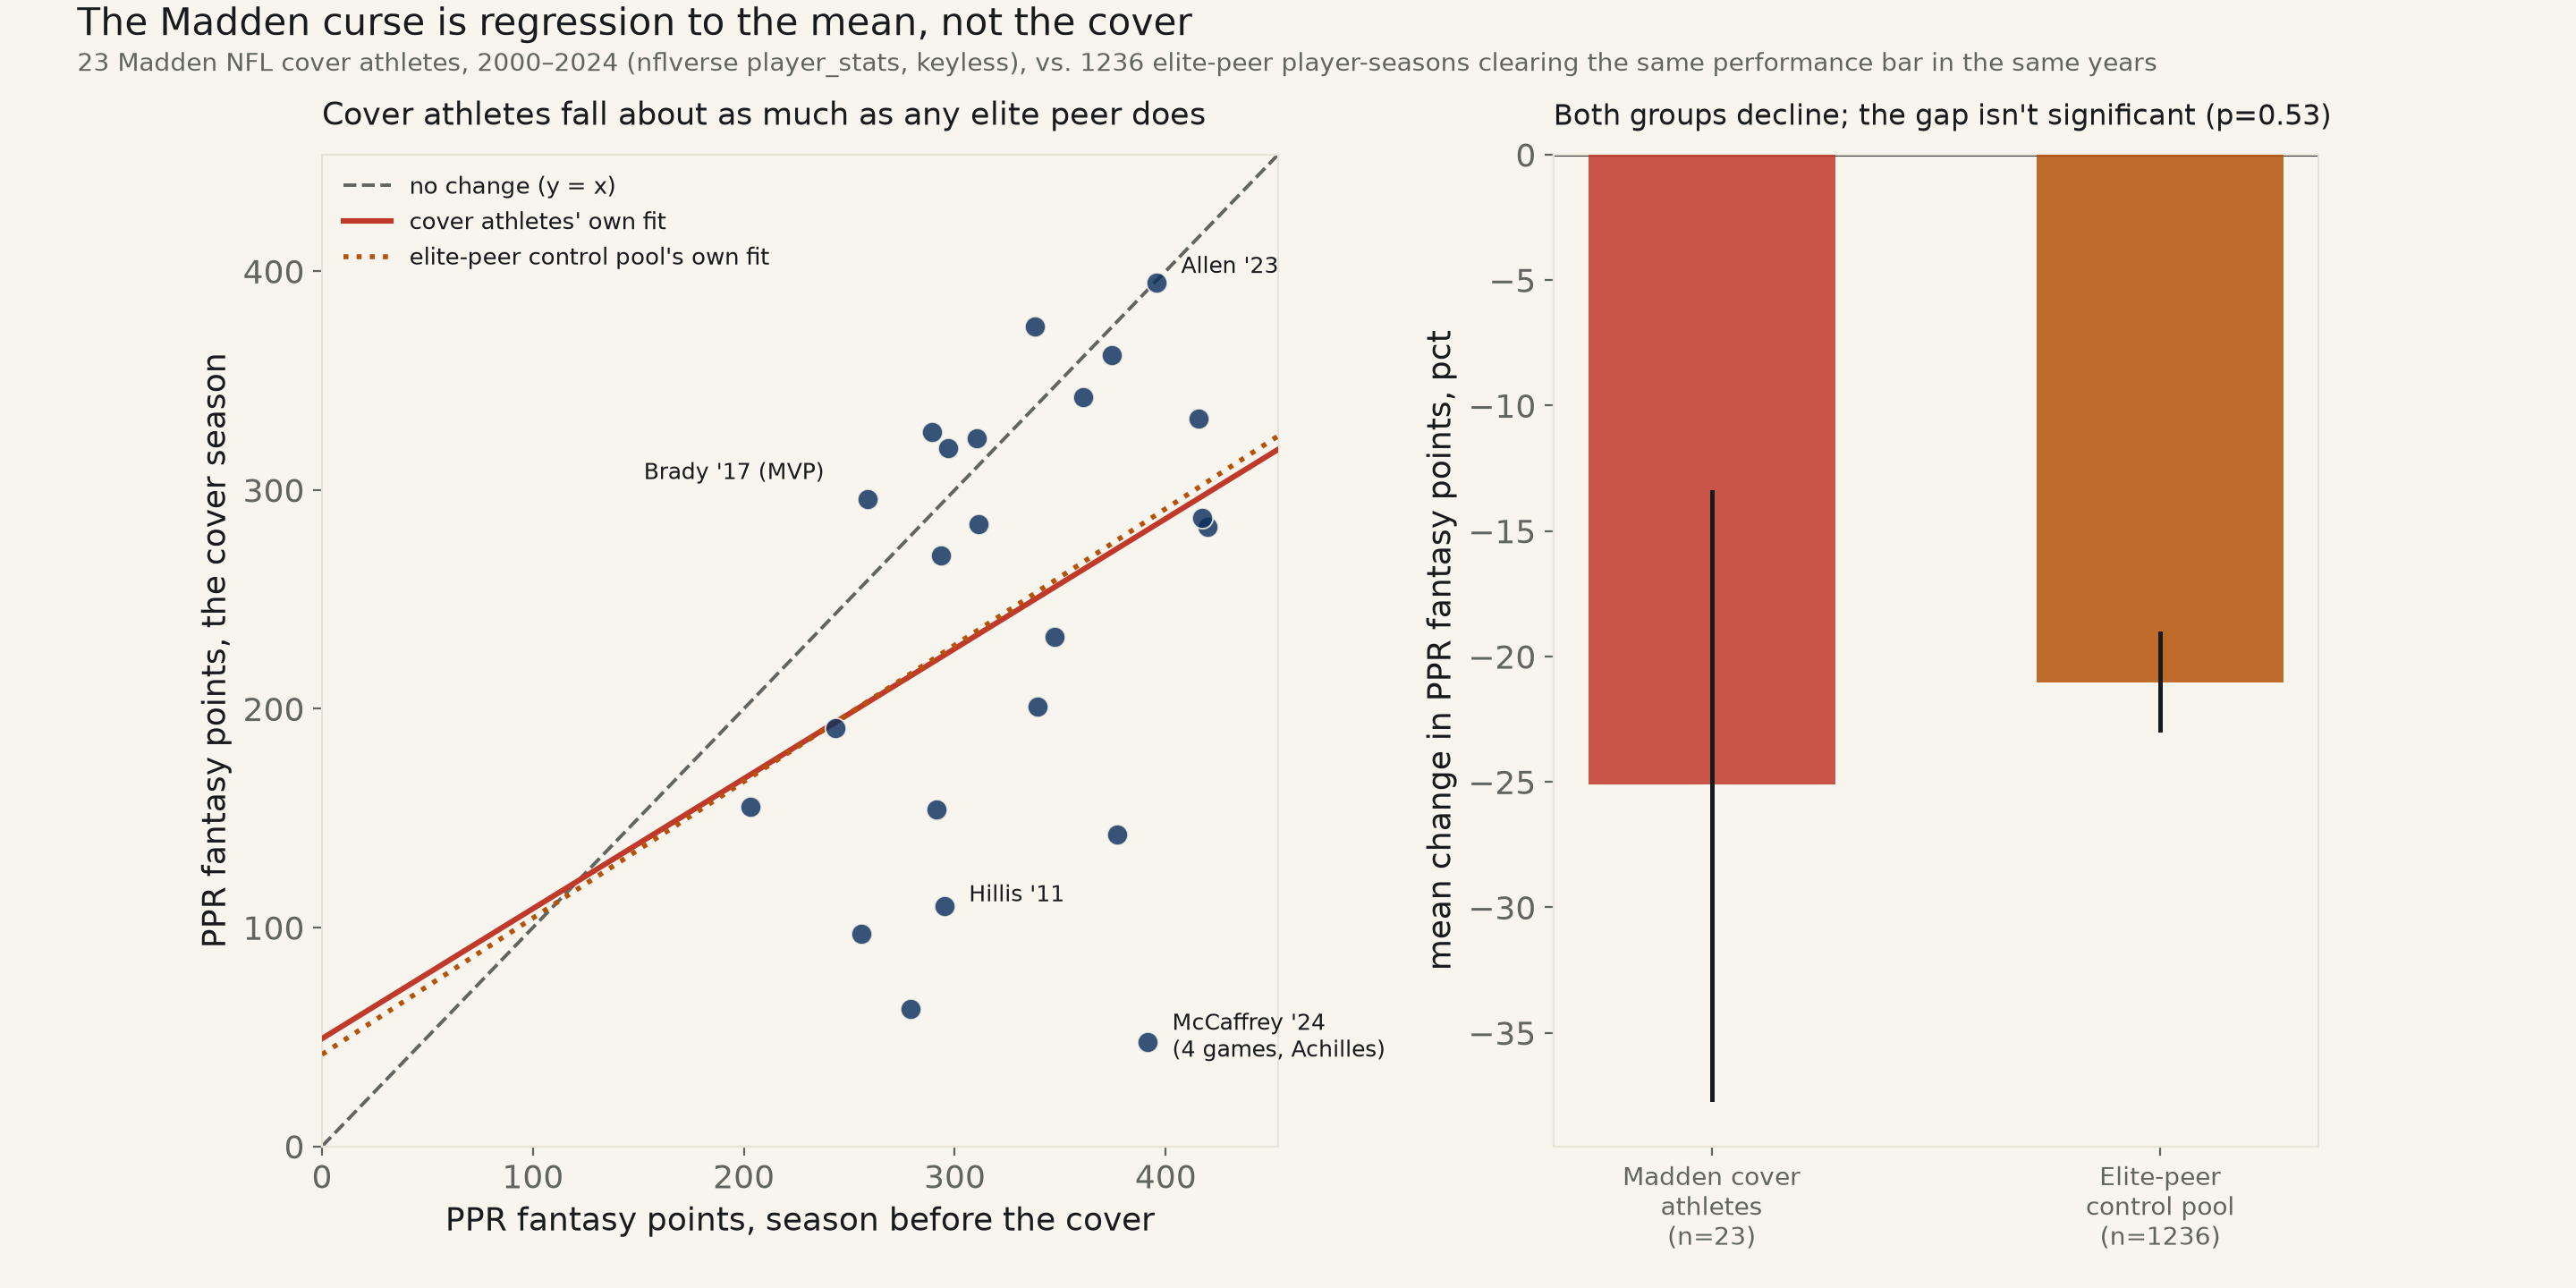
23 Madden NFL cover athletes, 2000–2024, vs. 1236 non-cover player-seasons just as elite, the same years. Cover athletes fall -25.1% the season the game is out, CI excludes zero — but so do their uncovered peers, -21.1%, and the gap between the two groups is not statistically real (p=0.53).
Backlog #42, scoped to Madden NFL only — Sports Illustrated covers span too many sports for one consistent performance metric to reach in a day. Every year since 2000, EA's Madden franchise has put a great NFL player's own season on its box, and sports media has tracked, almost as long, whether that player then gets hurt or falls off — the “Madden Curse.” The uninteresting explanation is regression to the mean: a player only makes the cover after an outlier great season, and outlier great seasons are, by definition, hard to repeat, cover or no cover. Testing that needs more than the cover athletes' own before/after numbers — it needs a comparison group of players who were just as good, the same years, who never came near the box art.
23 Madden NFL cover-athlete instances, 2000–2024 (X = the season that earned the cover, Y = the season the game was actually out; nflverse-data's own public player_stats release, keyless, fantasy_points_ppr as the cross-position performance measure). Three defensive cover athletes — Ray Lewis, Troy Polamalu, Richard Sherman — are structurally unmeasurable this way (the source carries offensive box-score stats only) and excluded, along with two retired-player throwback covers and John Madden's own 2023 tribute cover. Saquon Barkley's Madden 26 cover (2025 season) is named below but not fit, because nflverse has not yet published a 2025 season file — see fetch_maddencurse_555.py for the full exclusion list and every source.
Cover athletes really do decline the season the game is out: -25.1%, 95% CI [-37.6%, -13.4%] — excludes zero, a real drop. 18 of 23 (78%) posted fewer PPR fantasy points than the year before. But the identical test, run on 1236 other player-seasons that cleared the same performance bar — 203.3 PPR points, the least dominant cover athlete's own qualifying year — in the same 22 years, without ever being within a mile of the box art, finds almost the same thing: -21.1%, CI [-22.9%, -19.1%], 73.4% declined. A Welch t-test comparing the two groups' own pct change finds no distinguishable gap, p=0.53.
The regression version agrees. Pooling cover athletes and the control pool with a cover-athlete dummy and an interaction term (next-season PPR points on this-season PPR points, player-clustered SE, n=1259): the dummy itself is +7.2 points, 95% CI [-176.4, +190.8], p=0.94, and the interaction — whether the SLOPE of decline is any steeper for a cover athlete — is -0.029, CI [-0.598, +0.539], p=0.92. Both contain zero by a wide margin. The control pool's own fit puts next-season points at 0.624 times this-season points, CI [0.493, 0.754] — a real, sharp pull toward the mean that excludes both zero and 1, and has nothing to do with Madden. Cover athletes' own naive fit lands in the same neighborhood, 0.594, CI [-0.142, 1.330], p=0.11 — at n=23 this desk's own bar (a CI excluding zero) isn't cleared either way, but the point estimate is not distinguishable from the control pool's. Dropping each cover athlete's repeat appearance (Brady and Mahomes each cover twice; keep only the first, n=21): 0.512, CI [-0.229, 1.253] — same story.
Named. The single steepest fall in the sample is Christian McCaffrey's, 391→48 points (-87.8%) after a torn Achilles limited him to 4 games in 2024, the year Madden NFL 25 (the 2024 edition) had him on the cover. Peyton Hillis, the cover athlete most associated with the curse in the sports press, fell from 294.9 to 109.7 points (−62.8%) in 2011. But the single biggest RISE in the sample is also a cover athlete: Tom Brady's 258.6→295.9 (+14.4%) from 2016 to 2017, the year he won MVP unanimously — his 2016 total was itself suppressed by a four-game Deflategate suspension, so this is as much a games-played artifact as a real jump, stated plainly. Calvin Johnson, Madden NFL 13's cover athlete, is close to flat (360.7→342.4, −5.1%) despite 2012 being the season he broke the NFL's single-season receiving-yards record — a modest touchdown total that year kept his PPR total from showing it. Josh Allen, the most recent fully-measured cover athlete, is the closest thing to unchanged in the sample: 395.5→394.6, −0.2%.
Read plainly. The decline is real and it is large — roughly a quarter of a cover athlete's own PPR output, on average, is gone the following season. It happens to the control pool too, at a statistically indistinguishable rate, which is exactly what regression to the mean predicts for any player whose selection criterion is having just had an outlier great year. This is not proof that appearing on the cover has zero causal effect on a player's health or play — n=23 real cover instances is a small sample, and the is_cover coefficient's own confidence interval, [-176, +191] points, is wide enough that a real effect of a few points either way would not be detectable here — it is evidence that the decline itself, which is the entire basis for believing in a curse, is not particular to the cover. Season totals rather than per-game rates mean an injury-shortened season (McCaffrey, Hillis) reads as a bigger fall than a healthy season at a lower per-game rate would — deliberate, since “got hurt” is itself the folklore, but worth stating plainly. And fantasy_points_ppr has no defensive component, so this tests offensive skill-position cover athletes only; the three linebacker/safety/cornerback cover athletes in the franchise's history could not be measured this way at all.
| Specification | slope, next-season PPR pts per prior-season PPR pt | 95% CI | Verdict |
|---|---|---|---|
| Cover athletes, naive (n=23) | 0.594 | [-0.142, 1.330] | contains zero, p=0.108 |
| Cover athletes, HC3-robust SE | 0.594 | [-0.046, 1.234] | contains zero, p=0.069 |
| Cover athletes, first appearance only (n=21) | 0.512 | [-0.229, 1.253] | contains zero, p=0.164 |
| Elite-peer control pool (n=1236, player-clustered SE) | 0.624 | [0.493, 0.754] | excludes zero, p=0.000 |
Method. Cover-athlete list from Wikipedia's own Madden NFL article (the franchise's canonical cover-athlete-by-version navbox), cross-checked against contemporary sports press for the two ambiguous years (Madden 19's standard vs. Hall of Fame edition; Madden 22's dual cover). Performance is nflverse-data's own public player_stats season release, regular season only, fantasy_points_ppr — a single cross-position number aggregating passing, rushing, and receiving production, the standard way this exact question gets asked in the sports-analytics press. The elite-peer control pool is every non-cover player, in the same season a cover athlete qualified, whose own fantasy_points_ppr that year matched or beat the least dominant cover athlete's qualifying season (203.3 PPR points, Vince Young's 2006) — i.e., every other player who was, that year, at least as elite as the bar a Madden cover athlete himself cleared. A player who is a cover athlete in a DIFFERENT year still counts as a control-pool peer in a year he is not the cover athlete.
Limits, stated plainly. n=23 real cover instances is a small sample for this desk's own bar; the is_cover interaction test's own confidence interval is wide enough that a real effect of a few points either way would not be detectable here. Season totals, not per-game rates, mean an injury-shortened season reads as a bigger fall than a healthy one at a lower per-game rate would — deliberate, since “got hurt” is part of the folklore being tested, but it means this run cannot cleanly separate “played worse” from “played less.” fantasy_points_ppr carries no defensive statistics, so three real cover athletes (Ray Lewis, Troy Polamalu, Richard Sherman) could not be measured at all and are excluded — this tests offensive skill-position cover athletes only. Two cover athletes (Brady, Mahomes) appear twice as separate instances; the first-appearance-only robustness check above shows the result does not depend on that repetition.
madden_curse_555.csv · madden_curse_control_555.csv (1236 elite-peer player-seasons) · fit output (JSON).
| Player | Pos | Cover game | Prior season, PPR pts | Cover season, PPR pts | Change |
|---|---|---|---|---|---|
| Eddie George | RB | Madden NFL 2001 | 1999: 289.1 | 2000: 326.4 (16gp) | +12.9% |
| Daunte Culpepper | QB | Madden NFL 2002 | 2000: 339.2 | 2001: 201.1 (11gp) | -40.7% |
| Marshall Faulk | RB | Madden NFL 2003 | 2001: 419.7 | 2002: 283.0 (14gp) | -32.6% |
| Mike Vick | QB | Madden NFL 2004 | 2002: 279.1 | 2003: 62.9 (5gp) | -77.5% |
| Donovan McNabb | QB | Madden NFL 06 | 2004: 291.1 | 2005: 153.8 (9gp) | -47.2% |
| Shaun Alexander | RB | Madden NFL 07 | 2005: 376.8 | 2006: 142.4 (10gp) | -62.2% |
| Vince Young | QB | Madden NFL 08 | 2006: 203.3 | 2007: 155.3 (15gp) | -23.6% |
| Brett Favre | QB | Madden NFL 09 | 2007: 243.5 | 2008: 191.2 (16gp) | -21.5% |
| Larry Fitzgerald | WR | Madden NFL 10 | 2008: 311.4 | 2009: 284.2 (16gp) | -8.7% |
| Drew Brees | QB | Madden NFL 11 | 2009: 293.4 | 2010: 270.2 (16gp) | -7.9% |
| Peyton Hillis | RB | Madden NFL 12 | 2010: 294.9 | 2011: 109.7 (10gp) | -62.8% |
| Calvin Johnson | WR | Madden NFL 13 | 2011: 360.7 | 2012: 342.4 (16gp) | -5.1% |
| Adrian Peterson | RB | Madden NFL 25 (2013) | 2012: 347.4 | 2013: 232.7 (14gp) | -33.0% |
| Odell Beckham | WR | Madden NFL 16 | 2014: 297.0 | 2015: 319.3 (15gp) | +7.5% |
| Rob Gronkowski | TE | Madden NFL 17 | 2015: 255.6 | 2016: 97.0 (8gp) | -62.1% |
| Tom Brady | QB | Madden NFL 18 | 2016: 258.6 | 2017: 295.9 (16gp) | +14.4% |
| Antonio Brown | WR | Madden NFL 19 | 2017: 310.3 | 2018: 323.7 (15gp) | +4.3% |
| Patrick Mahomes | QB | Madden NFL 20 | 2018: 417.1 | 2019: 287.0 (14gp) | -31.2% |
| Lamar Jackson | QB | Madden NFL 21 | 2019: 415.7 | 2020: 332.8 (15gp) | -19.9% |
| Tom Brady | QB | Madden NFL 22 | 2020: 337.9 | 2021: 374.7 (17gp) | +10.9% |
| Patrick Mahomes | QB | Madden NFL 22 | 2020: 374.4 | 2021: 361.7 (17gp) | -3.4% |
| Josh Allen | QB | Madden NFL 24 | 2022: 395.5 | 2023: 394.6 (17gp) | -0.2% |
| Christian McCaffrey | RB | Madden NFL 25 (2024) | 2023: 391.3 | 2024: 47.8 (4gp) | -87.8% |
