51 US states + DC, 2020. Per-capita personal health care spending (CMS, state of residence) vs. life expectancy at birth (CDC/NCHS). Naive slope: +0.182 years per $1,000 spent, 95% CI [-0.158, +0.521] — contains zero, R²=0.023.
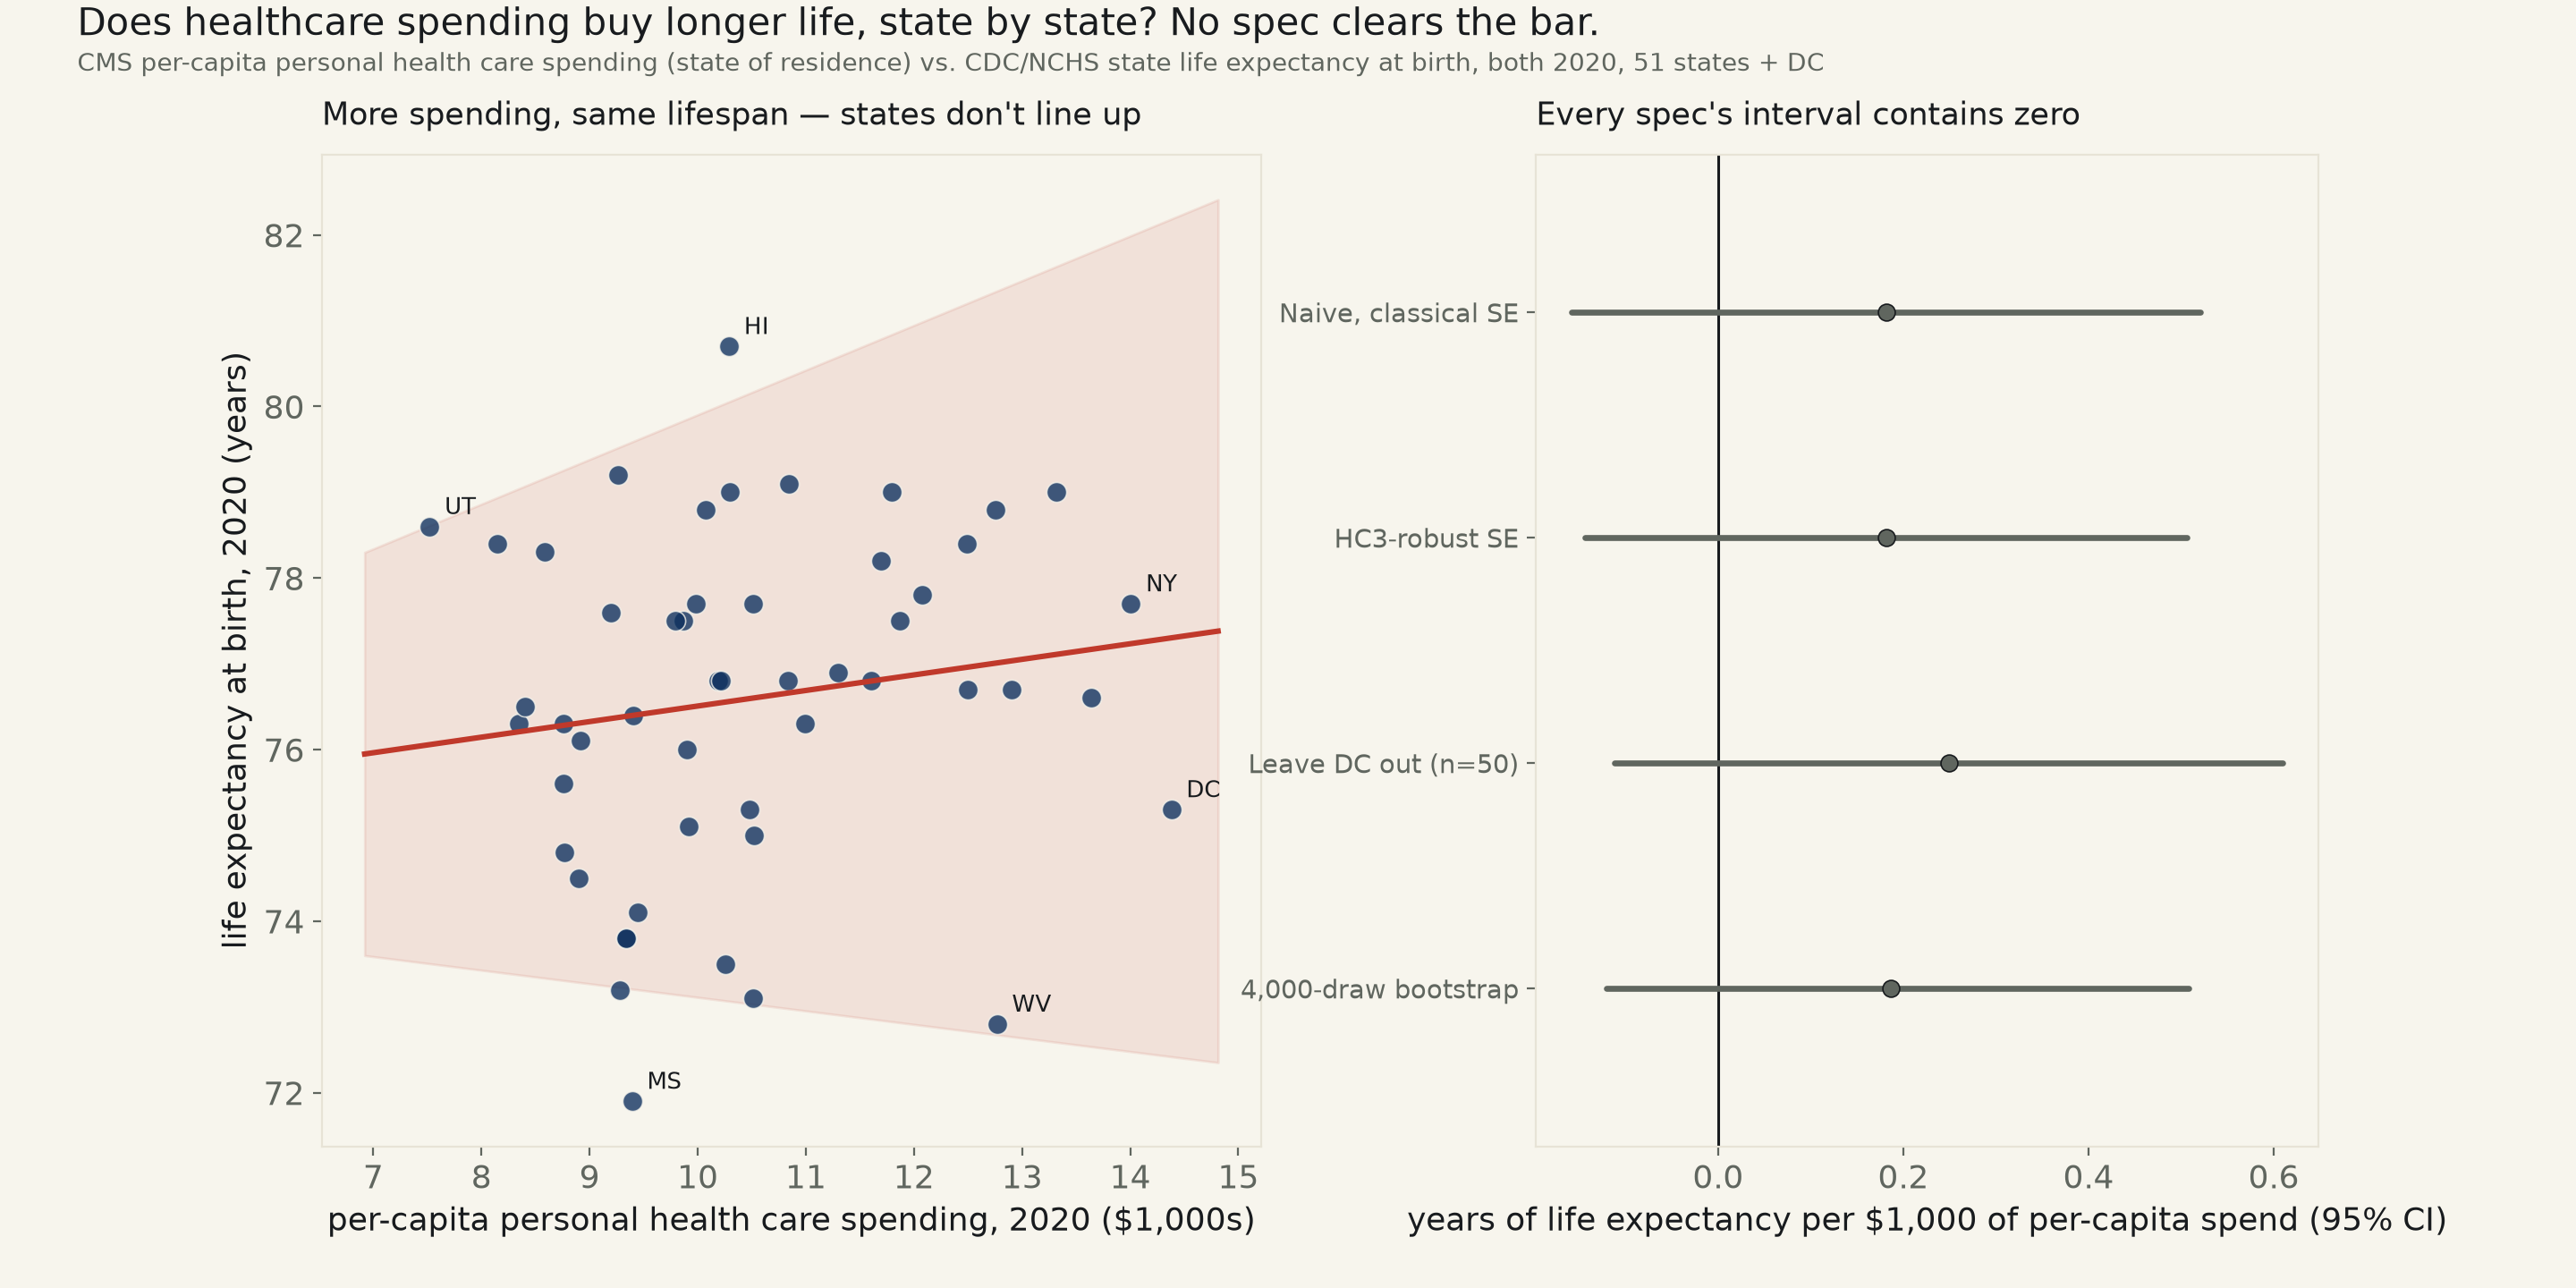
Backlog #75: the famous version of this claim is international — the US spends more per person on healthcare than any other country and gets middling life expectancy for it. This tests the same question one level down, inside the US: do the 51 states (and DC) that spend more per person on health care live longer, or does spending track something else entirely — age, income, chronic disease burden — that has nothing to do with whether the marginal dollar buys health? CMS's own official per-capita personal health care spending by state of residence, 2020, against CDC/NCHS's own official state life expectancy at birth, 2020 — the same calendar year, both government figures, both keyless pulls (see fetch_healthspend_554.py). This is a different confound from run 532's inequality-vs- life-expectancy result: that run held income roughly fixed and asked about distribution; this one asks about spending directly.
Naive: +0.182 years of life expectancy per $1,000 of per-capita spending, 95% CI [-0.158, +0.521], p=0.288, R²=0.023 — contains zero. An HC3-robust standard error agrees almost exactly: CI [-0.144, +0.507], p=0.274. A distribution-free Spearman rank correlation agrees too: ρ=0.191, p=0.180. R² under 0.03 means per-capita spending explains essentially none of the state-to-state spread in life expectancy.
DC is not driving the null, and dropping it does not manufacture a result. DC is the highest per-capita spender in the sample ($14,381) with below-average life expectancy (75.3 years) — not a state, and its small, federal-employment- heavy population is an obvious point to stress-test. Refit with DC removed (n=50): the point estimate actually rises to +0.249, CI [-0.112, +0.610], p=0.171 — still contains zero, on a fit that explains barely more variance (R²=0.039). A 4,000-draw bootstrap on the naive slope leans positive — 88.4% of resampled slopes come out above zero — but its own 95% interval, [-0.121, +0.509], still straddles it, short of this desk's bar.
Named, and the plainest way to see it without a regression at all: Utah spends the least per person of any state ($7,522) and posts a life expectancy of 78.6 years — well above the 51-state mean (76.6). District of Columbia spends the most ($14,381) and comes in at 75.3, below that mean. The single lowest life expectancy in the sample belongs to Mississippi (71.9 years), spending $9,394 per person — close to the 51-state median ($10,212), not a low spender at all. The single highest belongs to Hawaii (80.7 years), spending almost exactly the median too ($10,291). Spending is not sorting states into who lives longest.
Read plainly. Every specification tried — classical SE, HC3-robust SE, a distribution-free rank test, a leave-DC-out refit — lands on an interval that contains zero, and none explains more than a few percent of the state-to-state variance in life expectancy. This is not evidence that health spending is worthless (this cross-section cannot separate money spent on effective care from money spent treating a population that is already sicker, older, or poorer for reasons unrelated to spending — the reverse-causation problem stated below); it is evidence that, across US states in a single recent year, per-capita spending alone predicts almost nothing about how long people live.
| Specification | n | slope, years of life expectancy per $1,000 spend | 95% CI | Verdict |
|---|---|---|---|---|
| Naive, classical SE (n=51) | n=51 | +0.182 | [-0.158, +0.521] | contains zero, p=0.288 |
| HC3-robust SE | n=51 | +0.182 | [-0.144, +0.507] | contains zero, p=0.274 |
| Leave DC out (n=50) | n=50 | +0.249 | [-0.112, +0.610] | contains zero, p=0.171 |
Method. Spending is CMS's own "state of residence" adjustment to its National Health Expenditure Accounts — personal health care spending attributed to where the patient lives, not where the provider is located, so a state with a famous hospital system that treats many out-of-state patients is not credited with spending it did not actually do on its own residents. Life expectancy is CDC/NCHS's own official state life expectancy at birth release for 2020, sexes combined. Both series are the government's own published numbers for the identical calendar year, joined on state name with no interpolation.
Limits, stated plainly. This is a single-year cross-section, not a panel, and it cannot separate cause from reverse cause: a state with an older, sicker, or poorer population would be expected to spend more on health care for reasons that have nothing to do with whether that spending extends life, which would bias the slope toward zero or even negative exactly when spending is "working as intended" (treating people who would otherwise die sooner). No control for the state's poverty rate, obesity, smoking, or insurance coverage rate is included — any of which could explain both sides of this relationship independently. n=51 with one point (DC) far outside the range of the other 50 is thin for a design this blunt; the leave-DC-out check above is the stress test that thinness demands, and the result does not move toward significance either way.
health_spending_life_expectancy_554.csv · fit output (JSON).
| State | per-capita health spend, 2020 | life expectancy, 2020 (yrs) |
|---|---|---|
| Utah | $7,522 | 78.6 |
| Idaho | $8,148 | 78.4 |
| Nevada | $8,348 | 76.3 |
| Texas | $8,406 | 76.5 |
| Colorado | $8,583 | 78.3 |
| Arizona | $8,756 | 76.3 |
| Georgia | $8,758 | 75.6 |
| South Carolina | $8,766 | 74.8 |
| New Mexico | $8,902 | 74.5 |
| North Carolina | $8,917 | 76.1 |
| Virginia | $9,195 | 77.6 |
| Washington | $9,265 | 79.2 |
| Alabama | $9,280 | 73.2 |
| Tennessee | $9,336 | 73.8 |
| Arkansas | $9,338 | 73.8 |
| Mississippi | $9,394 | 71.9 |
| Kansas | $9,408 | 76.4 |
| Oklahoma | $9,444 | 74.1 |
| Iowa | $9,789 | 77.5 |
| Florida | $9,865 | 77.5 |
| Michigan | $9,897 | 76.0 |
| Missouri | $9,921 | 75.1 |
| Wisconsin | $9,982 | 77.7 |
| Oregon | $10,071 | 78.8 |
| Illinois | $10,190 | 76.8 |
| Montana | $10,212 | 76.8 |
| Kentucky | $10,257 | 73.5 |
| Hawaii | $10,291 | 80.7 |
| California | $10,299 | 79.0 |
| Ohio | $10,478 | 75.3 |
| Nebraska | $10,514 | 77.7 |
| Louisiana | $10,515 | 73.1 |
| Indiana | $10,517 | 75.0 |
| Maryland | $10,839 | 76.8 |
| Minnesota | $10,846 | 79.1 |
| Wyoming | $10,989 | 76.3 |
| North Dakota | $11,301 | 76.9 |
| Pennsylvania | $11,603 | 76.8 |
| Rhode Island | $11,694 | 78.2 |
| New Hampshire | $11,793 | 79.0 |
| New Jersey | $11,868 | 77.5 |
| Maine | $12,077 | 77.8 |
| Connecticut | $12,489 | 78.4 |
| South Dakota | $12,495 | 76.7 |
| Vermont | $12,756 | 78.8 |
| West Virginia | $12,769 | 72.8 |
| Delaware | $12,899 | 76.7 |
| Massachusetts | $13,319 | 79.0 |
| Alaska | $13,642 | 76.6 |
| New York | $14,007 | 77.7 |
| District of Columbia | $14,381 | 75.3 |
