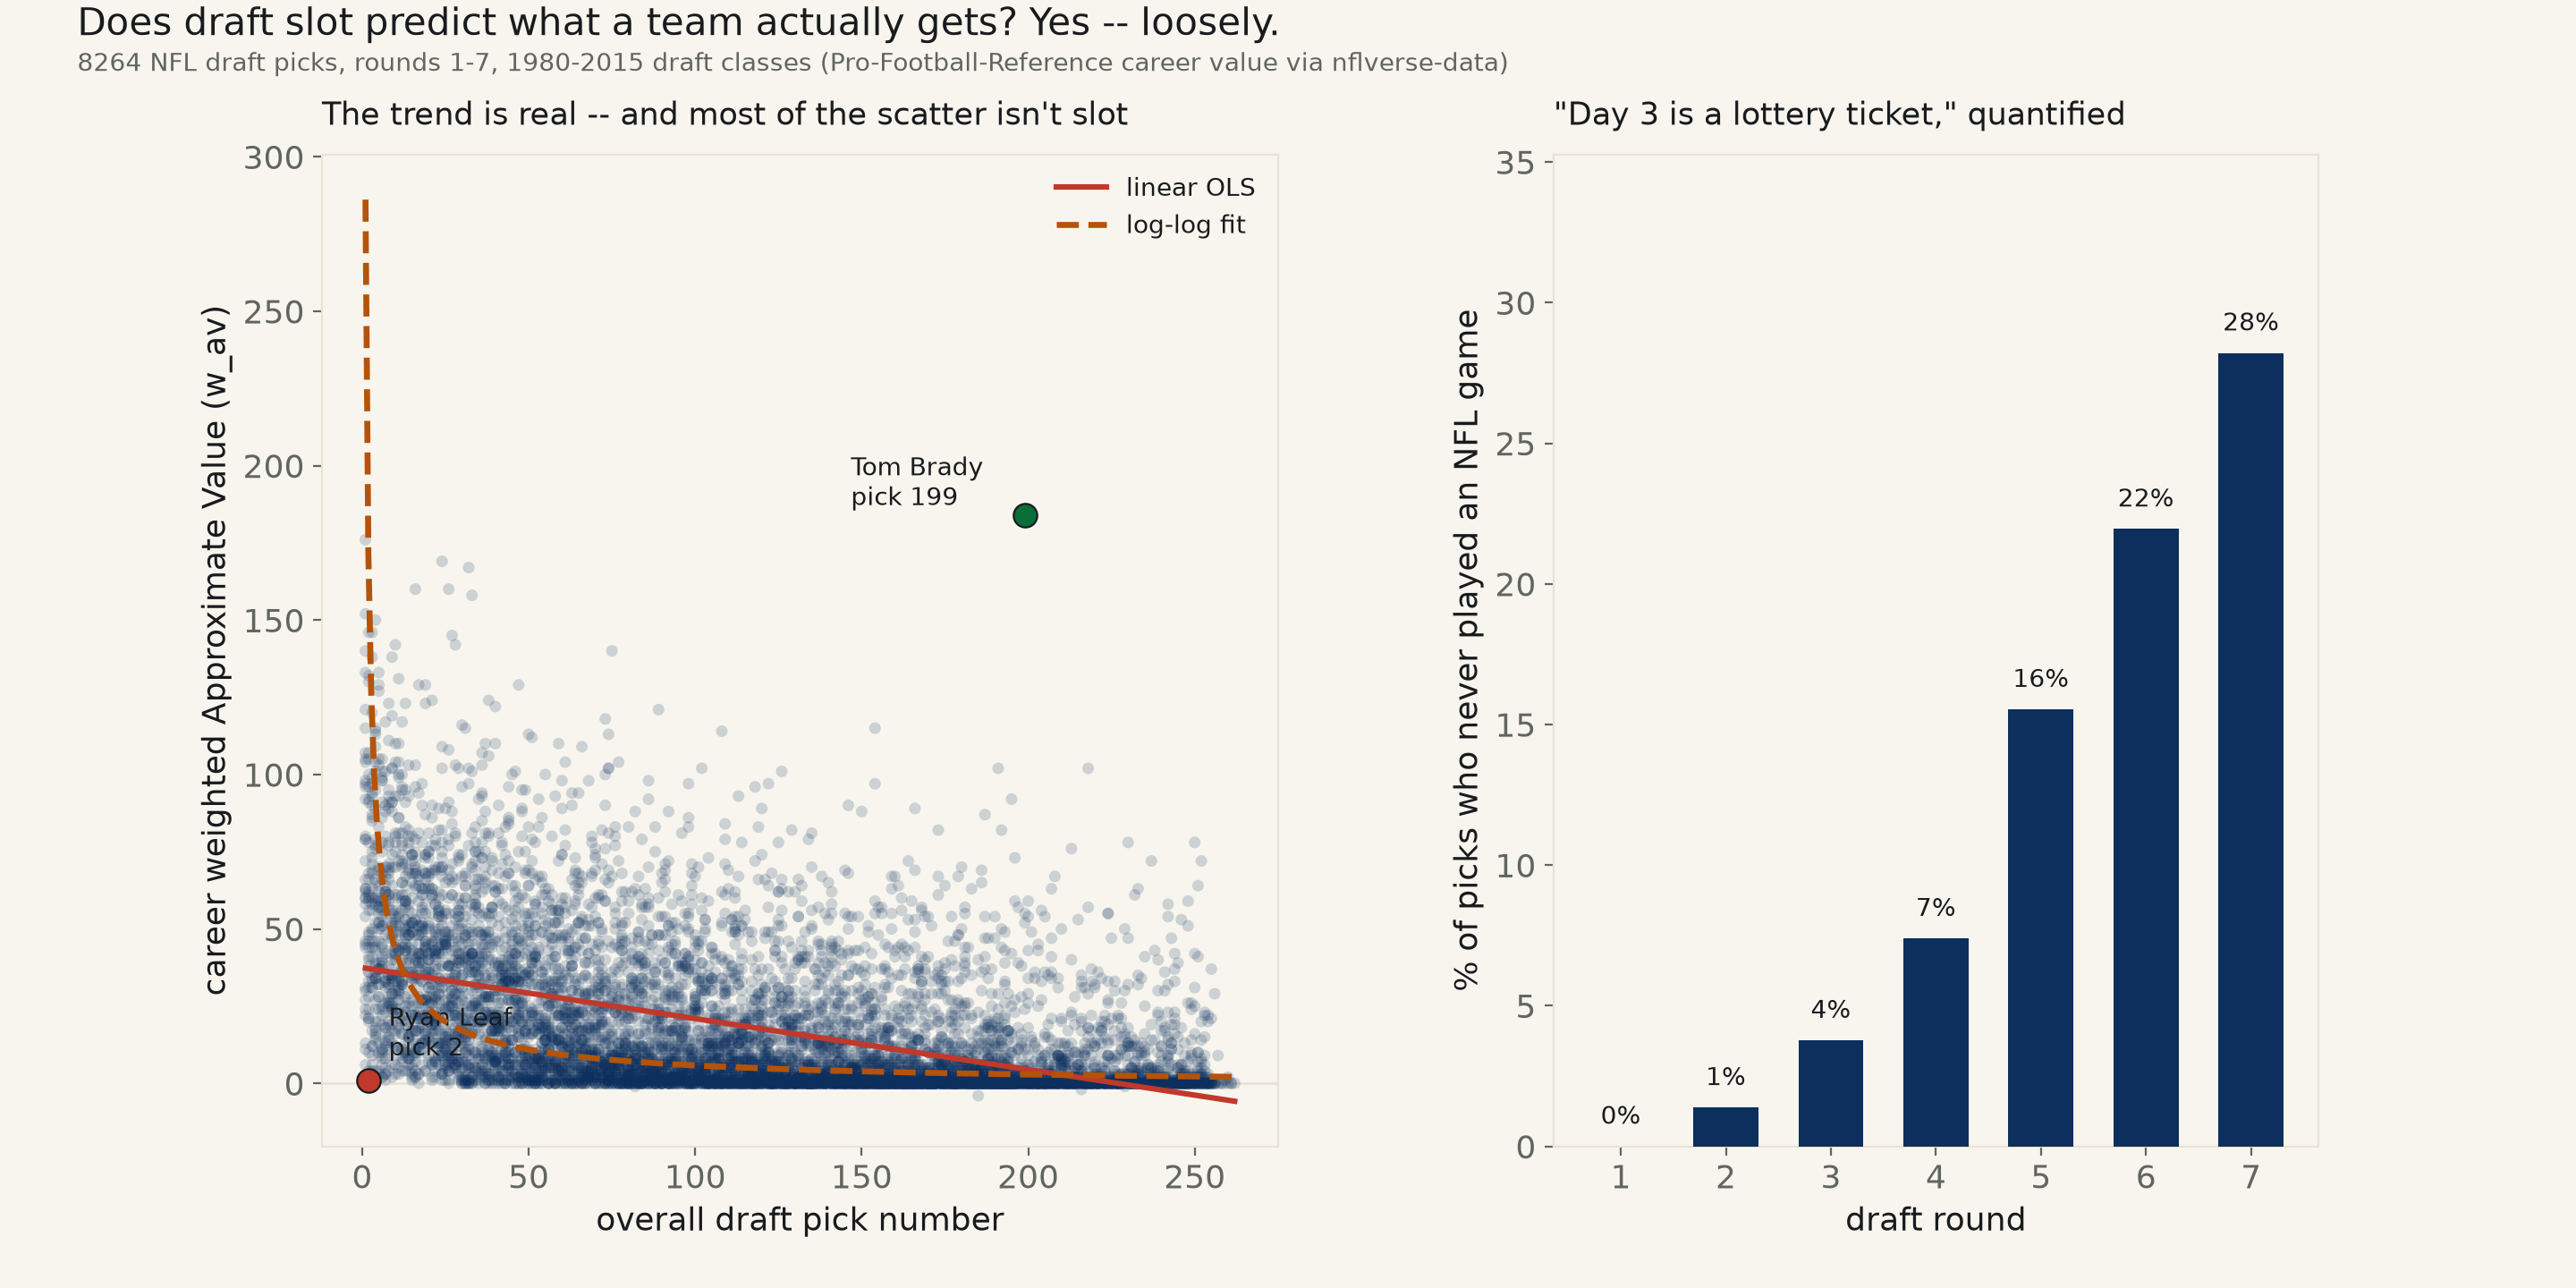
8,264 NFL draft picks, rounds 1-7, 1980-2015 draft classes. Career value (Pro-Football-Reference's weighted Approximate Value) vs. overall pick number. Naive slope: -0.165 points per pick, 95% CI [-0.172, -0.159] — excludes zero, but explains only R²=0.23 of the variance.
Backlog #44 asks whether tanking works — whether losing on purpose for a high draft pick actually pays off in future team wins. Testing that literally means tracking each of 32 franchises' win totals across 46 years of relocations, and this exact source's own team codes collide across eras for at least four franchises: 'STL' means both the Cardinals (1980-87) and the Rams (1995-2015); 'BAL' means both the Colts (1980-83) and the Ravens (1996-present); the NFL's own official lineage treats the 1980-95 Cleveland Browns and the 1996-present Baltimore Ravens as the same franchise, with 'Cleveland Browns' handed to an unrelated 1999 expansion team; 'HOU' means both the original Oilers (now the Tennessee Titans) and an unrelated 2002 Houston Texans expansion team. Resolving that identity graph correctly is a real research task, not a same-day pull, and getting it wrong would silently mis-attribute years of wins to the wrong franchise. So this run tests the mechanism behind the claim instead: what a team actually gets, in real career value, for a given pick, using Pro-Football-Reference's own weighted career Approximate Value (w_av) for every player drafted, 8,264 picks, rounds 1-7, 1980-2015 draft classes (old enough that career value isn't cut short by an incomplete career).
Naive: every pick later in the draft costs a team 0.165 points of career w_av, 95% CI [-0.172, -0.159], p<0.001, R²=0.226 — excludes zero, on a sample of 8,264 picks. An HC3-robust standard error agrees almost exactly: CI [-0.172, -0.158]. A 4,000-draw bootstrap on the naive slope agrees too (CI [-0.173, -0.158], 100% of resampled slopes negative). The NFL's own trade-value charts (the sport's answer to "how many late picks is one early pick worth") assume value decays as a curve, not a straight line, and the data agrees: a log-log fit — value as a power of pick number — fits better, R²=0.275 against 0.226, elasticity -0.813 (CI [-0.841, -0.784]) — each doubling of pick number tracks with roughly a 43% cut in expected career value.
The trend is real; predicting any one pick from it is close to a coin flip. An R² under 0.3 under either spec means more than 70% of the variation in what a team gets from a specific pick has nothing to do with where in the draft it fell. Round 1 (picks 1-32) averages 44.9 career w_av points against 6.5 for round 7 — real, and the gap between "Day 1" (round 1) and "Day 3" (rounds 4-7) is 35.1 points, 95% CI [33.2, 37.0], p<0.001 — but a median round-1 pick still only clears 40 points of career value, and the individual scatter around every round's mean dwarfs the gap between rounds.
Named, and this is the whole argument in two players. Tom Brady, taken 199th overall in round 6 — a pick teams treat as barely worth a roster spot — put up 184 career w_av points, more than any other player in this 8,264-pick sample and roughly 4.1x the average round-1 pick's career output. Ryan Leaf, the 2nd overall pick in 1998 — a slot that averages 45 points of career value — recorded 1. Neither is cherry-picked: 11.9% of all 8,264 picks in this sample never played a single NFL game, rising from 0% in round 1 to 28% by round 7 — a quantified version of the "Day 3 is a lottery ticket" line NFL draft coverage repeats every April.
Read plainly. The claim that draft slot matters is confirmed, not debunked: the slope excludes zero under a classical SE, an HC3-robust SE, and a 4,000-draw bootstrap, and a log-log spec shows the decay is curved the way trade-value charts already assume. What does not survive is the stronger, unstated version of the claim — that slot is close to destiny for an individual pick. It explains at most a quarter to a third of the variance; the rest is exactly the kind of thing a team hoping a bad season buys a sure thing should sit with.
| Specification | n | slope (w_av per pick, or log-log elasticity) | 95% CI | Fit | Verdict |
|---|---|---|---|---|---|
| Naive linear, classical SE | n=8264 | -0.165 | [-0.172, -0.159] | R²=0.226 | excludes zero, p=<0.001 |
| Naive linear, HC3-robust SE | n=8264 | -0.165 | [-0.172, -0.158] | R²=0.226 | excludes zero, p=<0.001 |
| Log-log (elasticity) | n=8264 | -0.813 | [-0.841, -0.784] | R²=0.275 | excludes zero, p=<0.001 |
| Round | pick range | n | mean career w_av | median career w_av | never played a game |
|---|---|---|---|---|---|
| Round 1 | picks 1–32 | 1,077 | 44.9 | 40.0 | 0.0% |
| Round 2 | picks 26–65 | 1,088 | 28.8 | 23.0 | 1.4% |
| Round 3 | picks 54–103 | 1,141 | 19.2 | 10.0 | 3.8% |
| Round 4 | picks 82–140 | 1,177 | 14.4 | 7.0 | 7.4% |
| Round 5 | picks 110–176 | 1,165 | 10.6 | 3.0 | 15.5% |
| Round 6 | picks 138–217 | 1,230 | 8.1 | 2.0 | 22.0% |
| Round 7 | picks 166–262 | 1,386 | 6.5 | 1.0 | 28.2% |
Method. w_av is Pro-Football-Reference's own weighted career Approximate Value, a single number meant to compare a career's total on-field contribution across positions and eras; it is PFR's metric as published, not something computed here. Missing w_av in this source means the player never appears in an NFL game log at all (verified against the source's own 'games' field) — recoded to 0 rather than dropped, since dropping those rows would understate bust rates most exactly where busts are most common, in the late rounds. Four players (of 8,264) carry a negative w_av, PFR's own allowance for a below-replacement-level career in limited action; kept as-is in the linear specs, floored at zero only for the log transform, which cannot take a negative input. Rounds 8-12 (which existed only through the 1993 draft, before the league moved to a 7-round structure in 1994) are excluded so every pick number sits on one consistent, still-current scale. Draft classes after 2015 are excluded so career value is not still accumulating for active players, which would understate recent classes relative to older ones.
Limits, stated plainly. This measures what a team got from a slot, not whether tanking specifically works — the team-identity problem in the opening paragraph is why the original question, framed around wins, is not tested here. w_av blends every position onto one scale using PFR's own formula, which by design cannot fully separate a quarterback's value from a long-snapper's; this run treats that scale as given, the same way it treats any other single published metric. A pick's owner (the team that actually used it, as opposed to traded it away beforehand) is not tracked, so this cannot say which specific franchise benefited from a given pick's value, only what value existed at that slot in that draft.
