32 current NFL franchises, 2020-2024 regular season. Home-field advantage (home scoring margin minus away scoring margin, netting out team quality) vs. real home-city elevation. Naive slope: +0.75 points per 1,000 ft, 95% CI [-0.25, +1.75] — contains zero. Denver's own home-field edge ranks only 6th in the league.
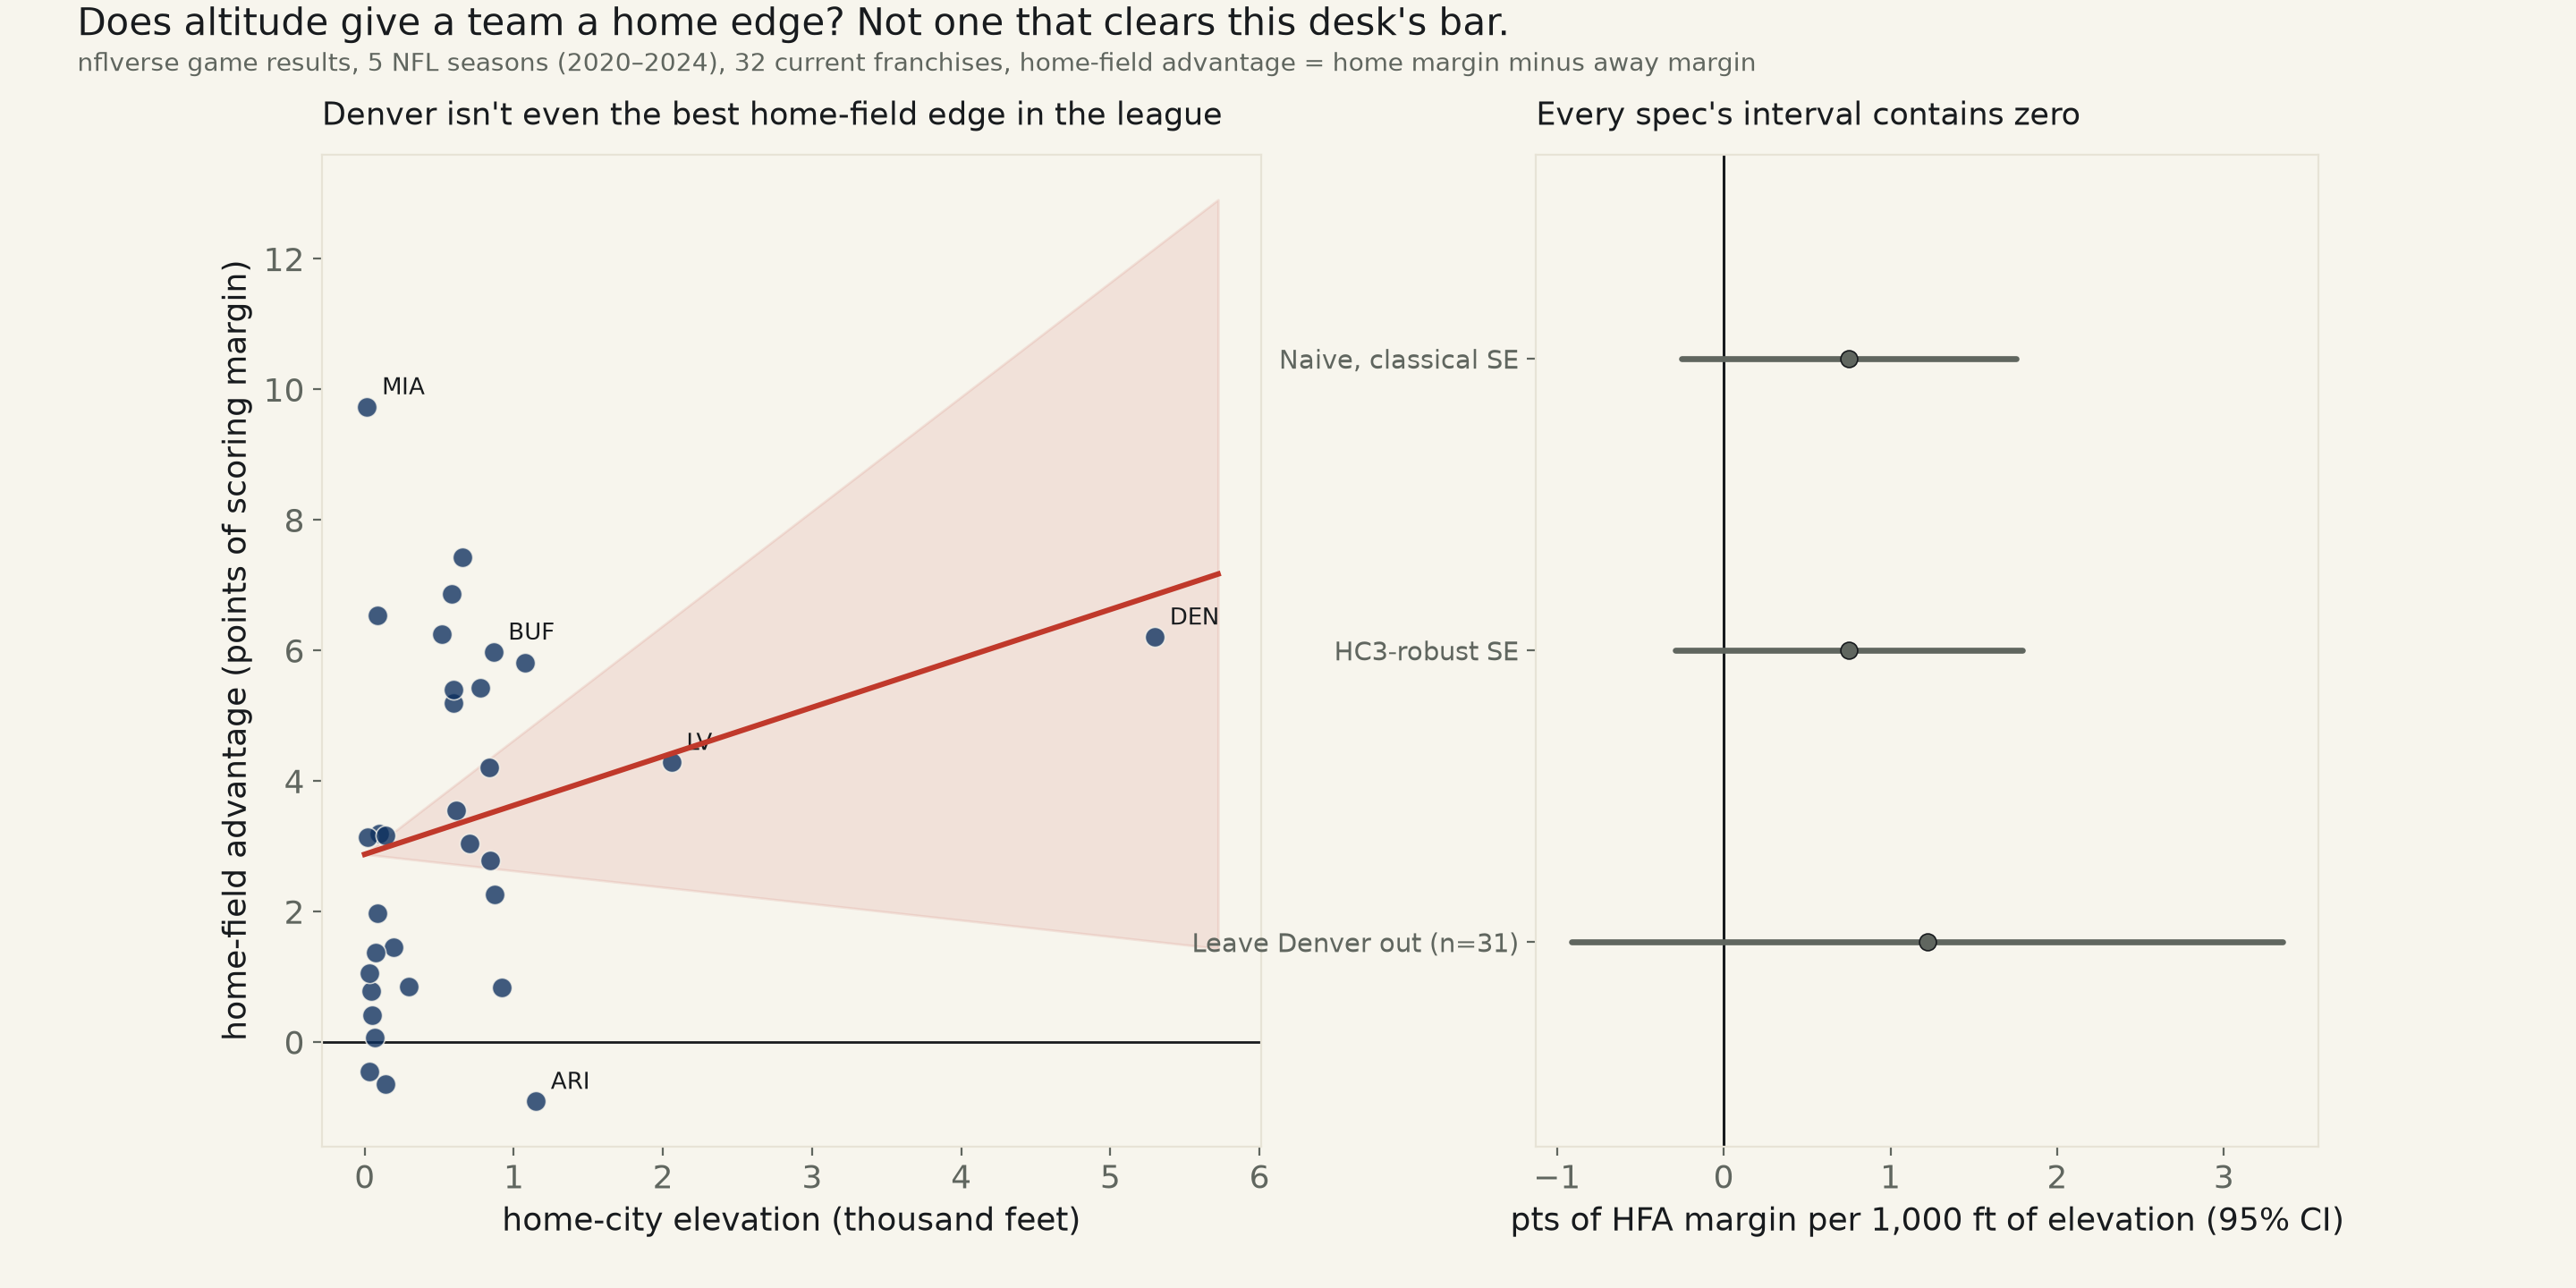
Backlog #48: does altitude give a team a real home edge — the thin-air-and-tired-visitors story attached to the Denver Broncos for decades — or is "the Mile High advantage" a label bolted onto a team that would be tough at home anyway? Home-field advantage (HFA) is defined per team as its own mean home scoring margin minus its own mean away scoring margin, 2020-2024 regular season (the window during which all 32 current franchises played at their present stadium — the Raiders' move to Las Vegas and the Rams' and Chargers' shared move into SoFi Stadium all landed in 2020), so a team that is simply good does not score a big number by construction: that shows up on both the home and the away side and cancels. Real elevation for each team's home city, fetched live from Open-Meteo's keyless geocoding and forecast APIs, the same source run 542 used for city elevation; real game scores from nflverse-data's own public schedule release, the same source family run 543 used.
Naive: +0.75 points of HFA margin per 1,000 ft of home-city elevation, 95% CI [-0.25, +1.75], p=0.137, R²=0.072 — contains zero. An HC3-robust standard error agrees almost exactly: CI [-0.29, +1.79], p=0.157. A distribution-free Spearman rank correlation agrees too: ρ=0.252, p=0.164. A second, independent dependent variable — home-field win rate instead of scoring margin — tells the same story: +2.43 points of win-rate HFA per 1,000 ft, CI [-0.71, +5.58], p=0.124. A 4,000-draw bootstrap on the naive slope leans the claimed direction — 96.4% of resampled slopes are positive — but its own 95% interval, [-0.21, +3.27], still contains zero, short of this desk's bar.
Denver is not driving even this weak, non-significant lean, and dropping it does not kill the result — because there wasn't one to kill. Denver sits at 5,299 ft, more than 2.5x the next-highest current stadium (Las Vegas, 2,057 ft) and almost 10x the 32-team median (551 ft) — textbook leverage-point territory for an OLS fit. Refit with Denver removed entirely (n=31): the slope does not collapse, it actually rises to +1.22, CI [-0.91, +3.35], p=0.251 — still contains zero, on a wider interval, from a weaker fit (R²=0.045 vs. 0.072 with Denver in). Whatever thin positive lean exists in this data is not a Denver-shaped artifact; it just never gets anywhere near significant either way.
Named, and the plainest way to see it without a regression at all: Denver's own HFA, +6.21 points, ranks only 6th of 32 teams. The single largest home-field edge in the league belongs to Miami (MIA), +9.73 points, playing at essentially sea level (16 ft). Arizona, whose stadium sits at 1,148 ft — the third-highest current elevation in the sample, well above the median — posts the single WORST home-field number of any of the 32 teams, -0.91 points, a losing edge at home. Altitude is not sorting teams the way the folk claim needs it to.
Read plainly. Every specification tried — classical SE, HC3-robust SE, a distribution-free rank test, a second dependent variable, a leave-Denver-out refit — lands on an interval that contains zero. The point estimate leans the claimed direction in every one of them, and the bootstrap's own resampled slopes lean positive 96% of the time, so this is not reported as "no relationship at all whatsoever" — it is reported as what it is: a small, positively-leaning, statistically unconfirmable nudge, on a sample of 32 teams where the single team the claim is actually about is also the single most extreme leverage point in the data, and removing that exact point does not even move the result toward zero.
| Specification | n | slope, pts HFA margin per 1,000 ft elevation | 95% CI | Verdict |
|---|---|---|---|---|
| Naive, classical SE (n=32) | n=32 | +0.75 | [-0.25, +1.75] | contains zero, p=0.137 |
| HC3-robust SE | n=32 | +0.75 | [-0.29, +1.79] | contains zero, p=0.157 |
| Leave Denver out | n=31 | +1.22 | [-0.91, +3.35] | contains zero, p=0.251 |
Method. Home-field advantage per team = mean(home score − away score) across that team's true home games minus mean(away score − home score) across that team's true road games, 2020-2024 regular season only, both sides restricted to nflverse's own "Home" location flag (excludes the handful of neutral-site/international games). This nets out team quality: a team that outscores everyone shows a large number on both the home and road side of the subtraction, which cancels, leaving only the specifically-home component. Elevation is each team's home city's real elevation, fetched live from Open-Meteo's geocoding API (city match) and forecast API (the model grid's own elevation at that point, the same technique run 542 used for boiling point vs. altitude) — not a hand-typed number. Team-to-city is a compiled join (which city each of the 32 current franchises plays home games in, from Wikipedia's own current-stadium list), not a measured or fitted quantity.
Limits, stated plainly. n=32 is small, and by the nature of the claim, badly imbalanced on the X axis: Denver alone sits past 5,000 ft while every other current stadium sits under 2,100 ft, so this design has real power to detect a Denver-sized effect only if Denver's own number is unusual, and it is not (rank 6 of 32). Five NFL seasons is roughly 41 home games per team — plenty for a team-quality estimate, thin for isolating a stadium-specific effect from ordinary season-to-season variance in roster strength, injuries and schedule strength, none of which this design controls for. The five-year window is fixed by stadium stability (every current franchise's present venue), not chosen to flatter or defeat the result.
stadium_altitude_hfa_552.csv · fit output (JSON).
| Team | Home city | elevation (ft) | home margin | away margin | HFA (margin) | HFA (win%) |
|---|---|---|---|---|---|---|
| DEN | Denver, Colorado | 5299 | +1.52 | -4.68 | +6.21 | +18.3% |
| LV | Paradise, Nevada | 2057 | -0.90 | -5.19 | +4.29 | +4.8% |
| ARI | Glendale, Arizona | 1148 | -1.17 | -0.26 | -0.91 | -6.2% |
| ATL | Atlanta, Georgia | 1073 | -0.29 | -6.10 | +5.80 | +9.8% |
| KC | Kansas City, Missouri | 919 | +6.24 | +5.40 | +0.84 | -0.5% |
| CIN | Cincinnati, Ohio | 873 | +2.20 | -0.07 | +2.27 | +6.1% |
| BUF | Orchard Park, New York | 863 | +12.65 | +6.67 | +5.98 | +22.5% |
| MIN | Minneapolis, Minnesota | 843 | +1.68 | -1.10 | +2.78 | +7.3% |
| CAR | Charlotte, North Carolina | 833 | -4.56 | -8.76 | +4.20 | +7.9% |
| PIT | Pittsburgh, Pennsylvania | 774 | +3.00 | -2.43 | +5.43 | +9.5% |
| IND | Indianapolis, Indiana | 702 | +1.07 | -1.98 | +3.05 | +3.7% |
| CLE | Cleveland, Ohio | 656 | +1.40 | -6.02 | +7.43 | +27.8% |
| DAL | Arlington, Texas | 614 | +5.29 | +1.74 | +3.55 | +11.9% |
| DET | Detroit, Michigan | 597 | +2.95 | -2.24 | +5.19 | +0.0% |
| GB | Green Bay, Wisconsin | 597 | +7.83 | +2.42 | +5.40 | +18.1% |
| CHI | Chicago, Illinois | 584 | -0.49 | -7.36 | +6.87 | +10.5% |
| TEN | Nashville, Tennessee | 518 | +1.39 | -4.86 | +6.25 | +8.4% |
| NE | Foxborough, Massachusetts | 299 | -0.66 | -1.51 | +0.85 | -2.4% |
| SEA | Seattle, Washington | 194 | +1.86 | +0.40 | +1.46 | -2.7% |
| LA | Inglewood, California | 138 | +2.71 | -0.45 | +3.17 | +7.1% |
| LAC | Inglewood, California | 138 | +0.02 | +0.67 | -0.64 | +0.0% |
| BAL | Baltimore, Maryland | 95 | +8.17 | +4.98 | +3.19 | +0.9% |
| NYG | East Rutherford, New Jersey | 85 | -5.45 | -7.42 | +1.97 | +10.6% |
| NYJ | East Rutherford, New Jersey | 85 | -3.74 | -10.28 | +6.54 | +5.8% |
| SF | Santa Clara, California | 75 | +5.21 | +3.83 | +1.38 | -2.1% |
| WAS | Landover, Maryland | 66 | -2.60 | -2.66 | +0.06 | -3.5% |
| PHI | Philadelphia, Pennsylvania | 52 | +3.44 | +3.02 | +0.42 | +3.9% |
| HOU | Houston, Texas | 46 | -3.88 | -4.67 | +0.79 | -2.4% |
| NO | New Orleans, Louisiana | 33 | +1.50 | +1.95 | -0.45 | +0.0% |
| TB | Tampa, Florida | 33 | +5.17 | +4.12 | +1.05 | +1.5% |
| JAX | Jacksonville, Florida | 20 | -4.32 | -7.45 | +3.13 | +11.7% |
| MIA | Miami Gardens, Florida | 16 | +6.31 | -3.42 | +9.73 | +24.0% |
