84 fiscal years of real federal outlay growth (OMB's own historical table) against which party controlled the Senate, House and presidency (Wikipedia's sourced party-control table). Naive, HAC-robust slope: -10.27 points, 95% CI [-22.56, +2.02] — contains zero. The interval only clears zero if you use a standard error that ignores autocorrelation, or drop WWII and COVID by name — and even then, the modern (1978-2025) budget era alone reverses the sign.
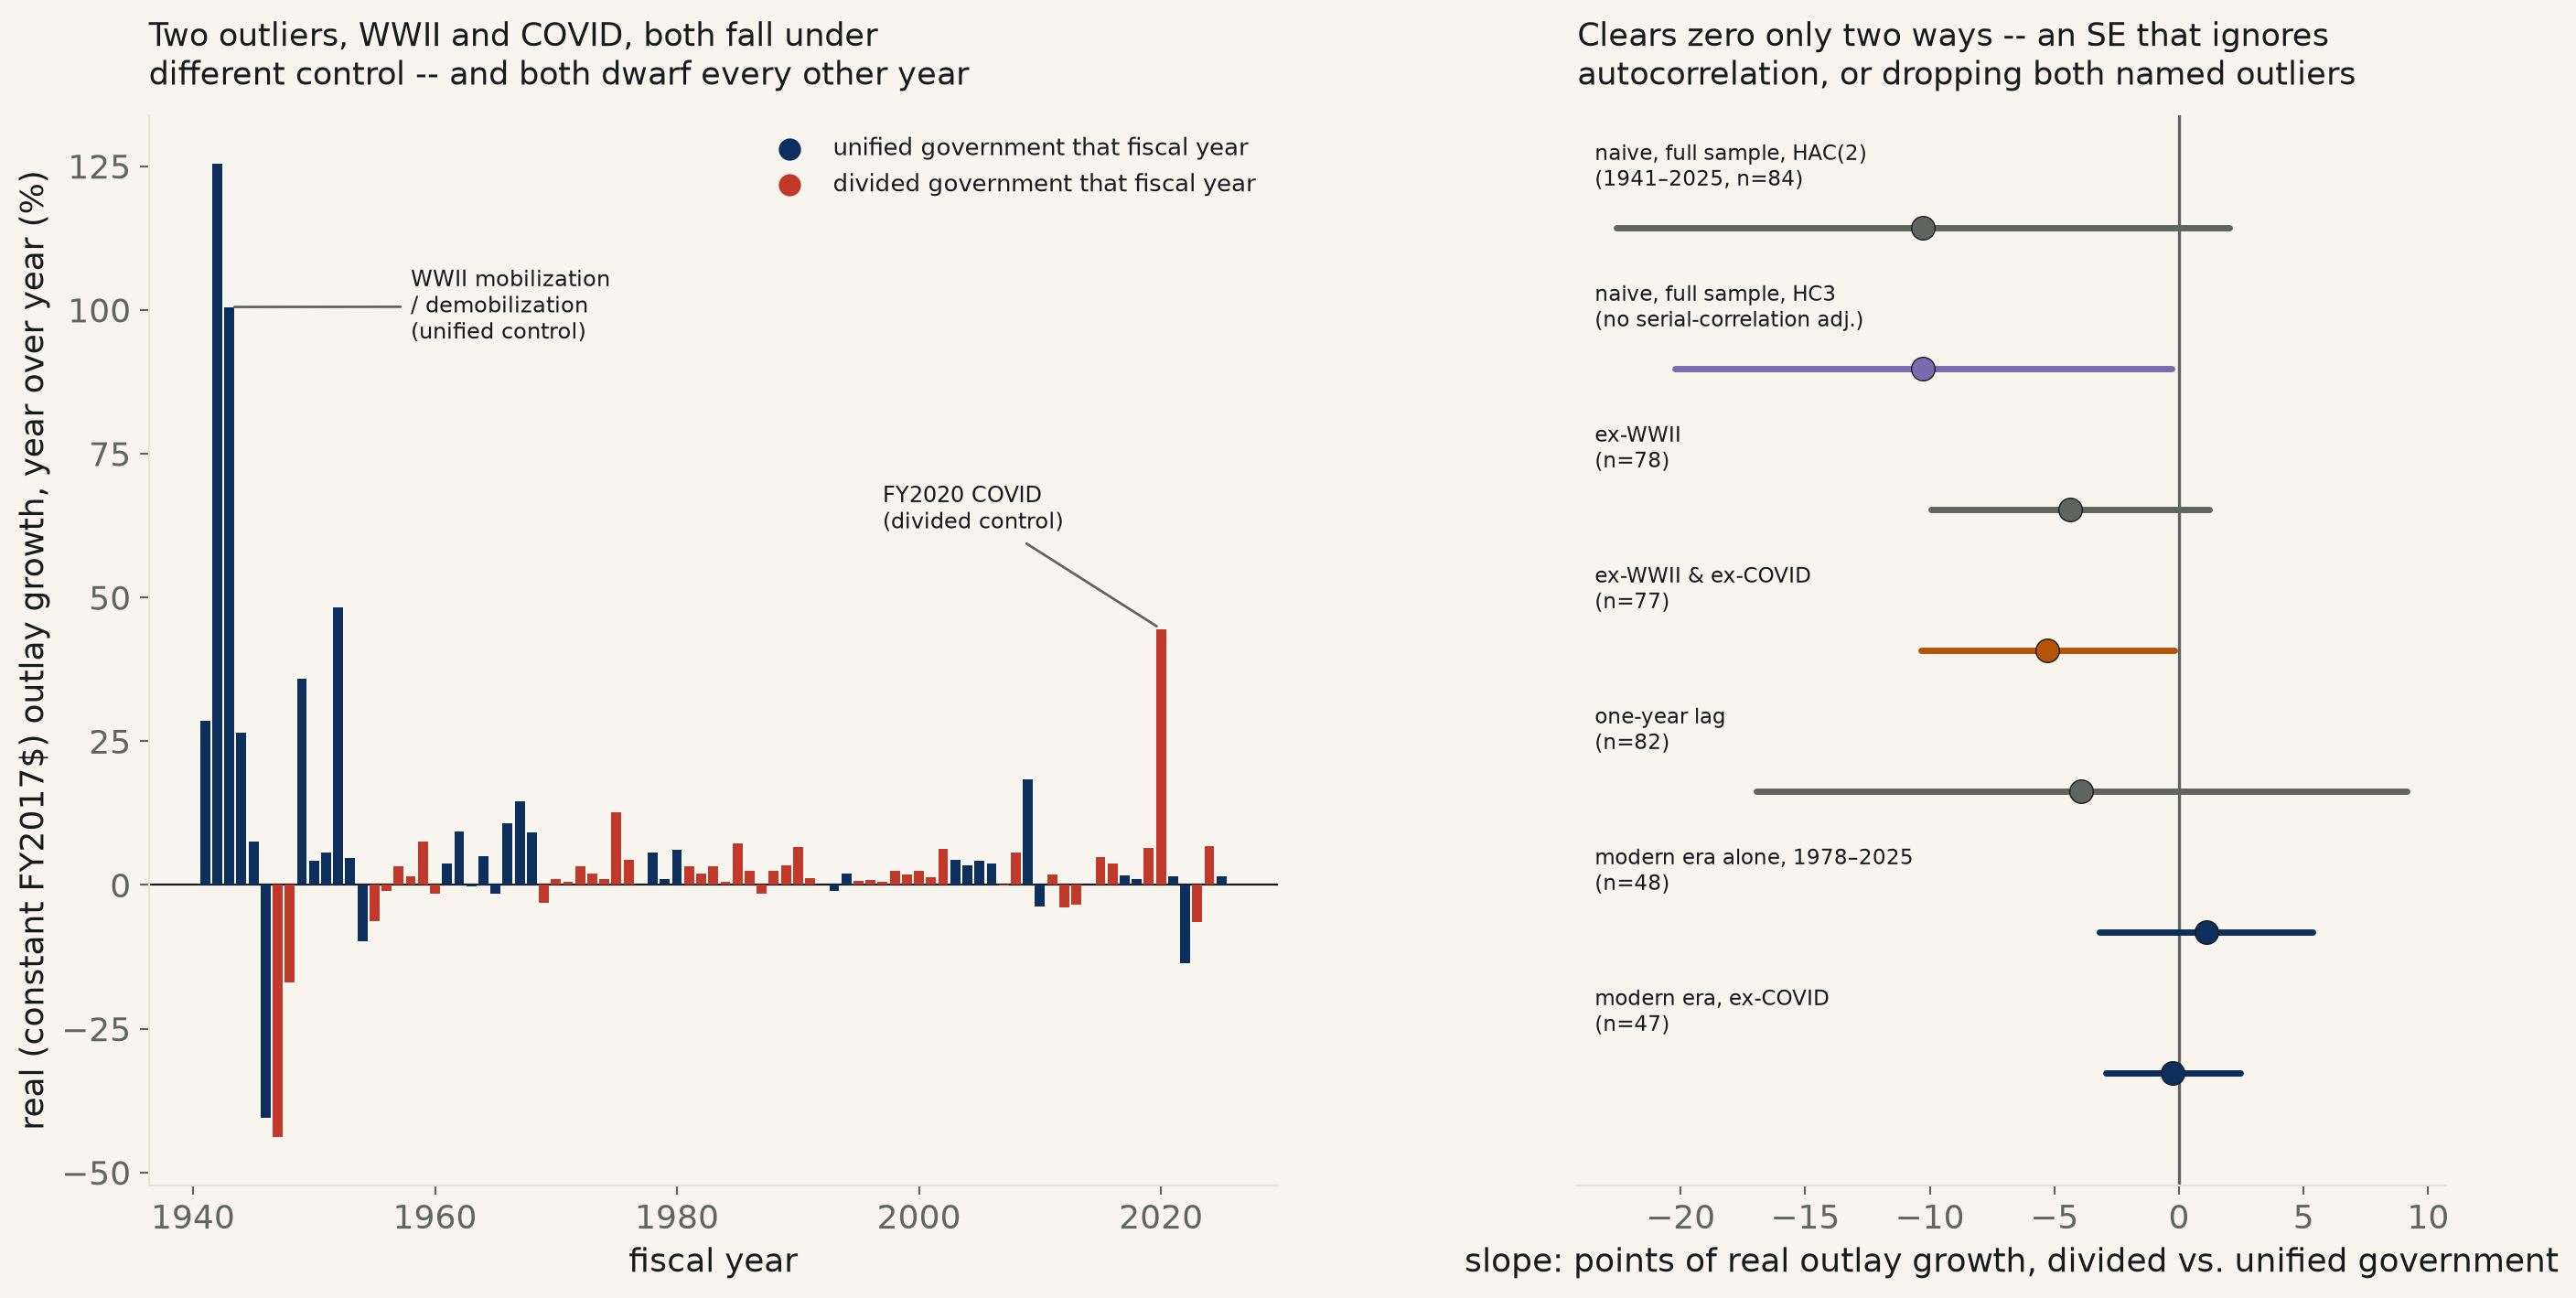
Backlog #7: does divided government — a White House held by one party while Congress, in whole or part, answers to the other — actually slow federal spending growth, as the gridlock story assumes? Real (constant FY2017 dollar) federal outlays, year over year, from OMB's own Historical Table 1.3, matched to which party held the Senate, the House and the presidency that fiscal year, from Wikipedia's "Divided government in the United States" party-control table (itself keyed to the standard Senate.gov/History.House.gov record). 84 fiscal years, FY1941-2025; 48 divided, 36 unified. The FY1976→FY1977 pair is dropped — it spans the one-time transition quarter created when the fiscal year calendar itself moved from a July-June to an October-September cycle, not a clean 12-month comparison.
The naive comparison looks like real support for the claim, until the standard error accounts for what a spending-growth series actually is: autocorrelated. Plain group means: outlay growth averages +11.76% under unified government against +1.49% under divided, a 10.27-point gap, Welch p=0.047. Regressed with a heteroskedasticity-only (HC3) standard error, the identical full-sample slope, -10.27 points, 95% CI [-20.24, -0.29], p=0.044 — excludes zero. But federal spending growth is not 84 independent coin flips: a program funded this year is usually still funded next year, and a HAC(2) standard error that accounts for that short-run persistence widens the same point estimate's interval to [-22.56, +2.02], p=0.102 — contains zero. A 4,000-draw bootstrap of the naive slope, which (like the HC3 spec) does not correct for autocorrelation, agrees with HC3 rather than HAC: CI [-20.75, -1.17], 99.0% of resampled slopes negative. The gap between these two honest standard errors is the finding, not noise to average away: whether this claim clears the desk's bar depends on whether year-to-year spending growth is treated as independent, and it is not.
Two named years are doing nearly all of the naive gap's work, and they fell under opposite kinds of control. WWII mobilization and demobilization (FY1941-46, growth swinging -40.5% to +125.4%) happened entirely under one-party unified (D-D-D) government, dragging the "unified" average far above anything a normal peacetime year produces. FY2020's COVID spending spike (+44.5%) happened entirely under divided government (Republican Senate and presidency, Democratic House), dragging the "divided" average down the other way. Dropping WWII alone still contains zero under HAC: -4.36, CI [-9.94, +1.22], p=0.126. Drop both named outliers and the interval does clear zero: -5.27, CI [-10.36, -0.18], p=0.043 — group means on the same cut, +5.85% (unified) vs. +0.58% (divided), Welch p=0.036.
That result does not survive the era every actual version of this argument is describing. The Congressional Budget Act of 1974 rebuilt how Congress appropriates money; FY1978 is the first full fiscal year run entirely under the modern process, and it is the era "divided government causes budget fights" arguments are actually about — not the WWII-era Congress. Restricted to FY1978-2025 alone (n=48), the sign flips: +1.08, CI [-3.19, +5.36], p=0.62 — contains zero, and the point estimate now runs backward from the claim (divided government tracking slightly faster growth). Dropping FY2020 from that modern window narrows it toward zero rather than away from it: -0.24, CI [-2.95, +2.47], p=0.86. Giving control a year to act before judging its effect on spending, the timing a real appropriations lag implies, also contains zero: -3.92, CI [-16.97, +9.12], p=0.56.
Read plainly. The one specification that excludes zero in the claimed direction requires both a standard error that ignores real autocorrelation in the spending series and the removal of two named historical outliers picked for cause, not for fit — and even that result disappears, and reverses sign, the moment the test is restricted to the 48 fiscal years since Congress last rebuilt its own budget process. Every specification built for the era and the standard-error assumption this claim actually needs lands on zero. This is one country's federal budget against one control-of-government indicator across 84 years that include a world war, a pandemic, and a wholesale rewrite of the appropriations process itself — it cannot separate "divided government" from the dozens of other things that moved across the same 84 years, and the desk cannot certify an effect it cannot even get to survive its own honest standard error.
| Specification | n | slope, pts real outlay growth, divided vs. unified | 95% CI | Verdict |
|---|---|---|---|---|
| Naive, full sample, HAC(2) SE (1941-2025) | n=84 | -10.27 | [-22.56, +2.02] | contains zero, p=0.1 |
| Naive, full sample, HC3 SE (no autocorrelation adj.) | n=84 | -10.27 | [-20.24, -0.29] | excludes zero, p=0.044 |
| Ex-WWII (FY1941-46 dropped) | n=78 | -4.36 | [-9.94, +1.22] | contains zero, p=0.13 |
| Ex-WWII & ex-FY2020 COVID | n=77 | -5.27 | [-10.36, -0.18] | excludes zero, p=0.043 |
| One-year lag (this FY's control, next FY's growth) | n=82 | -3.92 | [-16.97, +9.12] | contains zero, p=0.56 |
| Modern budget-process era alone (FY1978-2025) | n=48 | +1.08 | [-3.19, +5.36] | contains zero, p=0.62 |
| Modern era, ex-FY2020 COVID | n=47 | -0.24 | [-2.95, +2.47] | contains zero, p=0.86 |
Method. Real outlays: OMB Historical Table 1.3, "Summary of Receipts, Outlays, and Surpluses or Deficits in Current Dollars, Constant (FY 2017) Dollars, and as Percentages of GDP," the constant-dollar outlays column, FY1940-2025. Party control: Wikipedia's "Divided government in the United States" table (Senate/House/President party by two-year Congress, 1789-2027); each fiscal year takes the control of whichever Congress and President were seated for most of that same-numbered calendar year, an approximation stated here because OMB's fiscal year has run on two different calendars (July-June through FY1976, October-September since) while Congresses and presidential terms run on the January/calendar cycle. Within every two-year block actually used (1940-2025), no party controlling any of the three offices changed mid-block, so the approximation does not mask a control flip inside a single fiscal year. "Divided" means not all three of Senate, House and President belong to the same party that year. The FY1976-77 pair, spanning the one-time transition quarter, is excluded rather than treated as a normal year-over-year change.
Limits, stated plainly. This is one country's aggregate annual outlay growth against one control-of-government indicator — it cannot separate divided government's own effect from everything else that co-moved across 84 years: a world war, the Great Society, stagflation, the end of Bretton Woods, the 1974 Budget Act itself, the 2008 financial crisis, and a pandemic. The naive and HC3 specs are shown deliberately alongside the HAC spec, not because HC3 is preferred, but because the disagreement between them is itself the honest finding: whether this claim clears zero depends on an assumption about the data (independence across years) that a spending series does not actually satisfy. Excluding WWII and FY2020 is a defensible cut on independent historical grounds, not a search through candidate exclusions until one worked — but the fact that a two-outlier exclusion is required at all, and that even it does not survive restricting to the modern budget era, is reported as the result, not hedged around.
divided_gov_outlays_551.csv · fit output (JSON).
| Fiscal year | real outlays ($B, FY2017) | growth | Senate | House | President | control |
|---|---|---|---|---|---|---|
| 1941 | 199.6 | +28.61% | D | D | D | unified |
| 1942 | 449.9 | +125.40% | D | D | D | unified |
| 1943 | 901.9 | +100.47% | D | D | D | unified |
| 1944 | 1139.9 | +26.39% | D | D | D | unified |
| 1945 | 1226.3 | +7.58% | D | D | D | unified |
| 1946 | 729.6 | -40.50% | D | D | D | unified |
| 1947 | 409.7 | -43.85% | R | R | D | divided |
| 1948 | 340.2 | -16.96% | R | R | D | divided |
| 1949 | 462.3 | +35.89% | D | D | D | unified |
| 1950 | 481.5 | +4.15% | D | D | D | unified |
| 1951 | 508.5 | +5.61% | D | D | D | unified |
| 1952 | 753.7 | +48.22% | D | D | D | unified |
| 1953 | 788.6 | +4.63% | R | R | R | unified |
| 1954 | 710.7 | -9.88% | R | R | R | unified |
| 1955 | 666.4 | -6.23% | D | D | R | divided |
| 1956 | 659.6 | -1.02% | D | D | R | divided |
| 1957 | 681.3 | +3.29% | D | D | R | divided |
| 1958 | 691.9 | +1.56% | D | D | R | divided |
| 1959 | 744.5 | +7.60% | D | D | R | divided |
| 1960 | 733.4 | -1.49% | D | D | R | divided |
| 1961 | 761.1 | +3.78% | D | D | D | unified |
| 1962 | 831.9 | +9.30% | D | D | D | unified |
| 1963 | 830.1 | -0.22% | D | D | D | unified |
| 1964 | 870.9 | +4.92% | D | D | D | unified |
| 1965 | 858.0 | -1.48% | D | D | D | unified |
| 1966 | 950.1 | +10.73% | D | D | D | unified |
| 1967 | 1087.5 | +14.46% | D | D | D | unified |
| 1968 | 1186.8 | +9.13% | D | D | D | unified |
| 1969 | 1149.2 | -3.17% | D | D | R | divided |
| 1970 | 1161.1 | +1.04% | D | D | R | divided |
| 1971 | 1167.0 | +0.51% | D | D | R | divided |
| 1972 | 1204.0 | +3.17% | D | D | R | divided |
| 1973 | 1227.9 | +1.99% | D | D | R | divided |
| 1974 | 1241.3 | +1.09% | D | D | R | divided |
| 1975 | 1398.1 | +12.63% | D | D | R | divided |
| 1976 | 1459.7 | +4.41% | D | D | R | divided |
| 1978 | 1581.9 | +5.61% | D | D | D | unified |
| 1979 | 1597.6 | +0.99% | D | D | D | unified |
| 1980 | 1694.7 | +6.08% | D | D | D | unified |
| 1981 | 1749.8 | +3.25% | R | D | R | divided |
| 1982 | 1785.4 | +2.03% | R | D | R | divided |
| 1983 | 1843.1 | +3.23% | R | D | R | divided |
| 1984 | 1851.8 | +0.47% | R | D | R | divided |
| 1985 | 1984.8 | +7.18% | R | D | R | divided |
| 1986 | 2034.9 | +2.52% | R | D | R | divided |
| 1987 | 2003.2 | -1.56% | D | D | R | divided |
| 1988 | 2053.7 | +2.52% | D | D | R | divided |
| 1989 | 2123.5 | +3.40% | D | D | R | divided |
| 1990 | 2264.6 | +6.64% | D | D | R | divided |
| 1991 | 2292.2 | +1.22% | D | D | R | divided |
| 1992 | 2293.4 | +0.05% | D | D | R | divided |
| 1993 | 2271.0 | -0.98% | D | D | D | unified |
| 1994 | 2316.2 | +1.99% | D | D | D | unified |
| 1995 | 2331.2 | +0.65% | R | R | D | divided |
| 1996 | 2351.5 | +0.87% | R | R | D | divided |
| 1997 | 2362.6 | +0.47% | R | R | D | divided |
| 1998 | 2420.1 | +2.43% | R | R | D | divided |
| 1999 | 2463.6 | +1.80% | R | R | D | divided |
| 2000 | 2524.6 | +2.48% | R | R | D | divided |
| 2001 | 2559.6 | +1.39% | D | R | R | divided |
| 2002 | 2720.0 | +6.27% | D | R | R | divided |
| 2003 | 2837.1 | +4.31% | R | R | R | unified |
| 2004 | 2934.3 | +3.43% | R | R | R | unified |
| 2005 | 3059.0 | +4.25% | R | R | R | unified |
| 2006 | 3174.4 | +3.77% | R | R | R | unified |
| 2007 | 3170.3 | -0.13% | D | D | R | divided |
| 2008 | 3349.3 | +5.65% | D | D | R | divided |
| 2009 | 3964.5 | +18.37% | D | D | D | unified |
| 2010 | 3814.5 | -3.78% | D | D | D | unified |
| 2011 | 3885.5 | +1.86% | D | R | D | divided |
| 2012 | 3731.8 | -3.96% | D | R | D | divided |
| 2013 | 3601.1 | -3.50% | D | R | D | divided |
| 2014 | 3601.0 | -0.00% | D | R | D | divided |
| 2015 | 3776.1 | +4.86% | R | R | D | divided |
| 2016 | 3916.9 | +3.73% | R | R | D | divided |
| 2017 | 3981.6 | +1.65% | R | R | R | unified |
| 2018 | 4022.1 | +1.02% | R | R | R | unified |
| 2019 | 4281.3 | +6.44% | R | D | R | divided |
| 2020 | 6186.5 | +44.50% | R | D | R | divided |
| 2021 | 6280.6 | +1.52% | D | D | D | unified |
| 2022 | 5427.5 | -13.58% | D | D | D | unified |
| 2023 | 5072.8 | -6.54% | D | R | D | divided |
| 2024 | 5417.2 | +6.79% | D | R | D | divided |
| 2025 | 5500.6 | +1.54% | R | R | R | unified |
