96 years of the top marginal income tax rate (Tax Foundation's historical bracket table, sourced to IRS revenue procedures) against real GDP growth (BEA, via FRED's keyless CSV). Naive slope: +0.050 pts growth/pt rate, 95% CI [+0.006, +0.094] — excludes zero, running backward from the claim. Restricted to 1981-2025, the era that actually contains the tax cuts: a clean null.
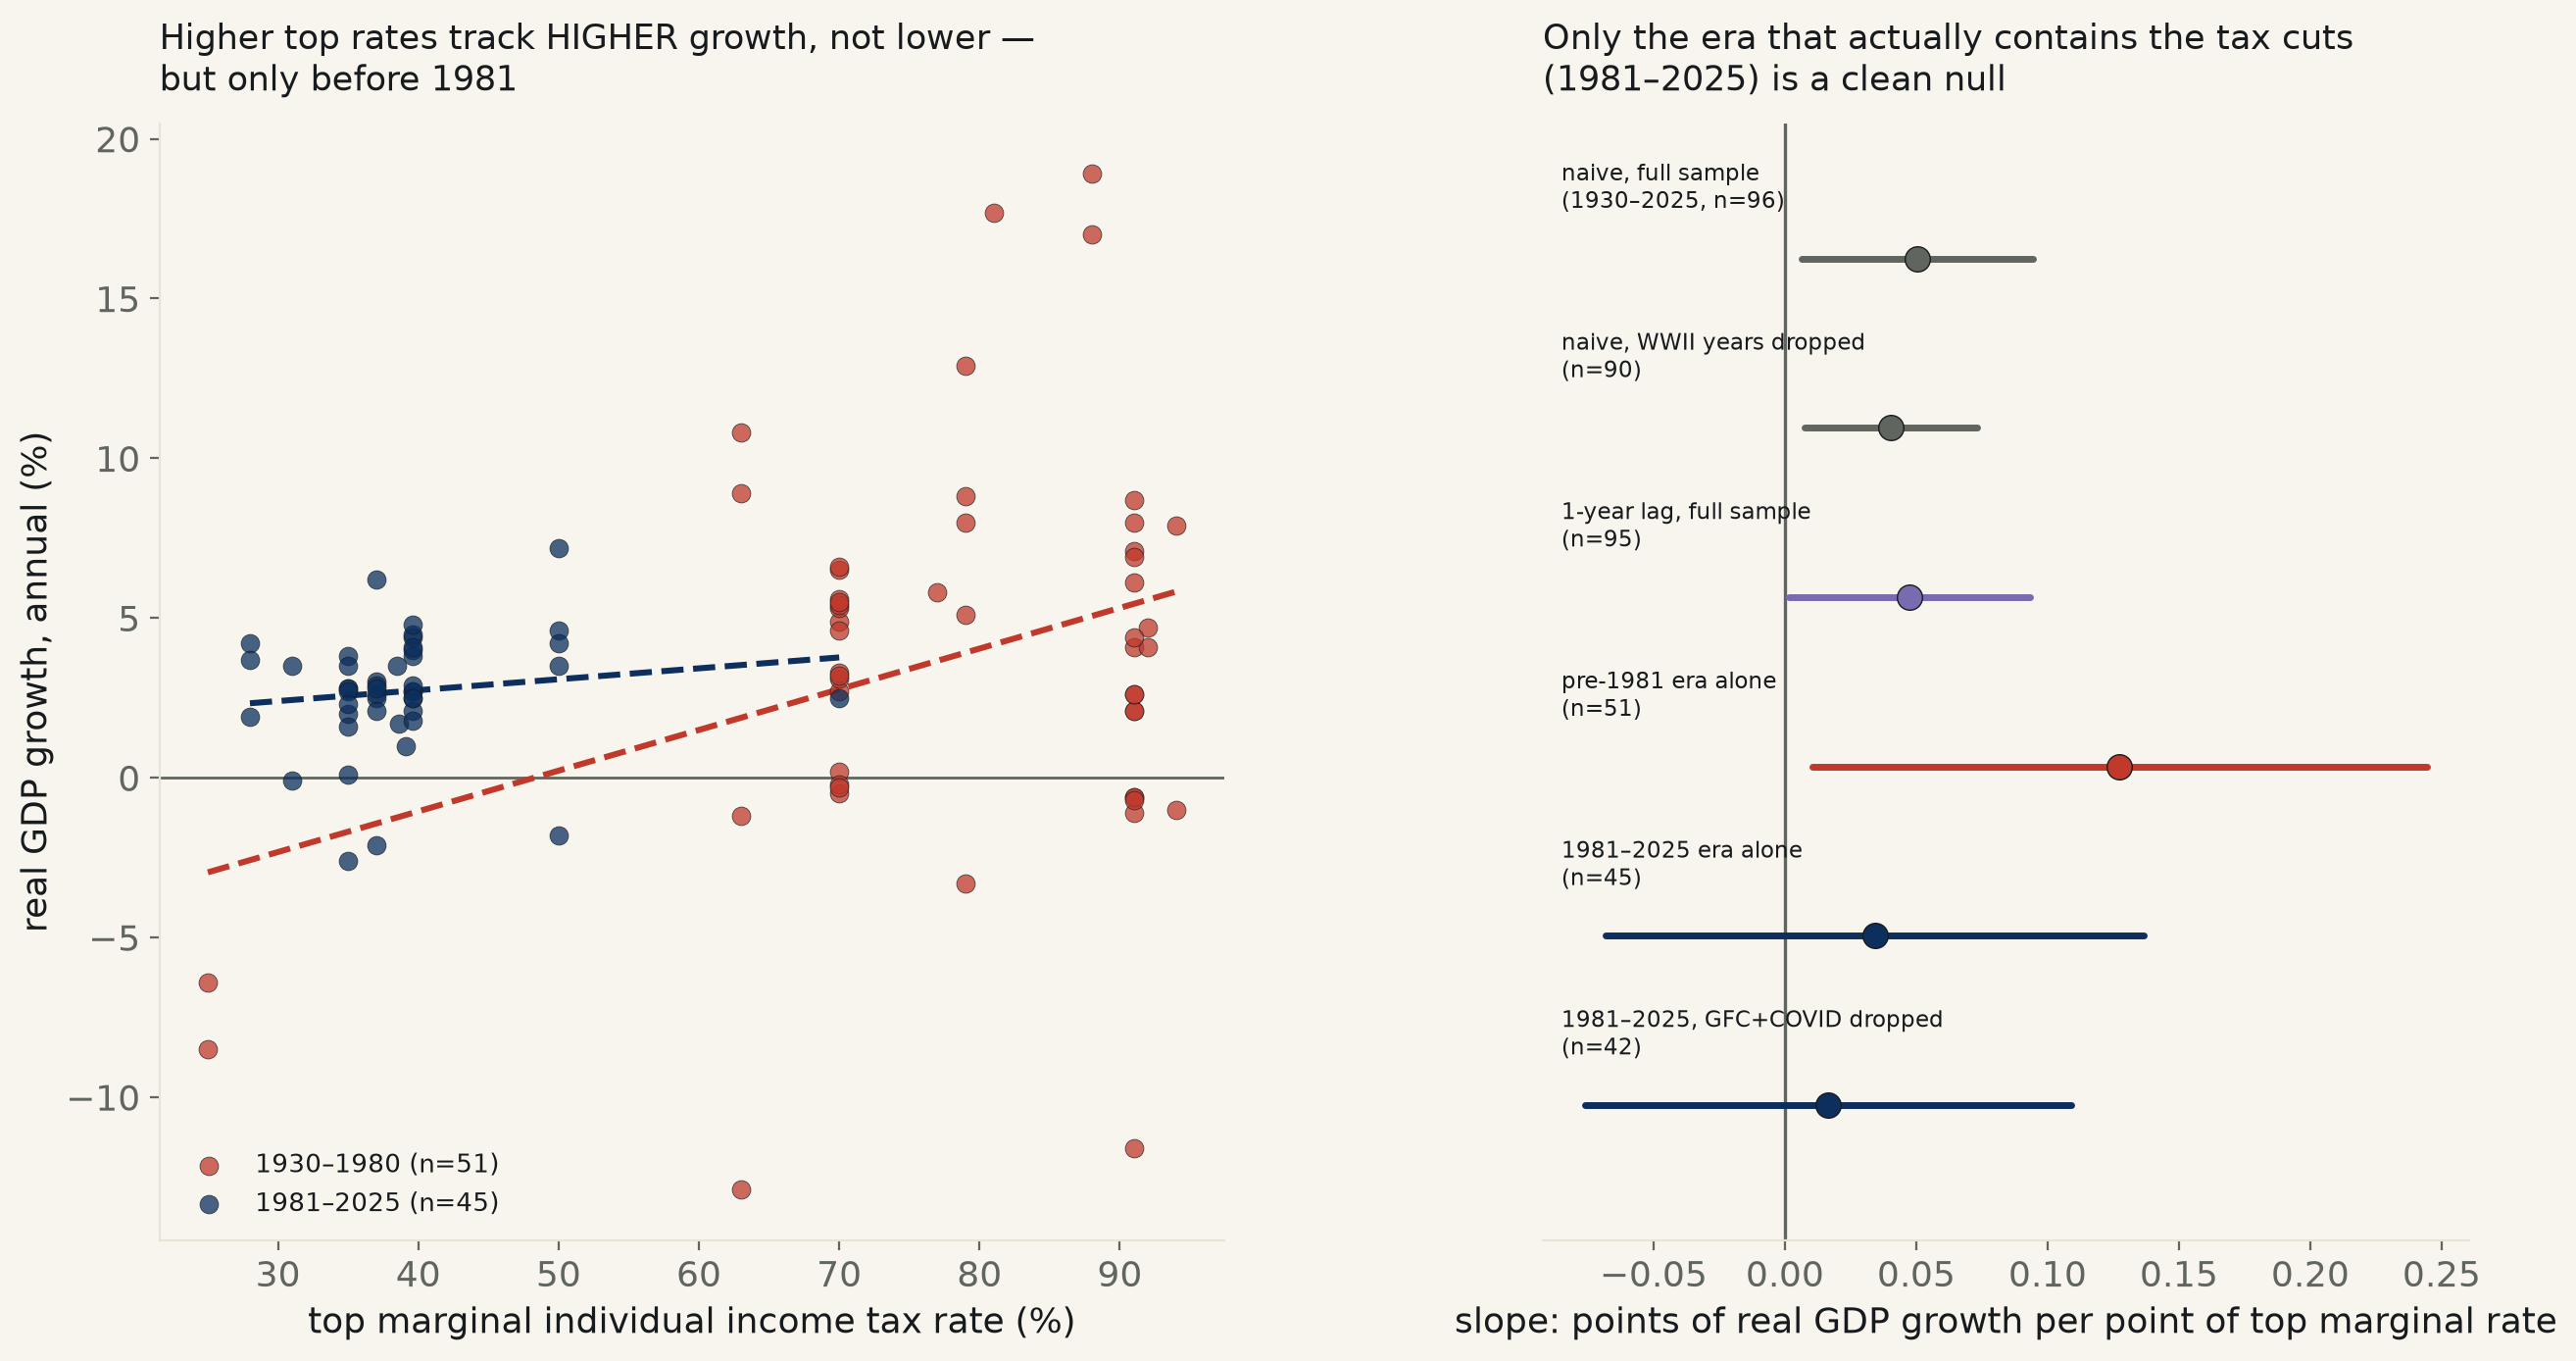
Backlog #29: the supply-side claim that cutting the top income tax rate spurs faster economic growth, tested in its plainest form — the top marginal individual income tax rate for every year since the annual real-GDP-growth series begins (Tax Foundation's own historical bracket table, sourced row-by-row to IRS revenue procedures, against BEA's real GDP annual percent change, FRED's keyless CSV endpoint), 1930-2025, n=96 years.
The naive full-sample correlation clears zero — running backward from the claim. Regressing real GDP growth on the top marginal rate: +0.050 points of growth per point of top rate, 95% CI [+0.006, +0.094], p=0.025, R²=0.061 — excludes zero, and the sign is positive: higher top rates, in the raw 96-year record, sit alongside faster growth, not slower. Dropping the six WWII mobilization/demobilization years (1941-46, growth swinging from −11.6% to +18.9%, alongside the highest top rates in US history, 88-94%) barely moves it: +0.040, CI [+0.007, +0.073], p=0.016. Giving a rate change a year to show up in growth, the timing the “tax cuts spur growth” story actually implies, tells the same story: +0.047, CI [+0.001, +0.093], p=0.043.
Splitting the sample at 1981 is where the naive number falls apart. Every top-rate cut anyone actually points to as evidence — 1981-86, 2001-03, 2017-18 — happened after 1981; before that, the top rate spent five decades between 25% and 94% while the country fought a war, rebuilt after it, and only started cutting rates once. Fit the two eras separately: pre-1981 (n=51) alone is even more positive than the full sample, +0.127, CI [+0.010, +0.244], p=0.033 — still excludes zero, still backward. 1981-2025 (n=45), the era that actually contains the cuts, is a clean null: +0.034, CI [-0.068, +0.137], p=0.51 — contains zero, in either direction. Dropping 2008-09 and 2020, the two years a financial crisis and a pandemic swamped everything else in the growth number, pushes it closer to zero still: +0.016, CI [-0.076, +0.109], p=0.73.
Honestly, the formal test for whether the slope itself changed between eras does not clear zero either. A rate×era interaction term: -0.093, 95% CI [-0.249, +0.062], p=0.24 — contains zero, so the desk cannot formally certify that the pre- and post-1981 slopes are statistically different from each other, only that each one, read on its own, tells a different story: one excludes zero (backward), the other doesn't exclude anything.
Read plainly. Ninety-six years of the naive version of this claim run in the opposite direction from the theory, not merely failing to support it — and that shape survives dropping the six most distorted wartime years and giving the rate a year to act. But the wrong-direction result is doing almost all of its work in the 51 years before 1981, an era with essentially no rate-cutting to test in the first place. Restrict the test to the 45 years that actually contain every real-world experiment in cutting the top rate, and the interval says nothing: not that cuts help, not that they hurt, not enough signal in one country's macro history to say which. This is one country's top bracket against one aggregate growth number — it cannot separate the top rate's effect from everything else that changed across 45 years of one economy (monetary policy, globalization, two wars, a financial crisis, a pandemic), and a genuine causal test would need cross-country or cross-state variation this design doesn't have.
| Specification | n | slope, pts growth / pt top rate | 95% CI | Verdict |
|---|---|---|---|---|
| Naive, full sample (1930-2025) | n=96 | +0.050 | [+0.006, +0.094] | excludes zero, p=0.025 |
| Naive, WWII years dropped (1941-46) | n=90 | +0.040 | [+0.007, +0.073] | excludes zero, p=0.016 |
| 1-year lag, full sample | n=95 | +0.047 | [+0.001, +0.093] | excludes zero, p=0.043 |
| 1-year lag, WWII years dropped | n=88 | +0.046 | [+0.011, +0.081] | excludes zero, p=0.011 |
| Pre-1981 era alone | n=51 | +0.127 | [+0.010, +0.244] | excludes zero, p=0.033 |
| 1981-2025 era alone (the actual cut era) | n=45 | +0.034 | [-0.068, +0.137] | contains zero, p=0.51 |
| 1981-2025, GFC + COVID years dropped | n=42 | +0.016 | [-0.076, +0.109] | contains zero, p=0.73 |
Method. Top marginal rate: Tax Foundation's "Historical U.S. Federal Individual Income Tax Rates and Brackets" table (every bracket schedule back to 1862, each sourced in its own Notes column to the underlying IRS revenue procedure or act); the top rate for a year is the maximum rate listed across all four filing statuses. Real GDP growth: BEA series A191RL1A225NBEA (real GDP, annual percent change, chained dollars), pulled from FRED's keyless CSV endpoint, which sets the panel's start year at 1930. The 1981 era split follows the first and largest of the modern top-rate cuts (70%→50% effective 1982); every subsequent cut cited in this debate (1986, 2001-03, 2017-18) falls inside the post-1981 window. Decade means (9 full decades, 1930s-2010s) are reported in the data table below as description only — n=9 is too small to fit a defensible interval on and none is reported for it.
Limits, stated plainly. This is a single country's aggregate annual growth rate against a single tax parameter — it cannot separate the top rate's own effect from everything else that moved across 96 years of the same economy: monetary policy regime changes, two world-war-adjacent decades, the end of Bretton Woods, globalization, three recessions and a pandemic. A rate×era interaction test finds the pre/post-1981 slopes are not formally distinguishable from each other (p=0.24), so the era split is read as two honestly-reported separate results, not as statistical proof the relationship changed. The claim as usually argued is also about marginal incentive effects on the top of the income distribution specifically, not aggregate GDP; this run tests the aggregate-growth version because that is the version stated in the backlog and the version most commonly argued in public.
taxcuts_growth_550.csv · fit output (JSON).
| Decade | mean top marginal rate | mean real GDP growth |
|---|---|---|
| 1930s | 61.8% | +1.34% |
| 1940s | 88.8% | +6.01% |
| 1950s | 91.2% | +4.24% |
| 1960s | 79.1% | +4.53% |
| 1970s | 70.0% | +3.24% |
| 1980s | 48.5% | +3.13% |
| 1990s | 36.7% | +3.22% |
| 2000s | 36.2% | +1.92% |
| 2010s | 37.7% | +2.40% |
| Year | top marginal rate | real GDP growth |
|---|---|---|
| 1930 | 25.0% | -8.5% |
| 1931 | 25.0% | -6.4% |
| 1932 | 63.0% | -12.9% |
| 1933 | 63.0% | -1.2% |
| 1934 | 63.0% | +10.8% |
| 1935 | 63.0% | +8.9% |
| 1936 | 79.0% | +12.9% |
| 1937 | 79.0% | +5.1% |
| 1938 | 79.0% | -3.3% |
| 1939 | 79.0% | +8.0% |
| 1940 | 79.0% | +8.8% |
| 1941 | 81.0% | +17.7% |
| 1942 | 88.0% | +18.9% |
| 1943 | 88.0% | +17.0% |
| 1944 | 94.0% | +7.9% |
| 1945 | 94.0% | -1.0% |
| 1946 | 91.0% | -11.6% |
| 1947 | 91.0% | -1.1% |
| 1948 | 91.0% | +4.1% |
| 1949 | 91.0% | -0.6% |
| 1950 | 91.0% | +8.7% |
| 1951 | 91.0% | +8.0% |
| 1952 | 92.0% | +4.1% |
| 1953 | 92.0% | +4.7% |
| 1954 | 91.0% | -0.6% |
| 1955 | 91.0% | +7.1% |
| 1956 | 91.0% | +2.1% |
| 1957 | 91.0% | +2.1% |
| 1958 | 91.0% | -0.7% |
| 1959 | 91.0% | +6.9% |
| 1960 | 91.0% | +2.6% |
| 1961 | 91.0% | +2.6% |
| 1962 | 91.0% | +6.1% |
| 1963 | 91.0% | +4.4% |
| 1964 | 77.0% | +5.8% |
| 1965 | 70.0% | +6.5% |
| 1966 | 70.0% | +6.6% |
| 1967 | 70.0% | +2.7% |
| 1968 | 70.0% | +4.9% |
| 1969 | 70.0% | +3.1% |
| 1970 | 70.0% | +0.2% |
| 1971 | 70.0% | +3.3% |
| 1972 | 70.0% | +5.3% |
| 1973 | 70.0% | +5.6% |
| 1974 | 70.0% | -0.5% |
| 1975 | 70.0% | -0.2% |
| 1976 | 70.0% | +5.4% |
| 1977 | 70.0% | +4.6% |
| 1978 | 70.0% | +5.5% |
| 1979 | 70.0% | +3.2% |
| 1980 | 70.0% | -0.3% |
| 1981 | 70.0% | +2.5% |
| 1982 | 50.0% | -1.8% |
| 1983 | 50.0% | +4.6% |
| 1984 | 50.0% | +7.2% |
| 1985 | 50.0% | +4.2% |
| 1986 | 50.0% | +3.5% |
| 1987 | 38.5% | +3.5% |
| 1988 | 28.0% | +4.2% |
| 1989 | 28.0% | +3.7% |
| 1990 | 28.0% | +1.9% |
| 1991 | 31.0% | -0.1% |
| 1992 | 31.0% | +3.5% |
| 1993 | 39.6% | +2.7% |
| 1994 | 39.6% | +4.0% |
| 1995 | 39.6% | +2.7% |
| 1996 | 39.6% | +3.8% |
| 1997 | 39.6% | +4.4% |
| 1998 | 39.6% | +4.5% |
| 1999 | 39.6% | +4.8% |
| 2000 | 39.6% | +4.1% |
| 2001 | 39.1% | +1.0% |
| 2002 | 38.6% | +1.7% |
| 2003 | 35.0% | +2.8% |
| 2004 | 35.0% | +3.8% |
| 2005 | 35.0% | +3.5% |
| 2006 | 35.0% | +2.8% |
| 2007 | 35.0% | +2.0% |
| 2008 | 35.0% | +0.1% |
| 2009 | 35.0% | -2.6% |
| 2010 | 35.0% | +2.7% |
| 2011 | 35.0% | +1.6% |
| 2012 | 35.0% | +2.3% |
| 2013 | 39.6% | +2.1% |
| 2014 | 39.6% | +2.5% |
| 2015 | 39.6% | +2.9% |
| 2016 | 39.6% | +1.8% |
| 2017 | 39.6% | +2.5% |
| 2018 | 37.0% | +3.0% |
| 2019 | 37.0% | +2.6% |
| 2020 | 37.0% | -2.1% |
| 2021 | 37.0% | +6.2% |
| 2022 | 37.0% | +2.5% |
| 2023 | 37.0% | +2.9% |
| 2024 | 37.0% | +2.8% |
| 2025 | 37.0% | +2.1% |
