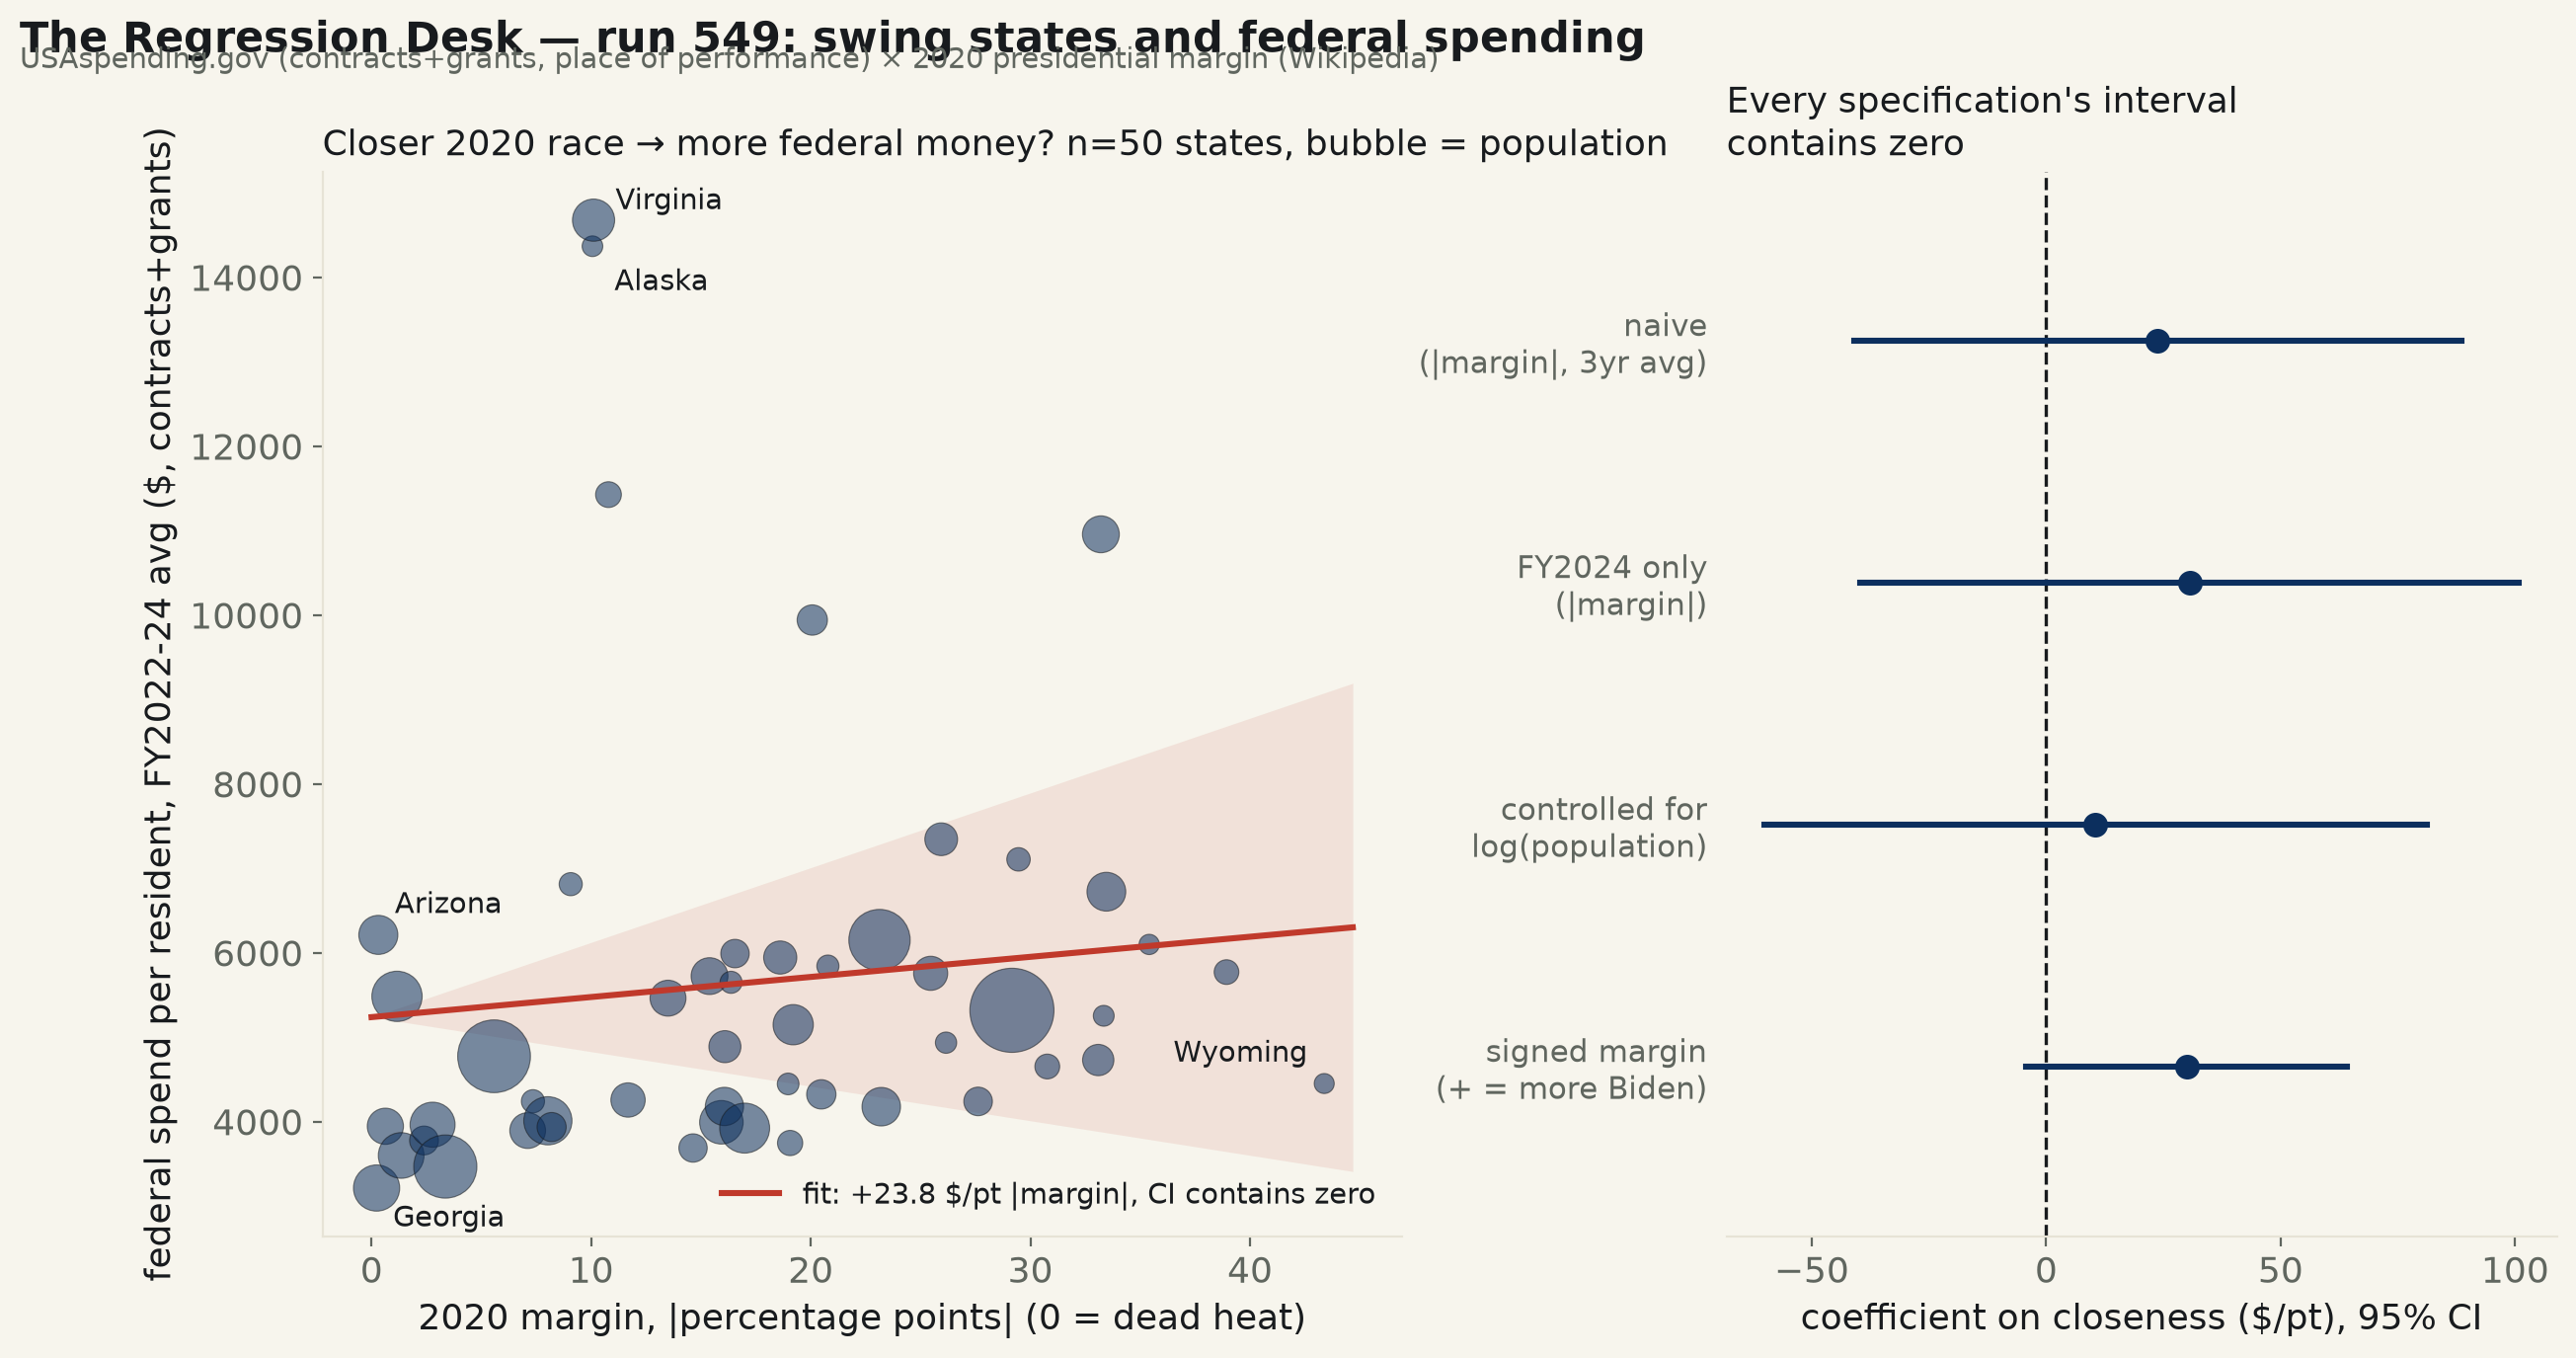
50 states, federal contracts and grants (USAspending.gov, FY2022-24 average) against each state's 2020 presidential margin. Naive slope on closeness: +23.8 $/pt, 95% CI [$-41, $89] — contains zero, and the point estimate runs backward from the claim. Georgia, the single closest state in the country in 2020, has the lowest per-capita spend of all 50.
Backlog #4: politicians are widely assumed to steer federal money toward the states whose elections are actually in doubt, rewarding or courting the ones that could go either way. This run tests it directly: USAspending.gov's own award-level search endpoint, place-of-performance scope, restricted to contracts and grants only (award type codes A/B/C/D and 02/03/04/05 — direct-payment codes were checked and dropped after they attributed some $82 billion of FY2024 spending to North Dakota alone, a known USAspending geocoding artifact where a single nationally-administered program lands on one address, and loan/insurance codes report guaranteed face value, not money actually spent), pulled for FY2022, FY2023 and FY2024 and averaged into a per-resident figure for all 50 states. “Swing” is measured the ordinary way: |margin|, each state's own 2020 presidential result read straight off Wikipedia's certified state-by-state table, with 0 a dead heat and larger numbers a bigger landslide either way.
The naive fit already leans the wrong way, and its interval contains zero regardless. Regressing 3-year-average per-capita spend on |margin|: +23.8 $/resident per point of |margin|, 95% CI [$-41, $89], p=0.46, R²=0.011 — contains zero. The sign is positive, meaning the point estimate (not confirmed, but the direction on the page) says spending rises as a race gets less close, the opposite of the “reward the swing states” story. A 4,000-draw state-resampling bootstrap agrees almost exactly (CI [$-30, $76]); only 18.7% of resampled slopes come out negative, i.e. in the claimed direction. FY2024 alone, without the 3-year averaging, tells the same story: +30.6 $/pt, CI [$-40, $101], p=0.38.
A state's own population is the obvious confound sitting behind both sides of this, and checking it does not rescue the claim. Bigger states really did have closer 2020 races here: log(population) predicts |margin| at -10.04 points per log-unit, 95% CI [-16.77, -3.31] — excludes zero, p=0.004. But population's own link to per-capita spending is not itself confirmed (-952 $/log-unit, CI [$-2,574, $670] — contains zero), and adding log(population) to the regression alongside |margin| leaves |margin|'s own coefficient at +10.5 $/pt, CI [$-60, $81] — still contains zero, and smaller than the naive estimate, not larger.
Splitting by who won, not just by how close, doesn't clear the bar either. Signed margin (positive = more Biden) against per-capita spend: +30.0 $/pt, 95% CI [$-4, $64], p=0.084 — the closest any specification here comes to a hint of something (the interval's lower bound sits nearer zero than any other spec's), and it still contains zero.
The one comparison that does clear a naive bar runs backward from the claim, and the reason why is visible in the same data. Split the 50 states into the 10 closest 2020 races and the 10 biggest landslides, fixed by |margin| before looking at spending: the closest 10 averaged $4,233 per resident; the 10 landslide states averaged $6,106 — a gap a Welch's t-test does distinguish from noise (t=-2.76, p=0.016). But the closest-10 group's states also carry nearly twice the average population of the landslide-10 group's (a coarse, order-of-magnitude version of the same population confound above), and the direction is exactly backward from the claim: the group that includes Georgia, Arizona, Wisconsin, Pennsylvania and Michigan spent less per resident than the group that includes California, Maryland and Massachusetts, not more.
Named, and about as clean a single data point against the claim as this dataset offers. Georgia was the single closest state in the country in 2020, decided by 0.23 points — and it also recorded the lowest per-capita contract-and-grant spending of all 50 states, $3,214/resident. The highest per-capita spender in the whole sample, Virginia at $14,677/resident, was not close at all — Biden by 10.11 points — and its number is easily explained by the density of federal contractors and defense/intelligence facilities headquartered or performing work there, not by anyone trying to win it.
Read plainly. Every formal specification tried — naive, single-year, population-controlled, signed-margin — returns a 95% interval that contains zero. The one comparison that clears a conventional bar (the coarse closest-10-vs-landslide-10 split) runs in the opposite direction from the claim and is explained by the same population confound the continuous regressions already flag, not by political targeting. This measures contracts and grants only, not the direct-payment/loan/insurance categories excluded up front for data-quality reasons, and not federal employee payroll's own separate geography; it is a 3-year cross-section against a single past election, not a multi-cycle panel, so it cannot rule out a shorter-lived pre-election spending push in the run-up to 2024 specifically that this window's averaging would smooth away. Inside the window actually tested, the claim as stated — that closer 2020 races drew more federal money — finds no support, and the clearest single case, Georgia, sits at the wrong end of the spending table entirely.
| Specification | coefficient, $/pt of |margin| | 95% CI | Verdict |
|---|---|---|---|
| Naive, |margin| vs. 3yr-avg per-capita spend (n=50) | $+23.8/pt | [$-41, $89] | contains zero, p=0.46 |
| FY2024 only, |margin| | $+30.6/pt | [$-40, $101] | contains zero, p=0.38 |
| Controlled for log(population) | $+10.5/pt | [$-60, $81] | contains zero, p=0.77 |
| Signed margin (+ = more Biden) | $+30.0/pt | [$-4, $64] | contains zero, p=0.084 |
Method. USAspending.gov's own spending_by_geography search endpoint (api.usaspending.gov/api/v2/search/spending_by_geography/), scope place_of_performance, geo_layer state, restricted to award type codes A/B/C/D (contracts) and 02/03/04/05 (grants), pulled separately for FY2022 (2021-10-01–2022-09-30), FY2023 and FY2024 and averaged. Direct-payment codes 06/10 and loan/insurance codes 07/08/09 were tested and excluded: code 06 alone attributes roughly $82 billion of FY2024 spending to North Dakota, a single-state total larger than several G7 nations' entire annual budgets, a known artifact of a nationally-administered program's records all sharing one place-of-performance address, and loan/insurance codes report the face value of federally guaranteed private lending, not government outlay. The District of Columbia and the five inhabited territories are excluded from the regression (DC as a federal-enclave outlier by construction, the territories for having no 2020 presidential vote to attach). 2020 margin is read directly off Wikipedia's own state-by-state results table for the 2020 United States presidential election, positive for a Biden win, negative for a Trump win.
Limits, stated plainly. This measures contracts and grants only — it does not capture federal employee payroll, Social Security, Medicare, or other transfer programs, each of which has its own separate geography that a full accounting of “federal money” would need to include. It is a 3-year cross-section (FY2022-24) against a single past election's margin, not a panel across multiple election cycles, so it cannot rule out a shorter, more targeted pre-election spending push that this window's averaging would dilute, nor can it speak to 2016 or 2024 margins specifically. And with n=50, a fixed population of states rather than a sample, every confidence interval here describes plausible variation under the same underlying process, not sampling noise from a larger population of states that doesn't exist.
swing_state_spending_549.csv · fit output (JSON).
| State | 2020 margin | Population | FY22 $/resident | FY23 $/resident | FY24 $/resident | 3yr avg $/resident |
|---|---|---|---|---|---|---|
| Georgia | +0.23% | 10,711,908 | $3,045 | $3,343 | $3,253 | $3,214 |
| Arizona | +0.31% | 7,151,502 | $5,926 | $6,655 | $6,054 | $6,212 |
| Wisconsin | +0.63% | 5,893,718 | $3,773 | $3,672 | $4,391 | $3,945 |
| Pennsylvania | +1.16% | 13,002,700 | $5,128 | $5,491 | $5,833 | $5,484 |
| North Carolina | -1.35% | 10,439,388 | $3,425 | $3,396 | $3,976 | $3,599 |
| Nevada | +2.39% | 3,104,614 | $3,384 | $3,736 | $4,211 | $3,777 |
| Michigan | +2.78% | 10,077,331 | $4,012 | $3,820 | $4,060 | $3,964 |
| Florida | -3.36% | 21,538,187 | $3,362 | $3,437 | $3,606 | $3,468 |
| Texas | -5.58% | 29,145,505 | $4,818 | $5,214 | $4,290 | $4,774 |
| Minnesota | +7.11% | 5,706,494 | $3,825 | $4,020 | $3,839 | $3,894 |
| New Hampshire | +7.35% | 1,377,529 | $3,909 | $4,009 | $4,806 | $4,241 |
| Ohio | -8.03% | 11,799,448 | $3,852 | $4,144 | $4,034 | $4,010 |
| Iowa | -8.20% | 3,190,369 | $3,795 | $3,878 | $4,134 | $3,936 |
| Maine | +9.07% | 1,362,359 | $5,994 | $6,928 | $7,516 | $6,813 |
| Alaska | -10.06% | 733,391 | $13,180 | $14,699 | $15,225 | $14,368 |
| Virginia | +10.11% | 8,631,393 | $13,013 | $15,174 | $15,844 | $14,677 |
| New Mexico | +10.79% | 2,117,522 | $10,897 | $11,290 | $12,092 | $11,427 |
| South Carolina | -11.68% | 5,118,425 | $3,738 | $4,419 | $4,612 | $4,256 |
| Colorado | +13.50% | 5,773,714 | $5,281 | $5,504 | $5,603 | $5,462 |
| Kansas | -14.64% | 2,937,880 | $3,806 | $3,571 | $3,686 | $3,688 |
| Missouri | -15.39% | 6,154,913 | $4,963 | $5,998 | $6,210 | $5,724 |
| New Jersey | +15.93% | 9,288,994 | $4,223 | $3,973 | $3,781 | $3,992 |
| Indiana | -16.07% | 6,785,528 | $4,232 | $4,113 | $4,196 | $4,180 |
| Oregon | +16.09% | 4,237,256 | $4,471 | $4,881 | $5,312 | $4,888 |
| Montana | -16.37% | 1,084,225 | $5,413 | $5,675 | $5,863 | $5,650 |
| Mississippi | -16.55% | 2,961,279 | $5,302 | $6,658 | $6,012 | $5,991 |
| Illinois | +16.99% | 12,812,508 | $3,803 | $3,909 | $4,058 | $3,924 |
| Louisiana | -18.61% | 4,657,757 | $5,342 | $6,603 | $5,887 | $5,944 |
| Delaware | +18.97% | 989,948 | $4,138 | $4,744 | $4,458 | $4,447 |
| Nebraska | -19.06% | 1,961,504 | $3,669 | $3,896 | $3,675 | $3,747 |
| Washington | +19.20% | 7,705,281 | $4,879 | $5,450 | $5,114 | $5,148 |
| Connecticut | +20.07% | 3,605,944 | $9,634 | $11,111 | $9,079 | $9,941 |
| Utah | -20.48% | 3,271,616 | $3,963 | $4,105 | $4,902 | $4,323 |
| Rhode Island | +20.78% | 1,097,379 | $5,942 | $5,730 | $5,855 | $5,843 |
| New York | +23.13% | 20,201,249 | $6,936 | $5,278 | $6,238 | $6,151 |
| Tennessee | -23.21% | 6,910,840 | $4,109 | $4,082 | $4,340 | $4,177 |
| Alabama | -25.46% | 5,024,279 | $5,367 | $5,887 | $6,015 | $5,757 |
| Kentucky | -25.94% | 4,505,836 | $6,663 | $7,521 | $7,850 | $7,345 |
| South Dakota | -26.16% | 886,667 | $4,739 | $4,547 | $5,520 | $4,935 |
| Arkansas | -27.62% | 3,011,524 | $4,218 | $4,391 | $4,109 | $4,240 |
| California | +29.16% | 39,538,223 | $5,321 | $5,069 | $5,565 | $5,318 |
| Hawaii | +29.46% | 1,455,271 | $5,794 | $6,763 | $8,762 | $7,106 |
| Idaho | -30.77% | 1,839,106 | $4,079 | $4,681 | $5,199 | $4,653 |
| Oklahoma | -33.09% | 3,959,353 | $4,534 | $4,691 | $4,963 | $4,730 |
| Maryland | +33.21% | 6,177,224 | $9,945 | $10,469 | $12,456 | $10,956 |
| North Dakota | -33.34% | 779,094 | $5,250 | $5,244 | $5,266 | $5,254 |
| Massachusetts | +33.46% | 7,029,917 | $6,474 | $6,944 | $6,752 | $6,723 |
| Vermont | +35.41% | 643,077 | $5,720 | $5,835 | $6,742 | $6,099 |
| West Virginia | -38.93% | 1,793,716 | $5,352 | $5,714 | $6,247 | $5,771 |
| Wyoming | -43.38% | 576,851 | $4,399 | $4,154 | $4,802 | $4,451 |
spending_by_geography API, keyless ·
2020 United States presidential election, Wikipedia's own certified state-results table.
