27,617 institution×major rows, bachelor's degrees only (Dept of Education College Scorecard Field-of-Study file). STEM programs' graduates earn $29,220 more a year than Humanities programs' graduates, 4 years after completion, 95% CI [$20,506, $37,935] — excludes zero. Compare the two fields at the very same college and 96% of 734 schools still show STEM ahead, by $25,196 on average.
Run 546 fit selectivity against earnings across 988 colleges and named its own biggest blind spot on the way out: no field-of-study variable at all. An engineering-heavy selective school's earnings premium was, in that data, indistinguishable from a liberal-arts-heavy selective school's. This run supplies the missing variable, using the Scorecard's own field-of-study file — one row per institution × specific bachelor's program — instead of the institution-level file. 27,617 bachelor's-level rows report a non-suppressed median earnings figure 4 years after completion; 5,767 of them sit in a conservative “hard STEM” bucket (Computer & Information Sciences, Engineering, Engineering Technologies, Biological Sciences, Mathematics & Statistics, Physical Sciences, Science Technologies) and 2,369 in an equally conservative Humanities bucket (English, Foreign Languages, Liberal Arts & General Studies, Philosophy & Religious Studies, History, Area/Ethnic/Gender Studies) — both defined before any fit ran, deliberately excluding ambiguous adjacent series like Agriculture, Psychology and Visual & Performing Arts that only partly belong to either camp.
The naive gap is not close, and it survives clustering by major. STEM programs' graduates report a mean earnings of $81,502 4 years out (median $81,574); Humanities programs' graduates report $52,281 (median $51,141). Regressing earnings on a STEM/Humanities indicator, with standard errors clustered by the 115 distinct majors involved (since the same major recurs at dozens of colleges and those rows are not independent draws): $29,220 more a year for STEM, 95% CI [$20,506, $37,935], p=5.0e-11, R²=0.29 — excludes zero. On the log scale the same comparison reads as +53% more earnings, CI [+36%, +72%].
Weight each program cell by how many graduates actually stand behind its earnings figure, and the gap widens rather than shrinks: $32,301 a year, CI [$31,078, $33,524] — though this spec does not cluster by major, so its interval should be read as the more optimistic of the two, not a tighter estimate of the same thing.
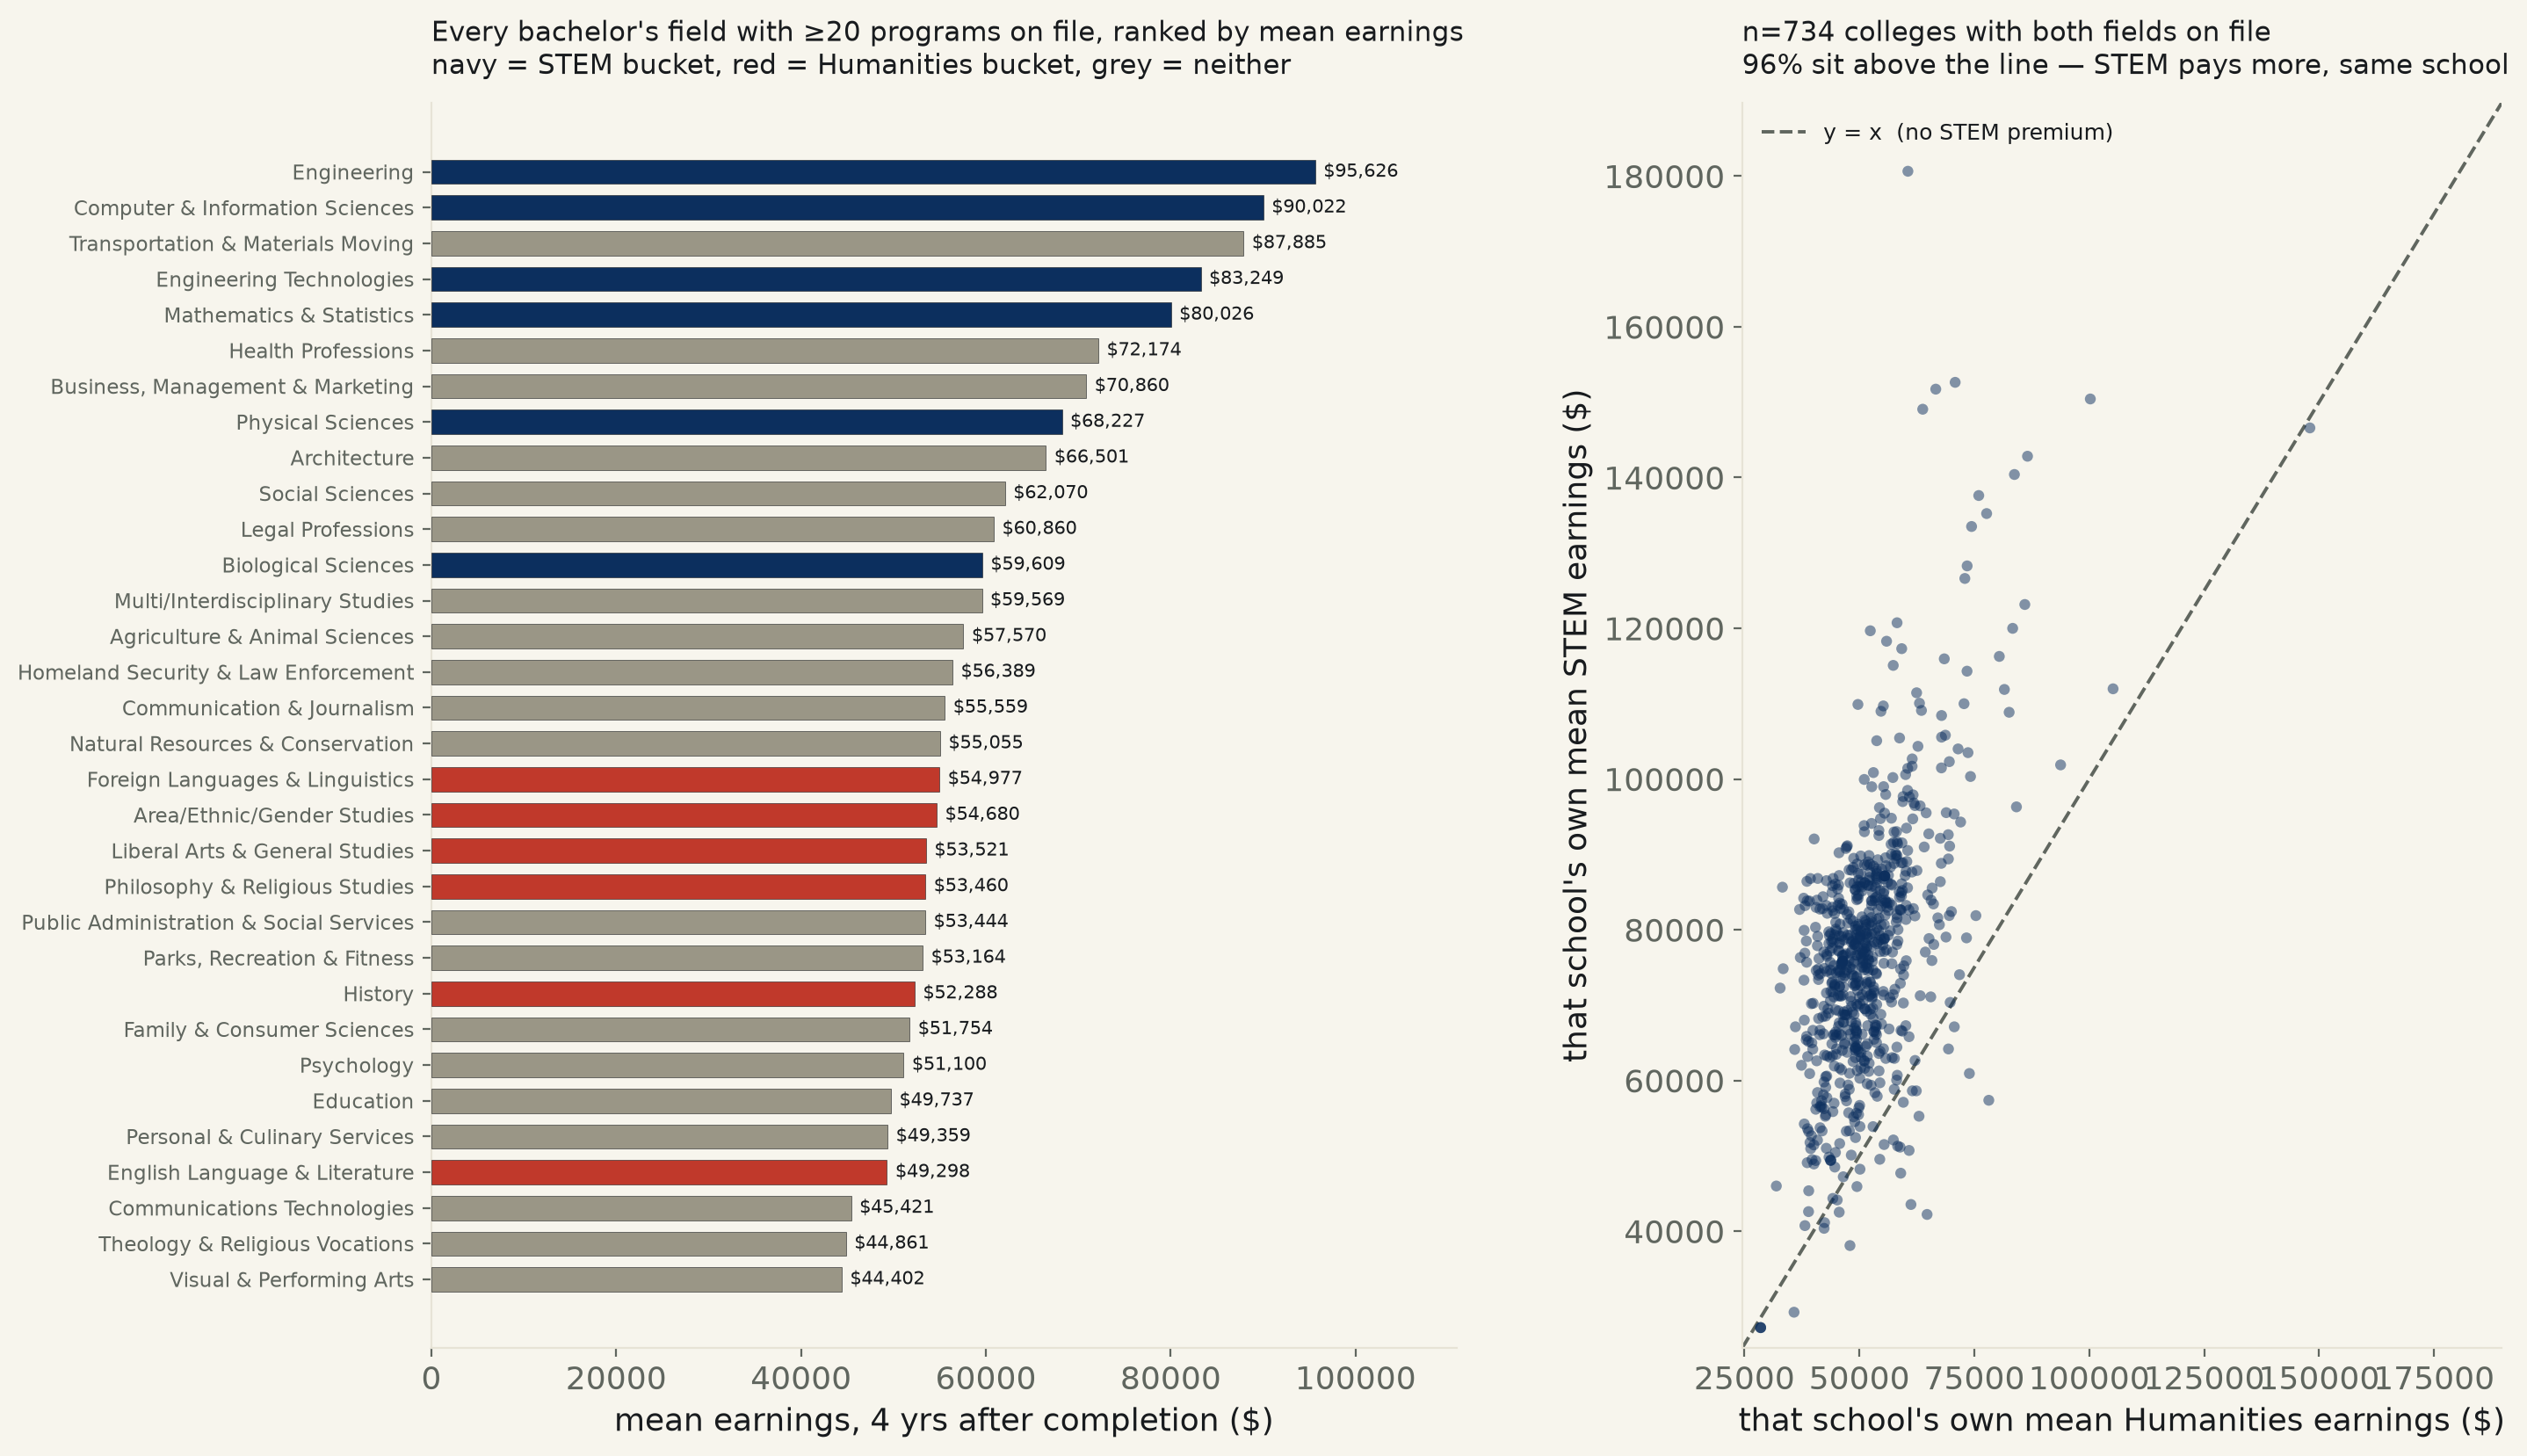
The sharpest check available in this data: compare STEM to Humanities at the very same institution. 734 colleges report a non-suppressed earnings figure for at least one STEM-bucket program and one Humanities-bucket program. Take each college's own mean STEM earnings minus its own mean Humanities earnings — a design that holds school quality, region, cost of living and admissions selectivity fixed by construction, since both numbers come from the same building — and the gap is $25,196, 95% CI [$24,182, $26,210], p=2.5e-232. 96% of the 734 colleges show STEM ahead of Humanities at that same school; the gap is not carried by a handful of outlier universities.
Named, and the full 32-field ranking undercuts easy cherry-picking in either direction. The single highest-earning row in the whole sample is Duke University's Mathematics program ($297,029, n=17 graduates) — a STEM row, as expected. But the field that pays worst of all 32, lower than either bucket's average, is Visual & Performing Arts ($44,402 mean, n=1,672) — a field in neither this run's STEM nor Humanities bucket. Transportation & Materials Moving, also outside both buckets, out-earns three of the seven STEM fields. The lowest single row in the sample is Caribbean University-Bayamon's Allied Health and Medical Assisting Services program ($16,087, n=26). The six Humanities fields cluster tightly between $49,298 and $54,977 — solidly in the bottom third of all 32 fields, but not literally the six lowest-paying fields on the page.
Read plainly, and with the limitation this design cannot remove. The STEM-Humanities earnings gap is real, well-estimated, survives major-clustering, survives graduate-count weighting, and survives holding the college itself fixed. What none of these three specs can do is separate a major's own causal return from who chooses it: students who select Engineering over English may differ systematically — in quantitative preparation, risk tolerance, or family background — from students who select the reverse, the same selection problem run 546 could not fully rule out for choice of college. Nor is this a full cost-benefit ROI calculation: the Scorecard's field-of-study file has no tuition-by-major figure, so this run compares earnings only, not earnings net of what each degree cost to obtain. And it is a single snapshot, 4 years after completion — not a lifetime-earnings trajectory, where some contested claims argue humanities majors narrow the gap later in their careers. This run cannot speak to that; it can only say what the numbers say at year 4, which is that the gap is large, it is not close, and it holds up inside the same school.
| Specification | STEM − Humanities, $/yr | 95% CI | Verdict |
|---|---|---|---|
| Naive, major-clustered (n=8,136, 115 majors) | $29,220 | [$20,506, $37,935] | excludes zero, p=5e-11 |
| Graduate-count-weighted, not clustered (n=8,136) | $32,301 | [$31,078, $33,524] | excludes zero, p<1e-300 |
| Paired within institution (n=734 colleges) | $25,196 | [$24,182, $26,210] | excludes zero, p=2.5e-232 |
Every bachelor's field with ≥20 programs on file, ranked by mean earnings:
| Field (2-digit CIP series, ≥20 programs) | n | mean earnings | median earnings |
|---|---|---|---|
| Engineering | 1,792 | $95,626 | $93,642 |
| Computer & Information Sciences | 1,284 | $90,022 | $86,234 |
| Transportation & Materials Moving | 61 | $87,885 | $85,147 |
| Engineering Technologies | 414 | $83,249 | $83,322 |
| Mathematics & Statistics | 413 | $80,026 | $73,882 |
| Health Professions | 2,748 | $72,174 | $71,696 |
| Business, Management & Marketing | 4,562 | $70,860 | $68,490 |
| Physical Sciences | 490 | $68,227 | $66,908 |
| Architecture | 175 | $66,501 | $65,863 |
| Social Sciences | 2,113 | $62,070 | $58,540 |
| Legal Professions | 88 | $60,860 | $57,570 |
| Biological Sciences | 1,361 | $59,609 | $58,622 |
| Multi/Interdisciplinary Studies | 582 | $59,569 | $56,216 |
| Agriculture & Animal Sciences | 367 | $57,570 | $54,751 |
| Homeland Security & Law Enforcement | 832 | $56,389 | $55,394 |
| Communication & Journalism | 1,230 | $55,559 | $54,717 |
| Natural Resources & Conservation | 375 | $55,055 | $53,991 |
| Foreign Languages & Linguistics | 375 | $54,977 | $54,184 |
| Area/Ethnic/Gender Studies | 173 | $54,680 | $54,187 |
| Liberal Arts & General Studies | 492 | $53,521 | $52,545 |
| Philosophy & Religious Studies | 133 | $53,460 | $53,127 |
| Public Administration & Social Services | 658 | $53,444 | $52,143 |
| Parks, Recreation & Fitness | 751 | $53,164 | $52,482 |
| History | 460 | $52,288 | $50,592 |
| Family & Consumer Sciences | 370 | $51,754 | $50,518 |
| Psychology | 1,226 | $51,100 | $50,323 |
| Education | 1,382 | $49,737 | $49,036 |
| Personal & Culinary Services | 32 | $49,359 | $47,574 |
| English Language & Literature | 736 | $49,298 | $48,460 |
| Communications Technologies | 106 | $45,421 | $44,440 |
| Theology & Religious Vocations | 121 | $44,861 | $44,988 |
| Visual & Performing Arts | 1,672 | $44,402 | $42,989 |
Method. U.S. Dept of Education College Scorecard, "Most Recent Cohorts (Field of Study)" bulk CSV, keyless (the JSON API needs a free key; this bulk file does not). Filtered to CREDLEV=3 (bachelor's degree programs), then to the 27,617 of those with a non-suppressed EARN_MDN_4YR (Scorecard's own field-of-study earnings measure: median earnings of graduates working and not enrolled, 4 years after completing that specific program at that specific institution, built from Treasury tax data) and its supporting graduate count. Fields are grouped by the standard NCES Classification of Instructional Programs 2-digit series. STEM = Computer & Information Sciences (CIP 11), Engineering (14), Engineering Technologies (15), Biological Sciences (26), Mathematics & Statistics (27), Physical Sciences (40), Science Technologies (41) — the conservative “hard sciences plus engineering and computing” core, deliberately excluding Agriculture, Psychology and Health Professions, which are only partly STEM depending on sub-field. Humanities = Area/Ethnic/Gender Studies (05), Foreign Languages & Linguistics (16), English Language & Literature (23), Liberal Arts & General Studies (24), Philosophy & Religious Studies (38), History (54) — excluding the adjacent Visual & Performing Arts and Theology series. Both bucket definitions were fixed before any fit ran.
Limits, stated plainly. This run measures an earnings differential, not a causal return to choice of major and not a full cost-adjusted ROI — the field-of-study file carries no tuition-by-major figure, so cost of attendance is not netted out. It cannot separate “this major causes higher pay” from “the kind of student who selects this major would have earned more regardless,” the identical selection problem run 546 named for choice of college; the paired within-institution spec controls for the school but not for which students self-select into which major once enrolled. It is also a single 4-years-after-completion snapshot, not a lifetime-earnings trajectory — it cannot confirm or rule out claims that some fields' earnings gaps narrow later in a career. And EARN_MDN_4YR itself excludes anyone still enrolled (in graduate school, for instance) 4 years out, which plausibly undercounts some Humanities graduates pursuing a law degree or PhD more than it undercounts STEM graduates entering the workforce directly — a real, stated, unresolved limitation of this specific outcome window.
