28,221 Spotify tracks, six genres, 1970–2020. Spotify's own valence score (0=sad/dark, 1=happy/upbeat) falls -0.00486 points a year across the full record, 95% CI [-0.00557, -0.00415] — excludes zero, and every one of the six genres agrees independently. But split the record at 2010 and neither era alone can confirm it: pre-2010 CI [-0.00118, +0.00004], post-2010 CI [-0.01266, +0.00208] — both contain zero.
“Music is getting sadder” is a claim that circulates every few years, usually alongside a chart of some lyric-sentiment or key-signature trend. This run tests a more direct, if narrower, version: Spotify's own valence score, a 0.0–1.0 measure of a track's own algorithmically-scored musical positiveness (happy, cheerful, euphoric at the high end; sad, depressed, angry at the low end) — not a lyric analysis, not a listener survey. The source is the same TidyTuesday/Spotify pull run 528 used for song length, refetched here to keep the audio-feature columns that run dropped: 28,221 tracks across six genre-defining playlists, deduplicated by track ID, 1970–2020, after excluding 135 tracks from the sparse 1957–1969 window for the identical reason run 528 did.
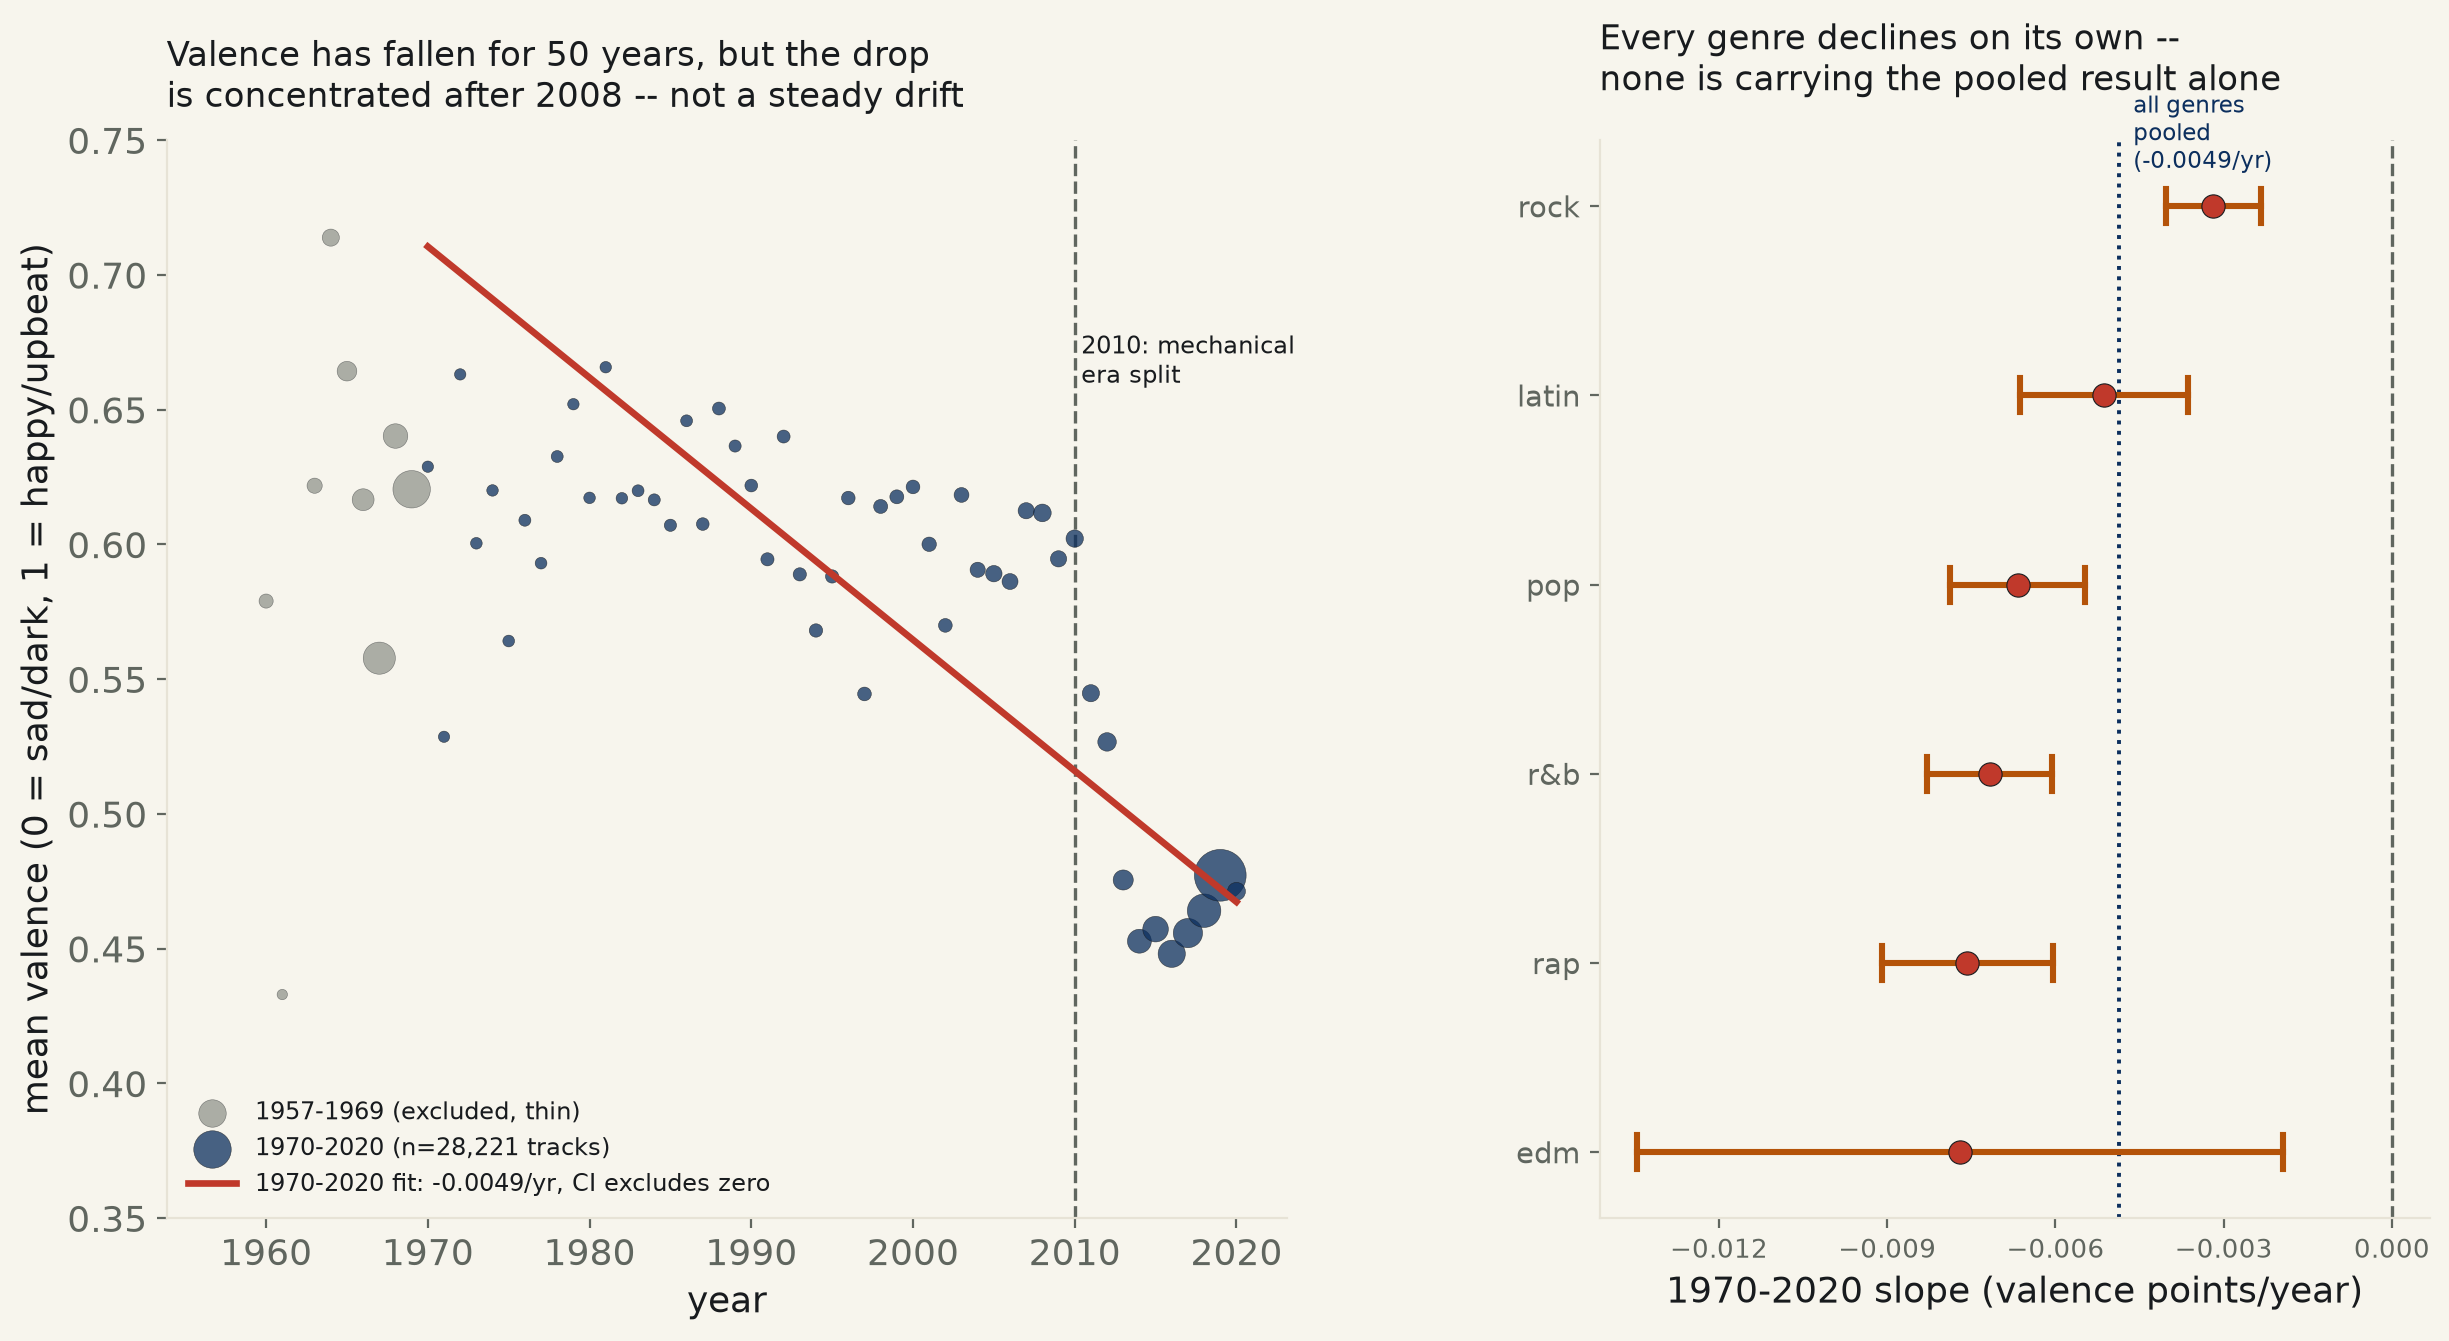
The full record says yes, clearly. Pooled across all six genres, with standard errors clustered by year (51 independent year-clusters, since many tracks share a release year): valence falls -0.00486 points a year, 95% CI [-0.00557, -0.00415], p=3.5e-41, R²=0.051 — excludes zero, agreeing with a 4,000-draw year-block bootstrap (CI [-0.00568, -0.00405], 100% of resamples negative). Restricted to the “pop” playlist genre specifically — the literal claim — the decline is steeper: -0.00667 points/year, CI [-0.00787, -0.00547], p=1.7e-27, bootstrap agreeing (CI [-0.00811, -0.00553]). Every one of the dataset's six genres declines on its own, independently — from rock's shallow -0.00318/yr to edm's -0.00770/yr — so this isn't one genre's mood dragging a pooled average down.
It is not a steady 50-year drift. Decade means: 0.609 in the 1970s, 0.628 in the 1980s, 0.599 in the 1990s, 0.600 in the 2000s — four decades hovering within four hundredths of each other — then 0.474 in the 2010s and 0.471 in the partial 2020 sample. A quadratic term on the full pooled fit confirms the curve genuinely bends downward rather than running straight: -0.000155 per year², 95% CI [-0.000223, -0.000088], p=7.1e-06 — excludes zero. Whatever is happening, it is concentrated in the back third of the record, not distributed evenly across it.
Split the record at a mechanical decade boundary, 2010, and the era-specific picture blurs. Pre-2010 alone: -0.00057 points/year, CI [-0.00118, +0.00004], p=0.068 — contains zero, a year-block bootstrap agreeing at the edge (96.8% of resamples negative, short of this desk's 95% bar). 2010–2020 alone, despite the dramatic-looking drop in the decade means above: -0.00529, CI [-0.01266, +0.00208], p=0.159 — also contains zero (bootstrap CI [-0.01620, +0.00231], 91.9% negative). A formal interaction test on whether the slope itself changed at 2010 contains zero too: -0.00472, CI [-0.01184, +0.00240], p=0.194. The honest reading: the post-2010 era has only 11 independent year-clusters to fit a slope against, a real ceiling on how precisely this design can pin down a single decade's own rate — the pooled 51-year record, with 51 year-clusters, is the only spec with enough independent observations to clear this desk's bar.
One obvious confound checked: is this just newer playlists padded with obscure low-valence filler, not real hits getting sadder? Restrict every year to its own top half by Spotify's own track-popularity score (a check on whether the decline survives once the least-known, most likely algorithmically-added tracks in each year are dropped): -0.00434 points/year, CI [-0.00516, -0.00351], p=1.1e-24 — still excludes zero, at 89% of the full-sample slope. The decline is not an artifact of recent years' playlists being padded with tracks nobody actually listened to.
Named, and a real data quirk disclosed rather than hidden: the single happiest track in the sample is War's “Low Rider” (2003, valence 0.991); the saddest track that is an actual song of ordinary length is Hidden Empire's “Computer Music” (2016, valence 0.0269). 26 of the very lowest-valence rows are not really “sad songs” at all — they're ambient rain- and forest-sound tracks (“Rain Forest and Tropical Beach Sound,” “Chill Waves & Wind in Leaves”) that Spotify's own curators filed under a “tropical” playlist subgenre, plus a handful of sub-minute clips including a literal 4-second spoken snippet scored valence 0.0 — 50 such rows in total are excluded from the two named anchors above, though they remain in every regression, since they are real Spotify-scored rows, just not what a listener would call “a song.”
Read plainly: the full-record decline is real and survives every check this run threw at it, but it cannot be pinned to a specific decade. Fifty years of Spotify's own mood score, across every genre in the sample and independent of playlist popularity, moved toward “sadder.” The visually dramatic-looking break after 2008 is consistent with that decline, but a formal test of either era alone — or of whether the rate actually changed at 2010 — does not clear this desk's bar, because a single decade supplies too few independent year-observations to test precisely on its own.
| Specification | valence pts / yr | 95% CI | Verdict |
|---|---|---|---|
| All 6 genres pooled, 1970-2020 (n=28,221) | -0.00486 | [-0.00557, -0.00415] | excludes zero, p=3.5e-41 |
| Pop genre only (n=4,590) | -0.00667 | [-0.00787, -0.00547] | excludes zero, p=1.7e-27 |
| Pre-2010 only (n=7,761) | -0.00057 | [-0.00118, +0.00004] | contains zero, p=0.068 |
| 2010-2020 only (n=20,460) | -0.00529 | [-0.01266, +0.00208] | contains zero, p=0.16 |
| Top-half-by-popularity subset (n=14,299) | -0.00434 | [-0.00516, -0.00351] | excludes zero, p=1.1e-24 |
By genre, full 1970-2020 window, year-clustered:
| Genre | n | slope (pts/yr) | 95% CI | p |
|---|---|---|---|---|
| pop | 4,590 | -0.00667 | [-0.00787, -0.00547] | 1.7e-27 |
| rock | 4,245 | -0.00318 | [-0.00402, -0.00234] | 1e-13 |
| r&b | 4,715 | -0.00718 | [-0.00829, -0.00607] | 7.6e-37 |
| rap | 5,225 | -0.00757 | [-0.00910, -0.00604] | 3.5e-22 |
| edm | 5,161 | -0.00770 | [-0.01346, -0.00194] | 0.0088 |
| latin | 4,285 | -0.00514 | [-0.00663, -0.00364] | 1.6e-11 |
Method. TidyTuesday's 2020-01-21 release of Spotify Web API audio-feature data (originally Kaylin Pavlik's spotifyr pull of six genre-defining Spotify playlists — pop, rock, r&b, rap, edm, latin — republished by the R for Data Science Learning Community), keyless GitHub raw CSV, the same underlying source as run 528. 135 tracks from 1957–1969 are excluded from every fit for the same reason run 528 excluded them: fewer than 15 tracks/year in that span. 28,221 unique tracks remain, deduplicated by Spotify track ID across playlist placements. Valence is Spotify's own audio-analysis output, not independently verified by this run. Year-clustered standard errors treat each release year, not each song, as the unit of an independent observation, since many songs released the same year are not independent draws; the year-block bootstrap (4,000 resamples of whole years) is a nonparametric cross-check on the same logic.
Limits, stated plainly. Same sampling limits as run 528, since it's the same source: not a random or representative sample of all recorded music, skewed heavily toward recent years (2019 alone contributes over a quarter of the fitted rows), and limited to six broad Anglophone-market-adjacent genres — missing classical, jazz, country, and non-Western music entirely. Valence is Spotify's own algorithmic estimate of a track's positiveness, a different and more indirect measure than the lyric-sentiment or key-signature analyses the popular “music is getting sadder” claim often actually invokes; this run cannot speak to those other operationalizations. The post-2010 window has only 11 independent year-clusters, a real ceiling on how precisely any single decade's rate can be estimated with this method, not a defect specific to this run's choice of split year — a genuine within-decade acceleration or deceleration could exist and still fail to clear this desk's bar on this much data.
