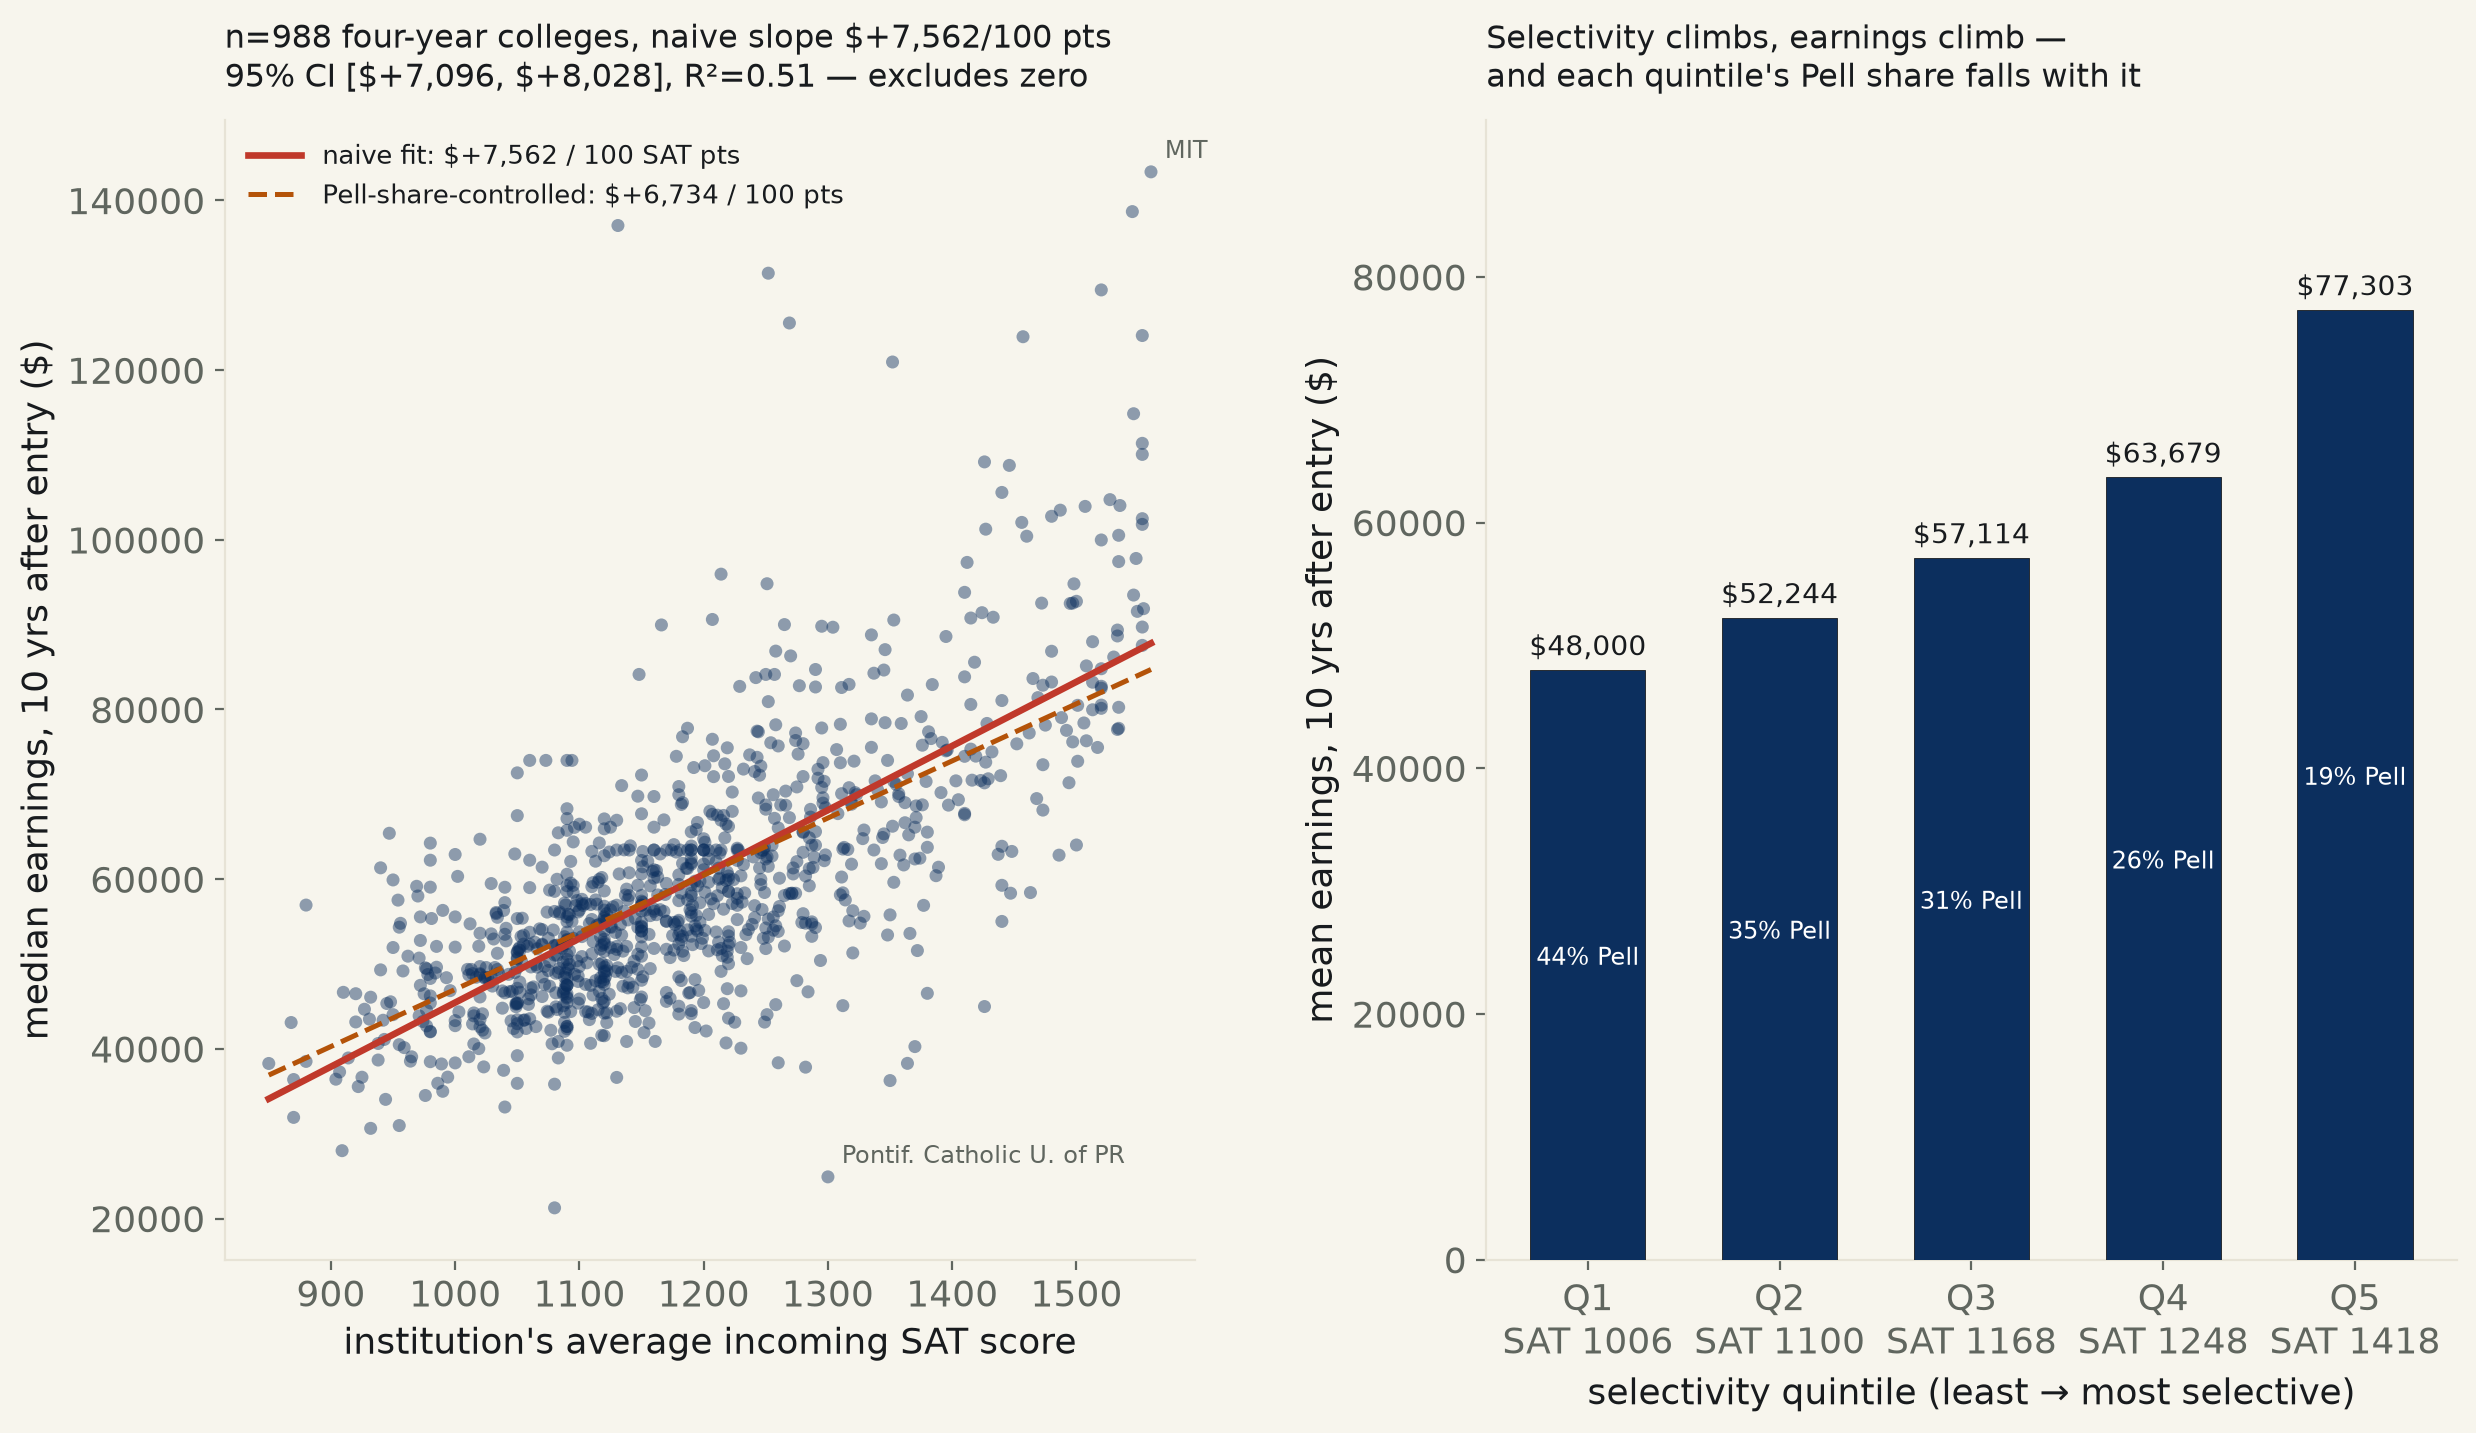
988 US four-year, bachelor's-predominant colleges (Dept of Education College Scorecard, keyless bulk file). Every 100 points of a school's average incoming SAT score tracks with $7,562 more in its graduates' median earnings 10 years out, 95% CI [$7,096, $8,028] — excludes zero. Control for the school's own Pell-grant share, the closest proxy this data has for “who gets in,” and it barely moves: $6,734, CI [$6,110, $7,358].
The "prestige premium" story says a more selective college buys a real earnings bump. The counter-story, built on Alan Krueger & Stacy Dale's 2002 and 2011 papers, says it mostly doesn't — compare students who were admitted to the same set of schools but chose differently, and the selectivity effect mostly vanishes for all but the lowest-income applicants. This run cannot run the Dale-Krueger design; that needs individual admissions records nobody publishes. What it can do, honestly, at the institution level: the Department of Education's own College Scorecard, 988 US four-year, bachelor's-predominant public or private-nonprofit colleges, each one's own average incoming SAT score against its own graduates' median earnings 10 years after entry.
The naive relationship is not close. Every additional 100 points of a school's average incoming SAT score tracks with $7,562 more in its graduates' median earnings a decade out, 95% CI [$7,096, $8,028], R²=0.51 — excludes zero by a wide margin. On the log scale the same fit reads as +12.5% more earnings per 100 SAT points, CI [+11.7%, +13.3%].
Add the best available "who gets in" proxy, and the slope barely moves. A school's own Pell-grant share — the fraction of its undergrads who qualify for a federal need-based grant, the closest thing this level of aggregation has to a socioeconomic-mix control — is itself a strong, independent predictor of earnings (-135 dollars per percentage point, p=1.7e-04), and it is itself predicted by selectivity: every 100 SAT points tracks with -5.8 fewer percentage points of Pell enrollment, CI [-6.2, -5.4] — more selective schools enroll a richer student body, the textbook confound path. Controlling for it anyway: the SAT slope moves from $7,562 to $6,734, CI [$6,110, $7,358] — an 11% reduction, still nowhere near zero. Sector (public vs. private nonprofit) adds nothing once selectivity and Pell share are in the model, p=0.49.
Trim the outliers and the number moves but the verdict doesn't. Dropping the 5% highest- and lowest-earning schools: $5,641 per 100 points, CI [$5,241, $6,040] — still excludes zero.
Named, concretely: the table's own edges are the tell for what this run can't control. Massachusetts Institute of Technology tops both lists at once — SAT 1560, median earnings $143,372 — and it is a school whose degrees are overwhelmingly engineering and computer science, fields that pay a premium independent of any admissions filter. University of Connecticut-Waterbury Campus (SAT 1060, unselective by this sample's standards) still clears $73,997 in median earnings, 52% Pell. This run has no field-of-study variable at all — it cannot tell an engineering-heavy selective school's earnings premium from a liberal-arts-heavy selective school's, and that gap, not admissions selectivity itself, is the leading alternative explanation the actual Dale-Krueger literature spends most of its effort ruling out.
Read plainly: at the institution level, and with the only confound proxy this data supports, selectivity and earnings move together and the relationship survives the check. That is a real, well-estimated correlation across 988 colleges — not proof that attending a more selective school causes the earnings gap for any individual student who could have gotten in elsewhere, which is the specific question Dale-Krueger's matched-applicant design was built to answer and this one was not.
| Specification | $ earnings / 100 SAT pts | 95% CI | Verdict |
|---|---|---|---|
| Naive, dollar scale (n=988) | $7,562 | [$7,096, $8,028] | excludes zero, p=1.8e-153 |
| Controlled for Pell share + sector (n=988) | $6,734 | [$6,110, $7,358] | excludes zero, p=2.8e-82 |
| Middle 90% by earnings, outlier-trimmed (n=888) | $5,641 | [$5,241, $6,040] | excludes zero, p=3.4e-122 |
Method. US Dept of Education College Scorecard, "Most Recent Cohorts (Institution)" bulk CSV, keyless (the JSON API requires a free key; this bulk file does not). Filtered to PREDDEG=3 (bachelor's-predominant), ICLEVEL=1 (four-year), CURROPER=1 (currently operating), CONTROL in {public, private nonprofit} (for-profit colleges excluded — a different, mostly selectivity-less market this run isn't built to test), then to the 988 of those with a non-suppressed average SAT score, median 10-year earnings, and Pell share on file. Selectivity = SAT_AVG, the institution's own admitted-student average. Earnings = MD_EARN_WNE_P10, median earnings of students working and not enrolled 10 years after entry, Scorecard's own standard outcome measure. The "who gets in" control is PCTPELL, the share of undergrads receiving a Pell grant — an institution-level proxy for the incoming student body's socioeconomic mix, not an individual-level match.
Limits, stated plainly. This is not the Dale-Krueger design. Dale & Krueger compared individual students who were admitted to comparable sets of schools but chose different ones — holding the applicant's own ability and ambition fixed and varying only which school they attended. Nothing here holds an applicant fixed; every row is one college's own average, and no admissions data links individual students to individual outcomes. The single biggest omitted variable is field of study: engineering- and CS-heavy schools (MIT tops both the SAT and earnings columns in this sample) pay a premium that has nothing to do with how hard the school is to get into, and this dataset carries no major-mix field to separate that from a pure selectivity effect. Regional cost-of-living differences in the 10-years-out earnings figure are also uncontrolled. Read this run as: selectivity and earnings correlate strongly and the correlation survives the one confound this data can check — not as a causal estimate of what a given student would gain by attending a more selective school.
