World Bank Open Data, 4,747 country-years across 162 aid-recipient countries, 1990–2023. Same-year: every point of ODA/GNI tracks with -0.044 points less growth that year, CI excludes zero — but that's aid arriving during wars and collapses, not causing them. Lag it one year and the sign flips positive, CI [-0.005, +0.082] — contains zero. The long-run, literature-standard design finds nothing either way.
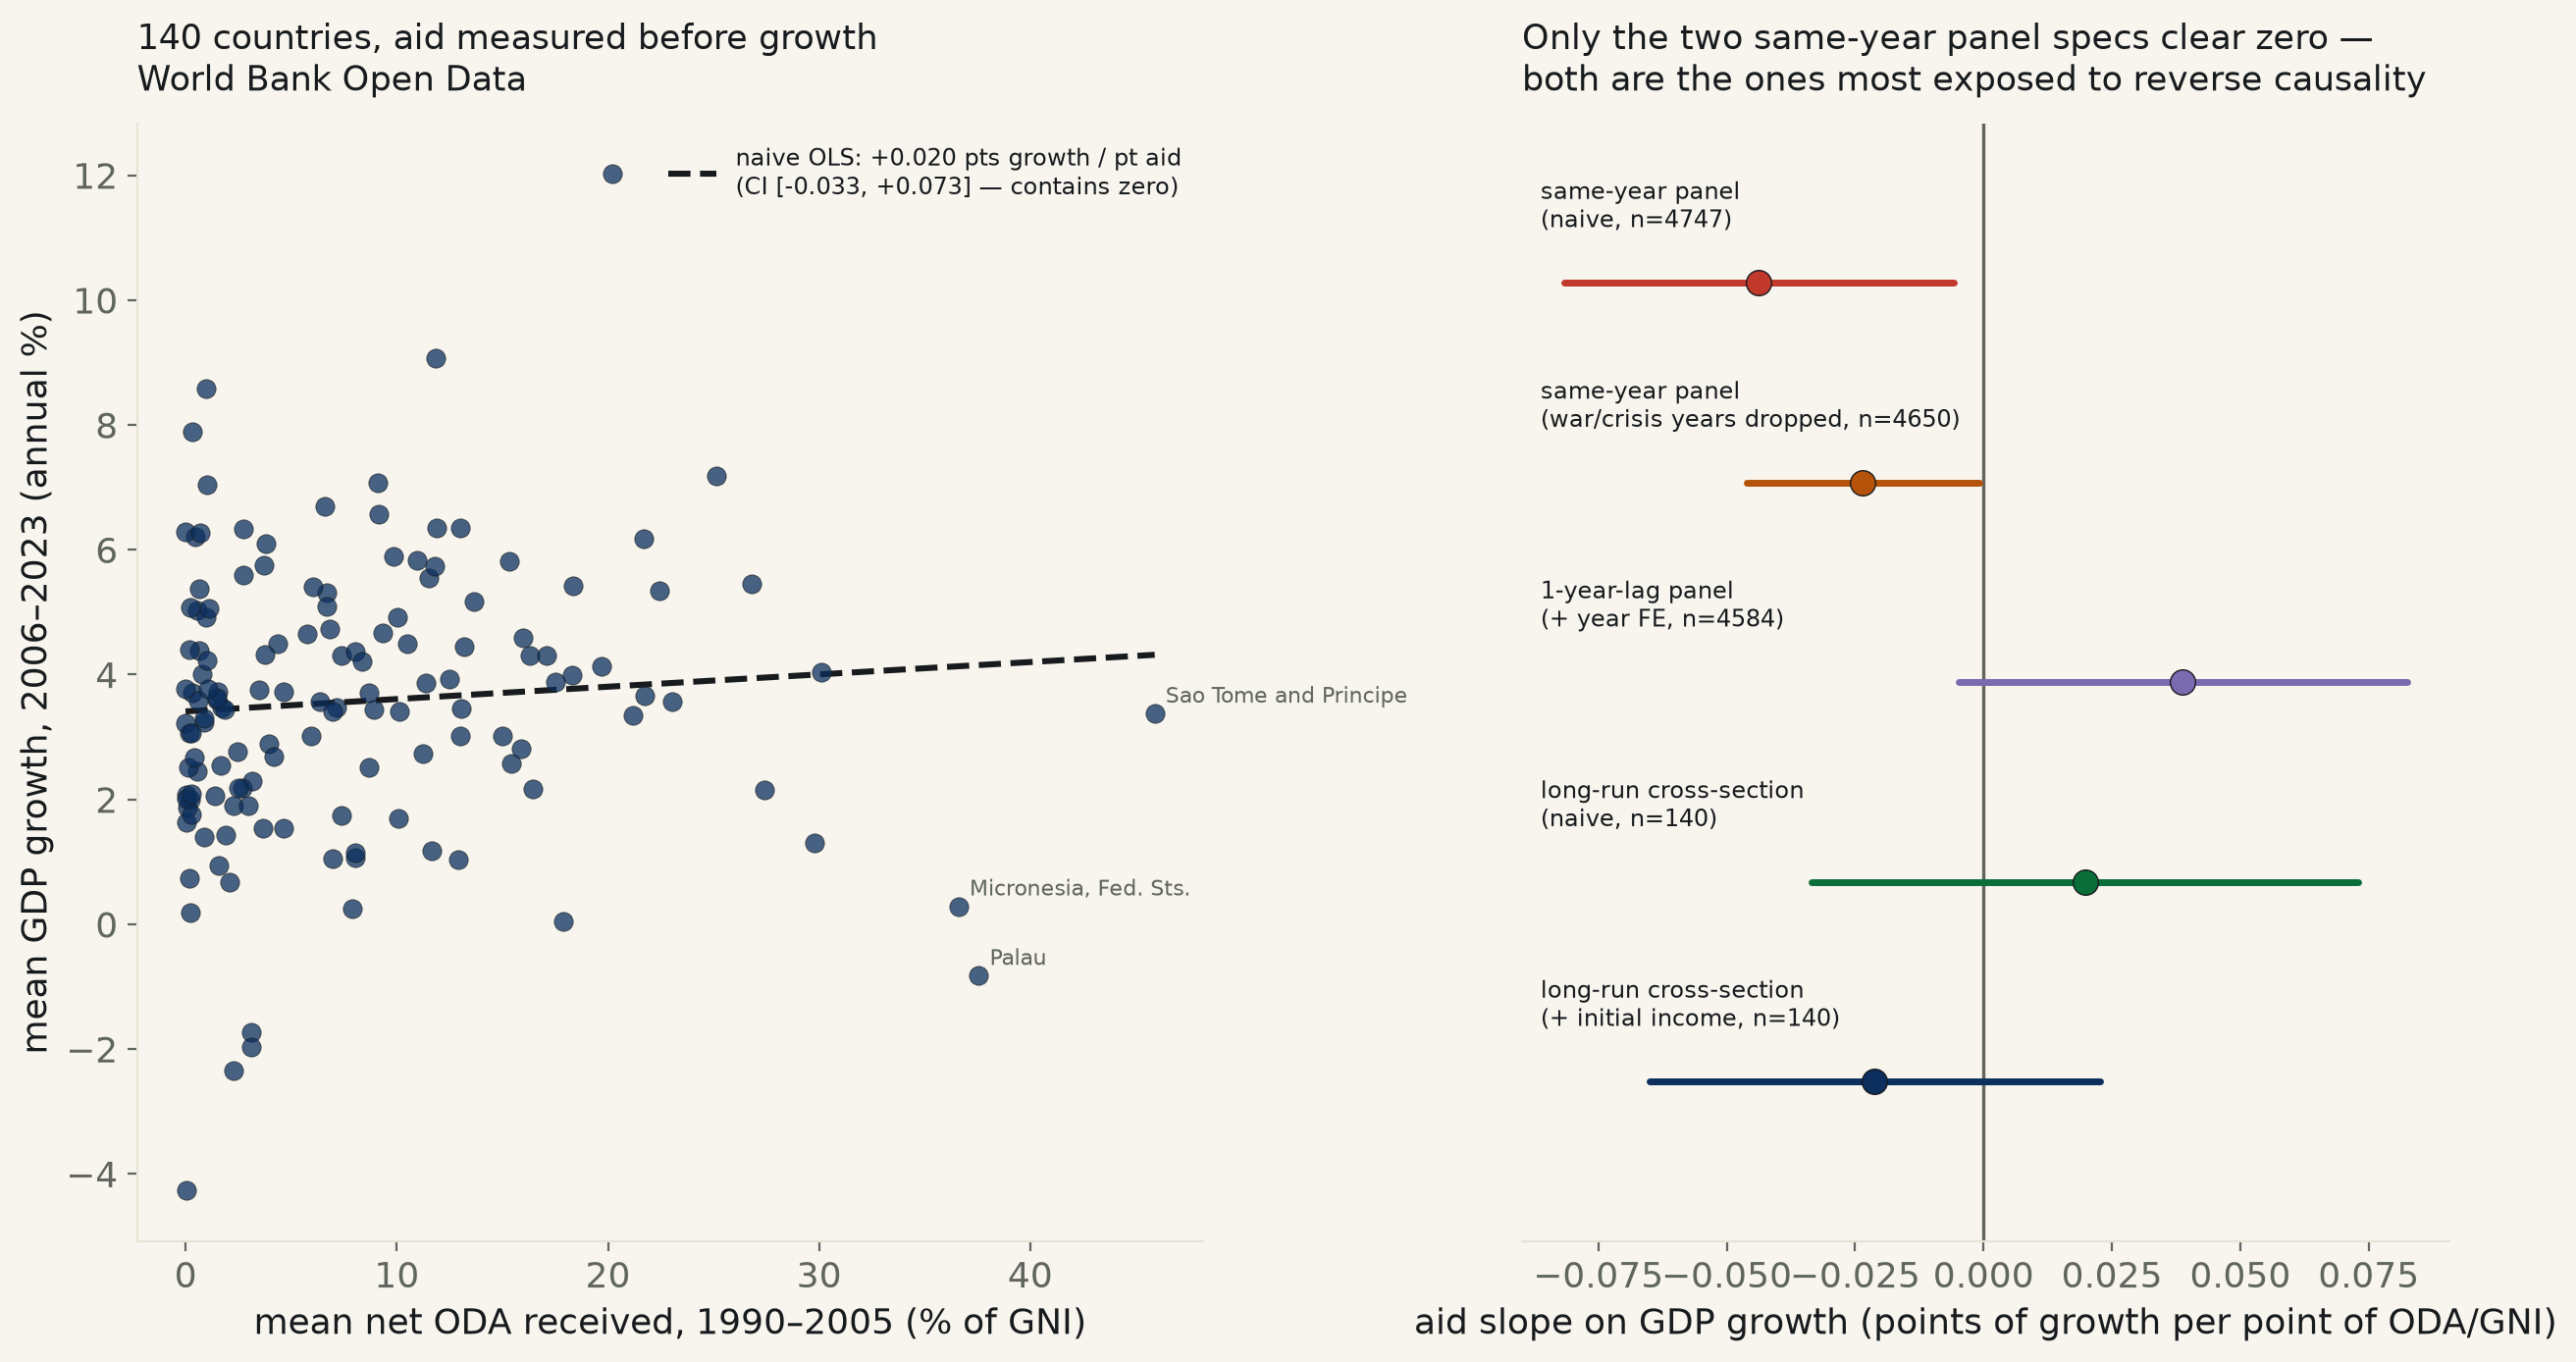
Foreign aid has been arguing with itself for thirty years. One camp (Jeffrey Sachs, the UN Millennium Development Goals apparatus) says a large enough transfer can break the poverty trap and pay for itself in growth. Another (William Easterly, Dambisa Moyo's Dead Aid) says aid props up bad governments, crowds out local institutions, and may even slow the growth it's meant to speed up. This run builds a World Bank panel — Net ODA received as a share of GNI, matched to GDP growth, 4,747 country-years across 162 aid-recipient countries, 1990–2023 — and tests the claim five ways, each spec built to close a gap the previous one left open.
The naive, same-year comparison looks like it settles the fight against aid. Pooled across every country-year, with standard errors clustered by country: every additional point of ODA/GNI tracks with -0.044 points less GDP growth that same year, 95% CI [-0.082, -0.006], p=0.024 — excludes zero. But the two countries doing the most work in that number are wars, not aid failures: Iraq in 1991 received ODA equal to 137.6% of its GNI the same year its economy shrank 64.0% (the Gulf War); Rwanda in 1994 received 94.9% of GNI in aid the same year its economy collapsed 50.2% (the genocide). Aid arrives because a country is in crisis — a same-year correlation cannot tell a dollar that responded to a catastrophe from a dollar that caused one.
Drop the literal war/collapse years and the same-year gap survives, but it's cut in half and it's barely there. Excluding the 97 country-years with GDP growth beyond ±20% (the crisis outliers, not a cherry-picked cut): -0.023 points, 95% CI [-0.046, -0.001], p=0.042 — still technically excludes zero, but the upper bound of that interval sits at -0.0008, a hair's width from it. Shift to a one-year lag — this year's aid against next year's growth, with year fixed effects, removing the same-year crisis-response channel entirely — and the sign flips positive: +0.039, 95% CI [-0.005, +0.082], p=0.081 — contains zero. Whatever the same-year number was picking up, it does not survive removing the possibility that aid is reacting to, not producing, the growth number next to it.
The design the actual academic literature on aid effectiveness uses finds nothing either. Burnside & Dollar (2000) and, more skeptically, Rajan & Subramanian (2008) test aid's effect on growth by measuring aid in an early window and growth in a later, non-overlapping one — exactly what a same-year panel can't do. Rebuilt here: mean ODA/GNI 1990–2005 against mean GDP growth 2006–2023, one row per country, 140 countries with sufficient coverage in both windows. Naive: +0.020 points of later growth per point of earlier aid, 95% CI [-0.033, +0.073], p=0.466 — contains zero. Add each country's own 1990 income as a control (the standard convergence term in growth regressions — poorer countries mechanically tend to grow faster, which could confound a raw aid comparison since aid also flows disproportionately to poorer countries): the aid slope flips sign again, -0.021, CI [-0.065, +0.023], p=0.343 — still contains zero. The control itself is doing real, expected work — initial income alone predicts subsequent growth at -0.785 points per log-dollar, CI [-1.058, -0.512], p=1.7e-08, a textbook convergence effect — so this is a regression finding a real signal where one exists and still finding nothing for aid.
Named, concretely: neither the heaviest aid recipients nor the lightest stand out. São Tomé and Príncipe took in the most aid in the early window, 45.9% of GNI on average, and grew at 3.37%/year afterward — almost exactly the 140-country sample's own middle. Palau, the second-heaviest recipient (37.6%), shrank −0.83%/year. Meanwhile Brazil and Libya, which received essentially no aid at all in the early window (0.03% and 0.02% of GNI), grew at 2.07% and 2.02% — unremarkable, not obviously worse or better for having skipped the aid the theory says should have helped them. A scatter of all 140 countries (right) shows why: there is no visible slope in either direction.
Read plainly: this desk can confirm neither side of the aid debate. The one spec that clears zero — the same-year comparison — is also the one most contaminated by aid flowing toward crises, and it stops clearing zero comfortably the moment the crisis years are removed or the timing is lagged by a single year. The design built specifically to avoid that contamination, cross-country and cross-time, finds an interval containing zero whether or not initial income is controlled. That is not proof aid does nothing for any single country in any single program — it means thirty-four years of the World Bank's own aid and growth data, at this level of aggregation, cannot distinguish a real effect from none.
| Specification | pts of GDP growth / pt of ODA-%-GNI | 95% CI | Verdict |
|---|---|---|---|
| Same-year panel, naive (n=4,747) | -0.0438 | [-0.0817, -0.0059] | excludes zero, p=0.024 |
| Same-year panel, war/crisis years dropped (n=4,650) | -0.0235 | [-0.0462, -0.0008] | excludes zero, p=0.042 |
| 1-year-lag panel, + year FE (n=4,584) | +0.0388 | [-0.0048, +0.0824] | contains zero, p=0.081 |
| Long-run cross-section, naive (n=140) | +0.0198 | [-0.0334, +0.0729] | contains zero, p=0.47 |
| Long-run cross-section, + initial income (n=140) | -0.0212 | [-0.0651, +0.0227] | contains zero, p=0.34 |
Method. World Bank Open Data, three keyless indicators: DT.ODA.ODAT.GN.ZS (net ODA received, % of GNI — null for high-income donor countries, which is expected and excludes them from every fit here, not a data gap), NY.GDP.MKTP.KD.ZG (GDP growth, annual %, constant prices), NY.GDP.PCAP.CD (GDP per capita, current US$, used only for the 1990 initial-income control). The same-year and one-year-lag specs use the full 4,747-row country-year panel, 1990–2023, 162 countries, standard errors clustered by country (and, for the lag spec, year fixed effects to net out global growth cycles common to every country in a given year). The long-run cross-section follows Burnside & Dollar (2000) and Rajan & Subramanian (2008): each of 140 countries with at least 8 of 16 years of ODA data in 1990–2005 and at least 12 of 18 years of growth data in 2006–2023 contributes one row, its own mean ODA/GNI in the early window against its own mean growth in the later window — aid is measured strictly before the growth it's tested against, the standard fix for the same-year reverse-causality problem. The income control uses each country's GDP per capita in 1990, or the nearest available year within 1988–1992 where 1990 itself is missing.
Limits, stated plainly. ODA received measures the volume of aid, not its quality, targeting, or how it was actually spent — this run cannot distinguish a well-run vaccination program from a diverted transfer, only test whether more aid, on average, associates with more or less growth. The sample is aid-eligible countries only by construction (162 of 217 in the panel, 140 in the cross-section); this is not a comparison of aid-receiving countries against a randomly assigned no-aid control group, and a country's eligibility for aid at all is itself correlated with its starting conditions. Even the long-run design cannot fully rule out a slow-moving confound like institutional quality, which plausibly shapes both how much aid a country attracts or needs and its own subsequent growth, and no separate governance measure is included here. n=140 in the cross-section is a real ceiling on how small an effect this design could detect — a genuinely modest aid effect, in either direction, could exist and still fail to clear this desk's bar on this sample size.
aid_growth_panel_545.csv (full country-year panel) · aid_growth_crosssection_545.csv (140-country long-run cross-section) · fit output (JSON).
