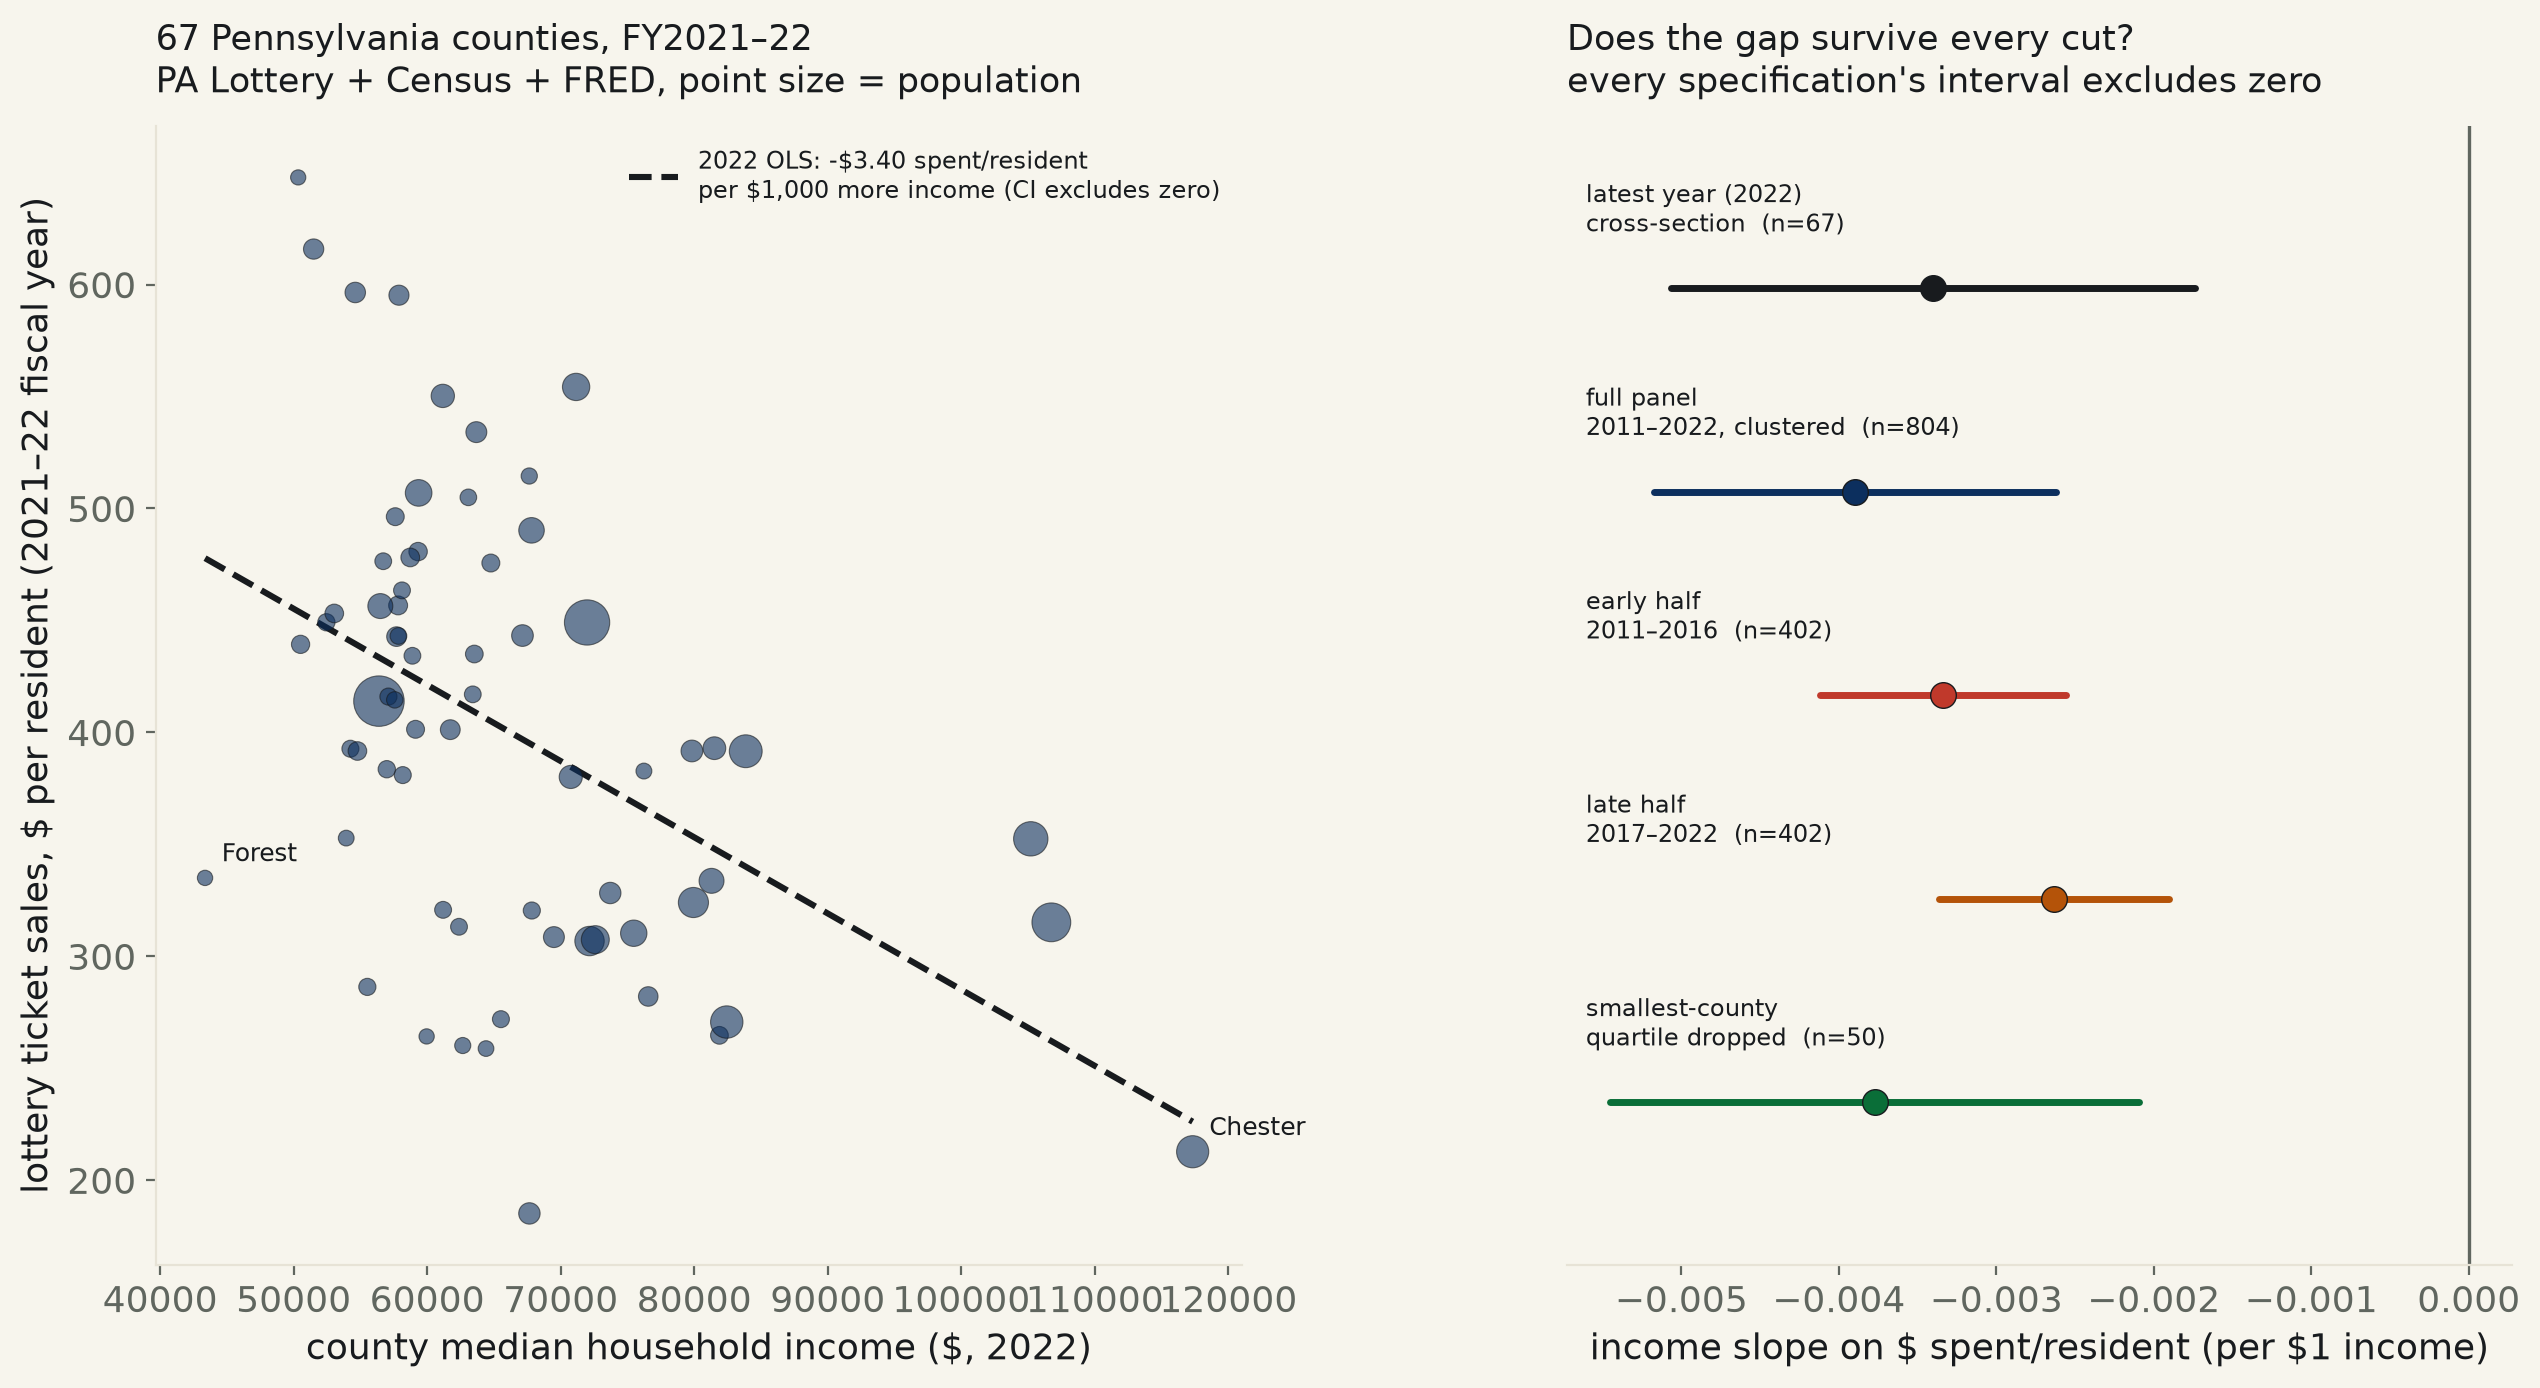
67 Pennsylvania counties, 12 state fiscal years (2010-11–2021-22), PA's own lottery revenue data matched to Census population and FRED's county median household income. 2022 cross-section: every $1,000 more in a county's income tracks with $3.40 less spent on lottery tickets per resident, 95% CI [-5.06, -1.74], p=1.2e-04 — excludes zero. The poorest income fifth of counties spends 0.85% of its own income on tickets; the richest fifth spends 0.39%.
State lotteries are sometimes called a regressive tax with a marketing department — a voluntary purchase, but one economists have long argued falls disproportionately on people who can least afford it (Clotfelter & Cook's 1989 book "Selling Hope" is the canonical academic statement of the claim). This run tests it directly on Pennsylvania's own county-level lottery data: all 67 counties, 12 state fiscal years (2010-11 through 2021-22, 804 county-year rows with no missing matches), each county's ticket sales matched to its own Census population and FRED-published median household income.
The 2022 cross-section says yes, and by a wide margin. Across 67 counties, every additional $1,000 of median household income tracks with $3.40 less spent on lottery tickets per resident, 95% CI [-5.06, -1.74], p=1.2e-04, R²=0.205 — excludes zero comfortably, a log-income version of the identical regression agreeing (p=9.9e-05). Sorted into income fifths, the pattern is a straight staircase: the poorest fifth of counties (mean income $53,133) spends $450 per resident on tickets; the richest fifth (mean income $85,855) spends $325. As a share of income — the number that actually answers "is this a tax on the poor" — the poorest fifth spends 0.85% of its own income on tickets against 0.39% for the richest: more than double.
It is not a one-year fluke. The full 12-year panel (n=804 county-years, year fixed effects, standard errors clustered on county) puts the same slope at $3.90 less per $1,000 income, 95% CI [-5.17, -2.62], p=2.0e-09. Split the panel at its own midpoint: 2011–2016 alone excludes zero ($3.34, p=7.3e-16) and so does 2017–2022 alone ($2.63, p=6.1e-12). The point estimate is smaller in the later half, but a formal interaction test on whether the slope itself changed contains zero (p=0.075) — the desk can say both halves independently clear the bar, not that the effect is confirmed to have weakened.
The obvious confound — tiny counties, tourist and cross-border purchases — doesn't explain it. Pennsylvania's smallest counties (Cameron, population under 5,000; Sullivan; Forest) are the ones most exposed to non-resident lottery purchases inflating a resident-population-based per-capita figure. Dropping the smallest-population quartile of counties, the 2022 slope doesn't shrink — it strengthens, to $3.77 per $1,000 income (CI [-5.45, -2.09], R²=0.298, up from 0.205), and the trimmed panel agrees ($4.27, p=1.1e-09).
Gross ticket sales aren't quite the right number either — roughly 61% of every dollar wagered comes back to players as prizes. Netting out prizes paid in-county, the actual money transferred out of players' pockets and into the state's own revenue runs a smaller but still real gap: $1.15 less net spend per resident per $1,000 income, 95% CI [-1.82, -0.47], p=0.001 — excludes zero, at about a third the size of the gross-sales slope, since gross sales include the prize pool that flows back to (not necessarily the same) players.
Named, concretely: Forest County, the poorest by median income at $43,362, sold $335 of lottery tickets per resident in FY2021-22. Chester County, the richest at $117,326 — nearly three times Forest's income — sold $213 per resident, roughly two-thirds of Forest's figure despite far greater ability to pay.
Read plainly: this desk can confirm the regressive-tax claim, in Pennsylvania, on twelve years of the state's own sales data. Every specification tried — cross-section, panel, either half of the panel alone, population-outlier-trimmed, and net of prizes paid — returns a confidence interval that excludes zero, all in the same direction. That is not the norm for this desk: most claims this direct end in an interval that contains zero. This one does not.
| Specification | n | $ spent/resident per $1,000 income | 95% CI | Verdict |
|---|---|---|---|---|
| 2022 cross-section (linear income) | 67 | -3.402 | [-5.063, -1.741] | excludes zero, p=0.00012 |
| 2022 cross-section (log income) | 67 | -250872.969 | [-371607.754, -130138.184] | excludes zero, p=9.9e-05 |
| 12-year panel, year FE, county-clustered | 804 | -3.897 | [-5.172, -2.623] | excludes zero, p=2e-09 |
| 2011–2016 half alone | 402 | -3.339 | [-4.120, -2.559] | excludes zero, p=7.3e-16 |
| 2017–2022 half alone | 402 | -2.633 | [-3.363, -1.903] | excludes zero, p=6.1e-12 |
| smallest-county quartile dropped, 2022 | 50 | -3.772 | [-5.454, -2.091] | excludes zero, p=4.2e-05 |
| smallest-county quartile dropped, panel | 600 | -4.270 | [-5.641, -2.898] | excludes zero, p=1.1e-09 |
| net spend (sales minus prizes), 2022 | 67 | -1.146 | [-1.825, -0.468] | excludes zero, p=0.0013 |
| Income quintile (poorest→richest) | mean county income | mean lottery $/resident | lottery $ as share of income |
|---|---|---|---|
| 1st (n=14) | $53,133 | $450 | 0.85% |
| 2nd (n=13) | $57,964 | $447 | 0.77% |
| 3rd (n=13) | $61,990 | $404 | 0.65% |
| 4th (n=13) | $68,960 | $385 | 0.56% |
| 5th (n=14) | $85,855 | $325 | 0.39% |
Method. Pennsylvania's own open-data portal (data.pa.gov, Socrata resource hymg-bws9, "Lottery Sales, Prizes, Commissions SFY 2010 - Current Annual County Revenue"), keyless, 804 county-year rows across all 67 counties and 12 state fiscal years, each row carrying its own fips_county_code — no name-matching guesswork. Matched to US Census Bureau county population estimates (direct CSV releases, two vintage files covering 2010–2019 and 2020–2024, not the Census API, which now requires a registered key) and to FRED's own re-publication of Census SAIPE county median household income (one keyless CSV per county, series id pattern MHI<state><FIPS>A052NCEN). Each lottery fiscal year (PA's own July–June state fiscal year, e.g. "2019-2020") is matched to the population and income reading for its ENDING calendar year (2020) — a disclosed approximation, not an exact within-year match. Net spend subtracts each county-year's own prizes_paid from ticket_sales before dividing by population.
Limits, stated plainly. Fiscal-year-to-calendar-year matching is approximate, as noted above — PA's state fiscal year runs July to June, so the ending-year income/population reading slightly overlaps the following calendar year. "Tickets per capita" is actually dollars of ticket sales per resident, not a literal ticket count, and treats every dollar of sales the same regardless of whether it came from a $1 draw ticket or a $30 scratch-off — if richer and poorer counties buy different mixes of games at different average prices, that could bias the per-capita comparison in either direction, and this run has no game-level breakdown to check it. Net spend assumes prizes paid out in a county are won by that county's own residents, which is not strictly true for large multi-state jackpots. This is Pennsylvania only, a single state with its own game mix, tax rate, and retailer density — not a national test, though PA's finding matches the direction of the wider Clotfelter & Cook literature.
pa_lottery_income_544.csv (full 804-row panel) · fit output (JSON).
