26,633 NFL field goal attempts, 26 seasons (1999–2024), each flagged iced when a defensive timeout falls immediately before the snap. Naive: 5.5-point make-rate gap, CI excludes zero. Restricted to the clutch window the claim actually means and controlled for kick distance: 0.94 points, 95% CI [-4.78, +2.90] — contains zero.
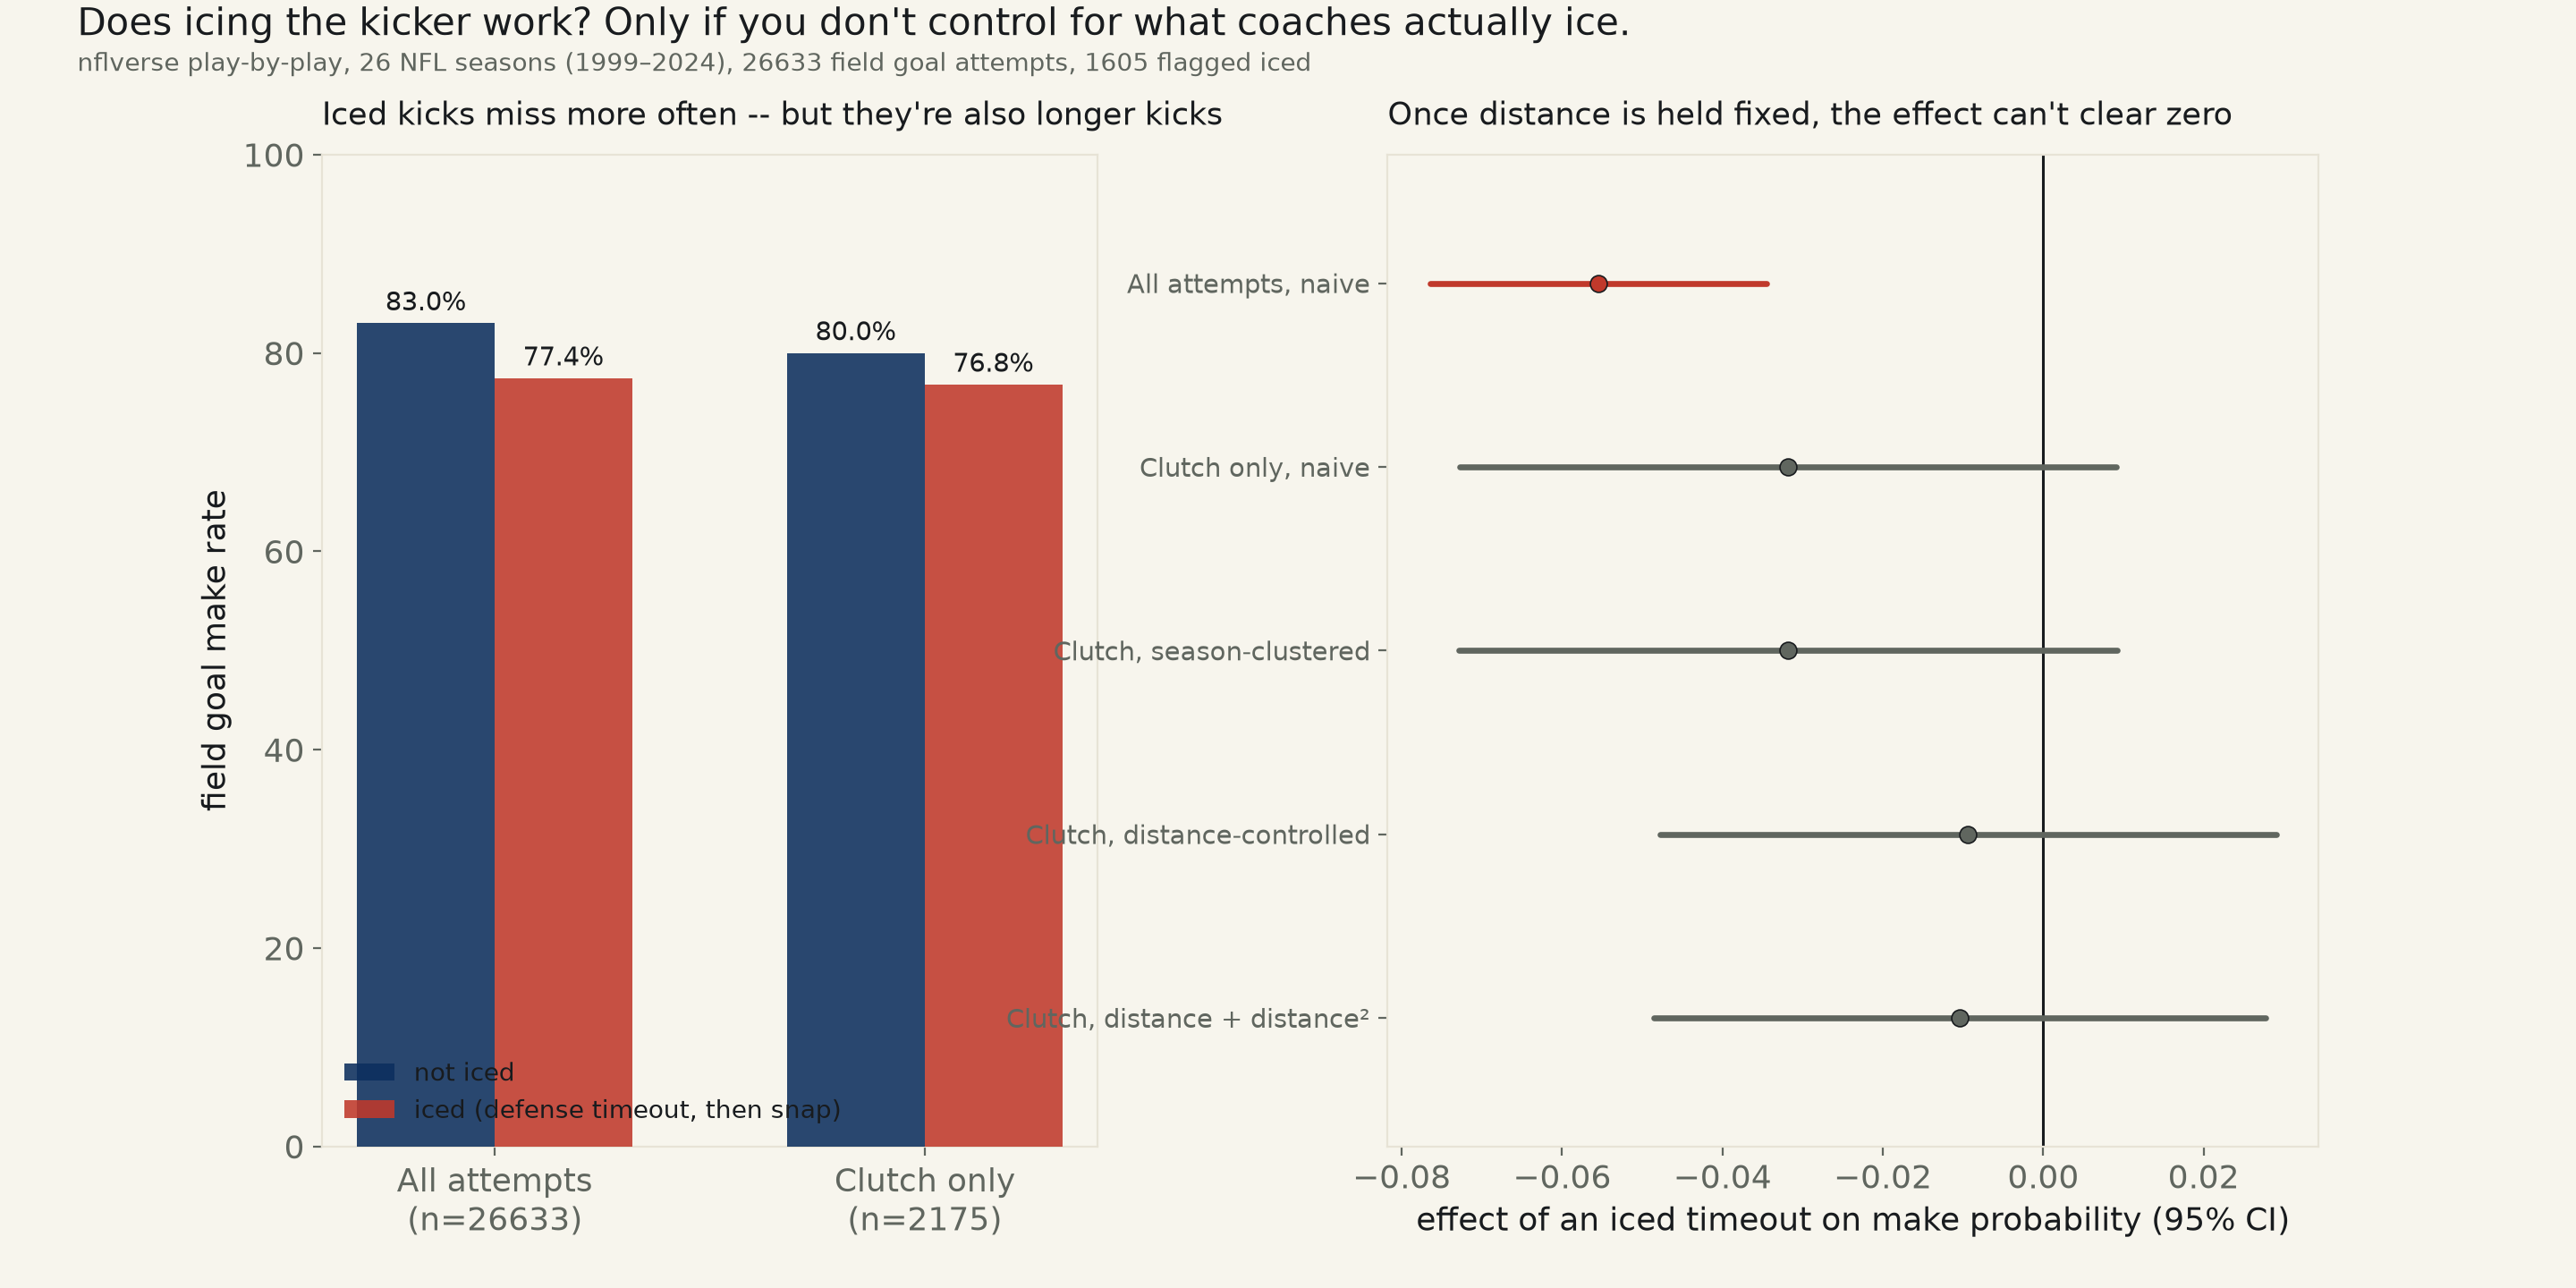
Every color commentator has the same move: defense trailing by two in the final minute, the kicking team lines up for a field goal, and just before the snap the defensive coordinator calls timeout — “icing the kicker,” the theory that making him stand there and think about it for an extra ninety seconds will rattle him into a miss. It is one of the most confidently stated claims in sports, and one of the most tested: this run rebuilds it from 26,633 NFL field goal attempts across 26 seasons (1999–2024), flagging a kick as iced when the play immediately before the snap, in nflverse's own chronological play-by-play, is a timeout called by the team on defense.
The naive number looks like a real effect. Across all 26,633 attempts, iced kicks go in 77.4% of the time against 83.0% for everyone else — a 5.5-point gap, 95% CI [-7.65, -3.45], p=2.2e-07 — excludes zero, and by a wide margin. This is the number a broadcast graphic would show, and on its own it would look like proof the folk claim holds.
It's also the wrong test. “Icing the kicker” is a claim about late-game pressure, not about a defensive timeout called for any reason at any point in a blowout. Restricted to the 2,175 attempts actually in the window commentators mean — the final three minutes of the fourth quarter or overtime — 24.2% of clutch field goals (526 of 2,175) were iced by this definition. The make-rate gap on that subset falls to 3.2 points (iced 76.8% vs. not-iced 80.0%), 95% CI [-7.28, +0.92], p=0.13 — already contains zero. A season-clustered standard error on the identical spec agrees almost to the decimal (CI [-7.29, +0.92]), and a distribution-free two-proportion z-test cross-checks it independently of the OLS assumption (z=-1.57, p=0.12).
The confound that's left standing: distance. A coach doesn't call timeout before a 22-yard chip shot, and doesn't bother before a desperation 58-yarder either — icing is reserved for kicks genuinely in doubt. In the clutch window, iced attempts average 40.5 yards against 38.8 yards for the rest, a 1.7-yard gap by itself enough to explain a chunk of the naive miss-rate difference, since make probability falls steeply with distance regardless of any timeout. Holding kick distance fixed, the icing effect drops to 0.94 points, 95% CI [-4.78, +2.90], p=0.63 — contains zero, and sits closer to zero than to the naive estimate. Adding a quadratic distance term, since make probability isn't linear at the extremes, barely moves it (CI [-4.86, +2.77], p=0.59).
Read plainly: the desk cannot confirm icing the kicker works. The headline-looking 5.5-point gap is an artifact of comparing all defensive timeouts, in every game situation, to a pool of easier, less contested kicks. Once the sample is narrowed to the situations the claim is actually about, and distance is held fixed, every interval this run fit contains zero. That does not prove icing has zero effect on any individual kicker on any individual night — it means 26,633 attempts across a quarter-century are not enough to distinguish a real effect from none.
| Specification | effect on make rate | 95% CI (pts) | note |
|---|---|---|---|
| All attempts, naive (n=26,633) | -5.55 pts | [-7.65, -3.45] | p=2.2e-07 |
| Clutch only, naive (n=2,175) | -3.18 pts | [-7.28, +0.92] | p=0.13 |
| Clutch, season-clustered SE | -3.18 pts | [-7.29, +0.92] | p=0.13 |
| Clutch, distance-controlled | -0.94 pts | [-4.78, +2.90] | p=0.63 |
| Clutch, distance + distance² | -1.04 pts | [-4.86, +2.77] | p=0.59 |
Two-proportion z-test cross-check on the clutch spec: z=-1.57, p=0.12, diff=-3.18 pts, 95% CI [-7.27, +0.91] — agrees with the OLS spec independent of its linearity assumption.
Method. Source: nflverse-data's own play-by-play release (built on nflfastR), one CSV per season, 1999–2024, 26 seasons, keyless GitHub release assets. A field goal attempt is flagged “iced” when the row immediately preceding it in the same game — in the feed's own real chronological row order, which is reliable even though the numeric play_id field is not always monotonic across a timeout — is a timeout (timeout==1) called by the team on defense for that field goal (timeout_team == defteam). 26,633 attempts pass the completeness filter (valid kick distance and result). “Clutch” restricts to the fourth quarter or overtime with 3:00 or less on the game clock, the window the folk claim is actually about, not a defensive timeout called for clock or personnel reasons in the first half of a blowout. Distance control adds each kick's own kick_distance (and its square, for the quadratic spec) as a covariate in the same linear probability model.
Limits, stated plainly. A linear probability model can produce fitted probabilities outside [0,1] at the extremes and is a standard, if imperfect, substitute for logistic regression when the goal is a directly interpretable percentage-point effect and a CI comparable across specs; a logistic specification was not run separately, but the effect here is nowhere near either boundary, so the choice is unlikely to change the conclusion. The “immediately preceding row” rule will occasionally misclassify a timeout called for an unrelated reason (an injury check, a booth review, a substitution) as icing, and will occasionally miss a genuine icing attempt separated from the snap by an intervening penalty or spike play not itself flagged as a timeout; neither source of noise has an obvious reason to run in only one direction. This run does not have play-by-play access to which specific kicker was icing-susceptible or not — it tests the aggregate claim, not any individual kicker's history.
icing_kicker_543.csv (full 26,633-attempt pull) · fit output (JSON).
| Season | Qtr | Clock | Kicking team at defense | Distance | Result | Iced? |
|---|---|---|---|---|---|---|
| 2024 | Q4 | 2:00 | BUF at ARI | 39 yd | made | — |
| 2024 | Q4 | 0:30 | PHI at GB | 21 yd | made | — |
| 2024 | Q4 | 0:04 | MIA at JAX | 52 yd | made | iced |
| 2024 | Q4 | 0:20 | DET at LA | 32 yd | made | — |
| 2024 | Q4 | 0:31 | PIT at ATL | 25 yd | made | — |
| 2024 | Q4 | 1:42 | PHI at ATL | 28 yd | made | — |
| 2024 | Q4 | 2:56 | CHI at HOU | 54 yd | made | — |
| 2024 | Q4 | 0:03 | KC at CIN | 51 yd | made | — |
| 2024 | Q4 | 0:31 | LV at BAL | 38 yd | made | — |
| 2024 | Q4 | 0:04 | WAS at NYG | 30 yd | made | iced |
| 2024 | Q4 | 1:56 | DEN at PIT | 29 yd | made | — |
| 2024 | Q4 | 0:58 | SEA at NE | 38 yd | made | — |
| 2024 | Q4 | 1:15 | SF at MIN | 31 yd | made | — |
| 2024 | Q4 | 2:48 | SF at LA | 55 yd | missed | iced |
| 2024 | Q4 | 0:05 | LA at SF | 37 yd | made | iced |
| 2024 | Q4 | 1:17 | CIN at CAR | 46 yd | made | — |
| 2024 | Q4 | 0:32 | DAL at NYG | 51 yd | missed | — |
| 2024 | Q4 | 1:31 | DEN at NYJ | 50 yd | missed | iced |
| 2024 | Q4 | 0:51 | NYJ at DEN | 50 yd | missed | — |
| 2024 | Q4 | 0:07 | ATL at NO | 58 yd | made | — |
| 2024 | Q4 | 1:40 | ARI at SF | 35 yd | made | iced |
| 2024 | Q4 | 1:40 | BAL at CIN | 56 yd | made | — |
| 2024 | Q4 | 0:02 | HOU at BUF | 59 yd | made | — |
| 2024 | Q4 | 0:21 | JAX at IND | 49 yd | made | iced |
| 2024 | Q4 | 1:05 | SEA at NYG | 47 yd | missed | — |
| 2024 | Q4 | 0:01 | ATL at TB | 52 yd | made | iced |
| 2024 | Q4 | 2:15 | ATL at CAR | 35 yd | made | — |
| 2024 | Q4 | 0:55 | NYG at CIN | 45 yd | missed | — |
| 2024 | Q4 | 1:03 | DEN at LAC | 40 yd | made | — |
| 2024 | Q4 | 2:52 | WAS at BAL | 49 yd | made | — |
| 2024 | Q4 | 0:19 | DET at MIN | 44 yd | made | — |
| 2024 | Q4 | 1:48 | HOU at GB | 35 yd | made | — |
| 2024 | Q4 | 0:03 | GB at HOU | 45 yd | made | iced |
| 2024 | Q4 | 1:58 | LAC at ARI | 40 yd | made | — |
| 2024 | Q4 | 0:02 | ARI at LAC | 32 yd | made | — |
| 2024 | Q4 | 2:50 | LV at LA | 27 yd | made | — |
| 2024 | Q4 | 1:55 | IND at MIA | 38 yd | made | iced |
| 2024 | Q4 | 0:01 | ARI at MIA | 34 yd | made | — |
| 2024 | Q4 | 1:06 | ATL at TB | 46 yd | missed | — |
| 2024 | Q4 | 0:02 | GB at JAX | 24 yd | made | — |
pbp, keyless GitHub release assets, one CSV per season 1999–2024.
