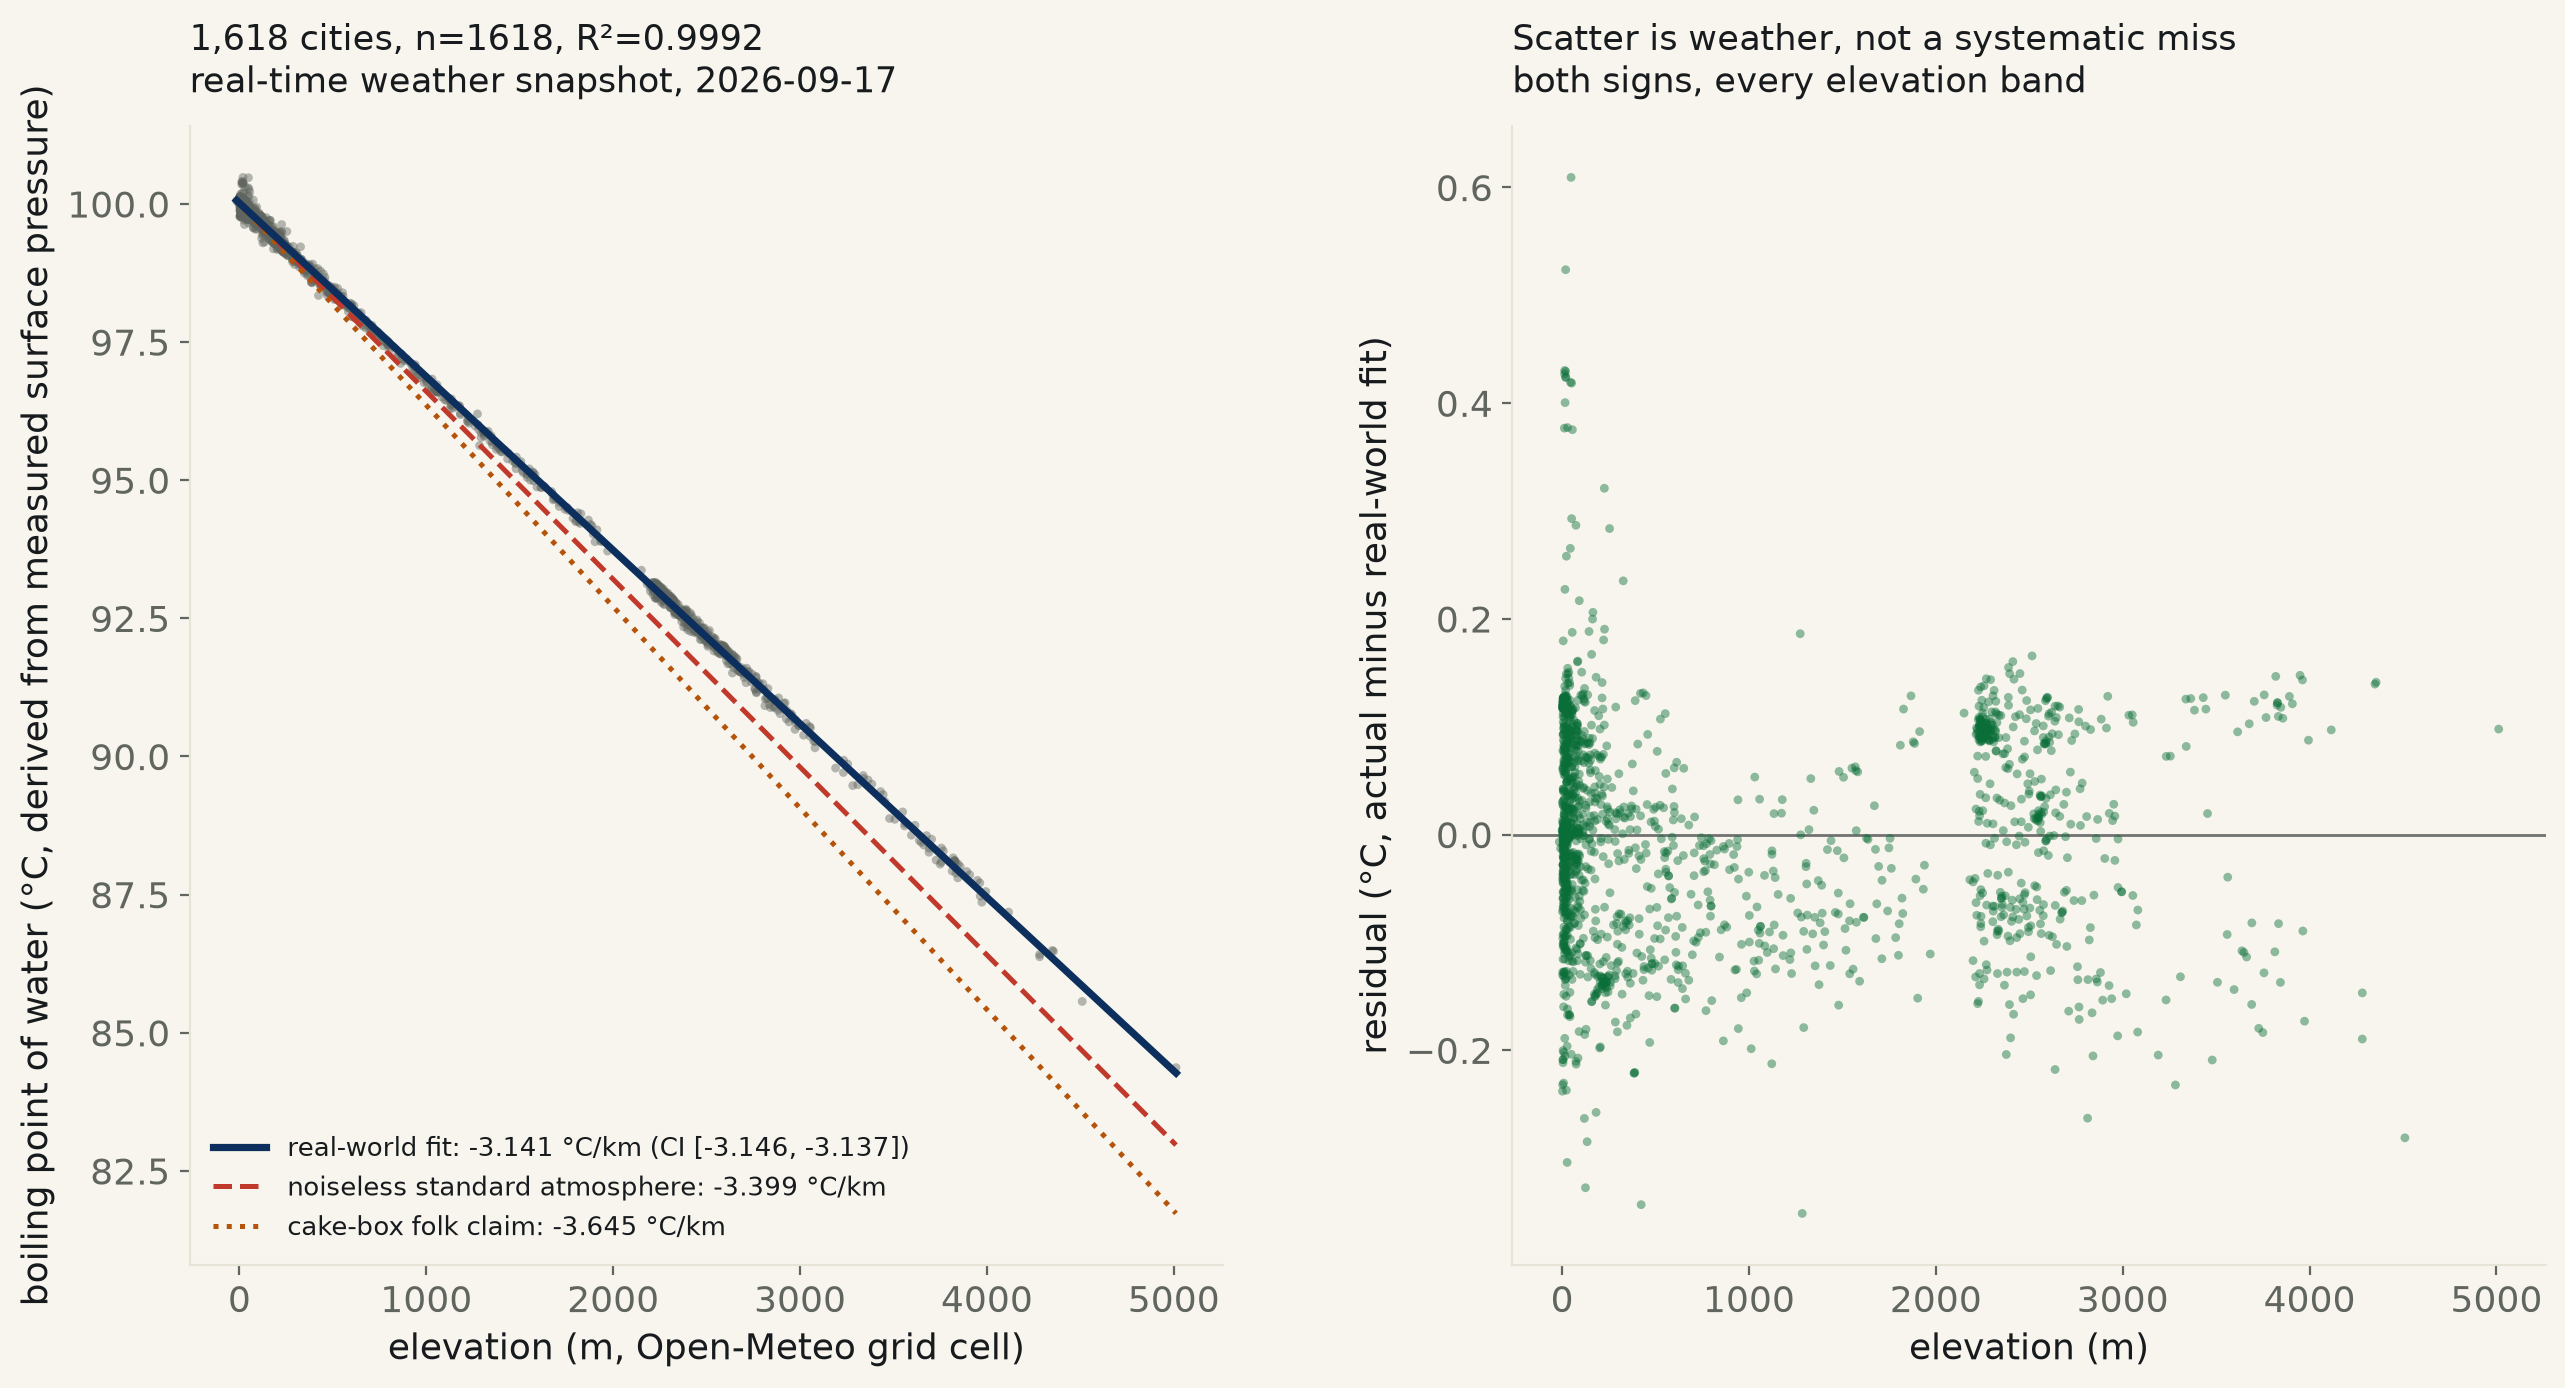
1,618 world cities, each matched to its own real-time atmospheric pressure and converted to a boiling point via Clausius-Clapeyron. Real-world fit: -3.14°C/km (95% CI [-3.15, -3.14], R²=0.9992) — measurably shallower than both a noiseless standard-atmosphere prediction (-3.40°C/km) and the cake-box folk claim (-3.65°C/km).
Every camper's guide and every cake-mix box carries a version of the same instruction: water boils at a lower temperature the higher you go, adjust your recipe or your altitude sickness expectations accordingly. It is real physics — lower atmospheric pressure means water molecules need less thermal energy to escape into vapor — but the specific numbers in circulation (recipe boxes commonly print “1°F per 500 feet”) are folklore-grade, not measured. This run checks the claim against 1,618 world cities, real atmospheric pressure measured at each one right now, not a textbook table.
Method, briefly. 1,618 cities pass a GeoNames population/elevation filter (population > 500,000 OR real elevation > 2,200 m, to keep the thin high-altitude tail from being crowded out by low-elevation megacities). Each city's real-time surface pressure — not sea-level-reduced pressure, which would erase the very signal being tested — comes from Open-Meteo's keyless weather API, queried at the same moment for all 1,618 locations. Surface pressure converts to a boiling point via the Clausius-Clapeyron relation, the same 19th-century thermodynamic law the backlog item names, using water's standard molar enthalpy of vaporization (40,660 J/mol) — a physical constant, not a fitted parameter.
The claim holds, almost exactly as strongly as its own physics predicts. Boiling point falls -3.141°C per kilometer of elevation, 95% CI [-3.146, -3.137], R²=0.9992 across a sample running from -15 m below sea level to 5,012 m. Altitude alone explains 99.9% of the spread in boiling point across a single day's worldwide weather — the elevation effect (a 16.1°C range top to bottom) dwarfs ordinary synoptic weather noise (a few tenths of a degree).
But the real world runs measurably shallower than the idealized version of the same question. Feed the identical 1,618 elevations through a noiseless International Standard Atmosphere model — no weather, no day-to-day variation, just the textbook pressure-altitude formula — and the implied slope is -3.399°C/km, outside the real-world confidence interval entirely. The cake-box folk number (1°F per 500 ft) implies -3.645°C/km, also outside it — folklore overstates the effect by about 16% against what today's cities actually measured. One plausible reason for the gap: the standard atmosphere model assumes a fixed, cool sea-level-anchored temperature profile, and many of this sample's high-elevation cities sit in the tropics or subtropics (the Andes, the Tibetan Plateau, East Africa), where the real air column runs warmer than that assumption — a warmer column has a taller scale height, which keeps pressure (and boiling point) at any given altitude a bit higher than the idealized formula expects. This run cannot fully isolate that mechanism from one day's snapshot; it is offered as the likely explanation, not a proven one.
The line isn't perfectly straight, and 1,618 points is enough to prove it. A quadratic term added to the real-data fit is small but real: b²=9.49e-09, 95% CI [4.60e-09, 1.44e-08] — excludes zero, p=1.5e-04. Stacking two nonlinear laws (the barometric pressure formula and Clausius-Clapeyron) does produce real curvature, exactly as the physics predicts — it is just small enough that a straight line is a fine approximation for any kitchen: the curvature's total contribution at the sample's highest point, 5,012 m, is only 0.24°C.
Concrete, no regression needed: La Rinconada, PE — commonly cited as the highest permanently inhabited settlement on Earth, roughly 5,100 m up in the Peruvian Andes — sits at the top of this sample's elevation range (5,012 m) and boils water at 84.4°C right now, nearly 16 degrees short of the sea-level reference. At the other end, Baku, AZ, sits 15 m below sea level and boils at essentially the textbook 100.05°C. The single biggest miss from the real-world fit's own line, in either direction, is under 0.61°C — today's weather, not a broken law.
| Specification | slope (°C/km) | 95% CI | note |
|---|---|---|---|
| Real-world fit, measured pressure (n=1,618) | -3.141 | [-3.146, -3.137] | R²=0.9992 |
| Noiseless standard atmosphere, same 1,618 elevations | -3.399 | [-3.400, -3.399] | R²=0.999995 |
| Cake-box folk claim (1°F / 500 ft, fixed, not fit) | -3.645 | — | outside the real-world CI |
Quadratic term on the real data: b²=9.488e-09, 95% CI [4.600e-09, 1.438e-08], p=1.5e-04 — excludes zero, contributes 0.24°C at the sample's highest elevation.
Method. City list and elevation-adjacent filter: GeoNames' own cities15000 dump (every populated place with population ≥ 15,000, refreshed daily, no key), kept where population > 500,000 or the place's SRTM-derived elevation exceeds 2,200 m — the second arm keeps small, real high-altitude towns (Oruro, Juliaca, Sucre) from being crowded out by the population filter alone, since none of them individually clears 500,000 residents. 1,618 cities pass. Pressure: Open-Meteo's /v1/forecast endpoint, field surface_pressure (station-level, not sea-level-reduced), queried for all cities within the same few minutes, batched at 200 locations per request. The X variable is Open-Meteo's OWN elevation for each grid cell (returned alongside its pressure reading), not GeoNames' separately-sourced elevation, so the elevation and the pressure measured “at” it come from the same underlying model grid rather than two DEM rasters that could disagree by tens of meters on steep terrain. Boiling point is not measured directly; it is derived from each city's real measured pressure via Clausius-Clapeyron, using water's standard molar enthalpy of vaporization (40,660 J/mol) held constant, the standard textbook simplification for this pressure range.
Limits, stated plainly. This is one instant in time, not a controlled repeated measurement — the residual chart shows visible regional banding (clusters of Andean and East African cities sharing similar day-of-pull pressure anomalies) rather than pure independent noise, because weather systems are regional, not city-by-city independent; this makes the reported confidence interval somewhat optimistic; a multi-day average was not attempted in a one-day pull. The population filter favors national capitals and major metros, which are not a random sample of all elevations — corrected for partially by the explicit high-elevation-town carve-out, but not a perfectly uniform elevation grid. Clausius-Clapeyron's constant-L approximation is itself a simplification; the true enthalpy of vaporization declines somewhat as temperature falls, which is one candidate contributor (alongside the standard-atmosphere temperature-profile mismatch discussed above) to the small but real quadratic term detected here.
boiling_point_elevation.csv (full 1,618-city pull) · fit output (JSON).
| City | Country | elevation (m) | surface pressure (hPa) | boiling point (°C) |
|---|---|---|---|---|
| Zapopan | MX | 1569 | 852.6 | 95.15 |
| Chignahuapan | MX | 2287 | 786.9 | 92.94 |
| Jilin | CN | 203 | 992.9 | 99.42 |
| Amecameca | MX | 2474 | 769.6 | 92.33 |
| Benguela | AO | 7 | 1012.8 | 99.99 |
| Ciudad Satelite | PE | 2327 | 781.2 | 92.74 |
| Bhiwandi | IN | 12 | 1011.0 | 99.94 |
| Xingtai | CN | 69 | 1006.2 | 99.80 |
| Chandigarh | IN | 350 | 970.9 | 98.79 |
| Campo Grande | BR | 590 | 951.0 | 98.20 |
| Lahore | PK | 219 | 984.9 | 99.19 |
| Surat | IN | 21 | 1008.3 | 99.86 |
| Nay Pyi Taw | MM | 120 | 997.8 | 99.56 |
| Barnaul | RU | 201 | 984.6 | 99.19 |
| Tulcán | EC | 2958 | 724.8 | 90.70 |
| Dongsheng | CN | 1435 | 859.9 | 95.39 |
| Xalatlaco | MX | 2764 | 745.1 | 91.45 |
| Chongqing | CN | 282 | 982.8 | 99.13 |
| Marseille | FR | 30 | 1014.8 | 100.04 |
| Yichun | CN | 93 | 1004.5 | 99.75 |
| Venustiano Carranza | MX | 2230 | 791.5 | 93.10 |
| Qui Nhon | VN | 9 | 1012.0 | 99.96 |
| San Pablo Autopan | MX | 2609 | 757.7 | 91.90 |
| Thāne | IN | 24 | 1009.7 | 99.90 |
| Zanzibar | TZ | 12 | 1016.0 | 100.08 |
| Xining | CN | 2274 | 781.4 | 92.75 |
| Alborada Jaltenco | MX | 2240 | 790.7 | 93.07 |
| Joinville | BR | 9 | 1015.1 | 100.05 |
| Hachiōji | JP | 128 | 999.2 | 99.60 |
| Luzhou | CN | 256 | 986.2 | 99.23 |
| Heshan | CN | 66 | 1008.3 | 99.86 |
| Atuntaqui | EC | 2402 | 774.3 | 92.50 |
| Yarumal | CO | 2278 | 783.6 | 92.82 |
| Oruro | BO | 3704 | 668.0 | 88.50 |
| Zhabei | CN | 9 | 1016.9 | 100.10 |
| Leipzig | DE | 109 | 1002.3 | 99.69 |
| Dhamār | YE | 2422 | 772.1 | 92.42 |
| Ol Kalou | KE | 2349 | 776.1 | 92.56 |
| Herāt | AF | 925 | 910.6 | 96.98 |
| Ranchi | IN | 643 | 941.1 | 97.91 |
cities15000 dump, keyless · Open-Meteo real-time forecast API, field surface_pressure, keyless · Clausius-Clapeyron relation for water, standard molar enthalpy of vaporization 40,660 J/mol · comparison model: International Standard Atmosphere, troposphere layer (0–11 km).
