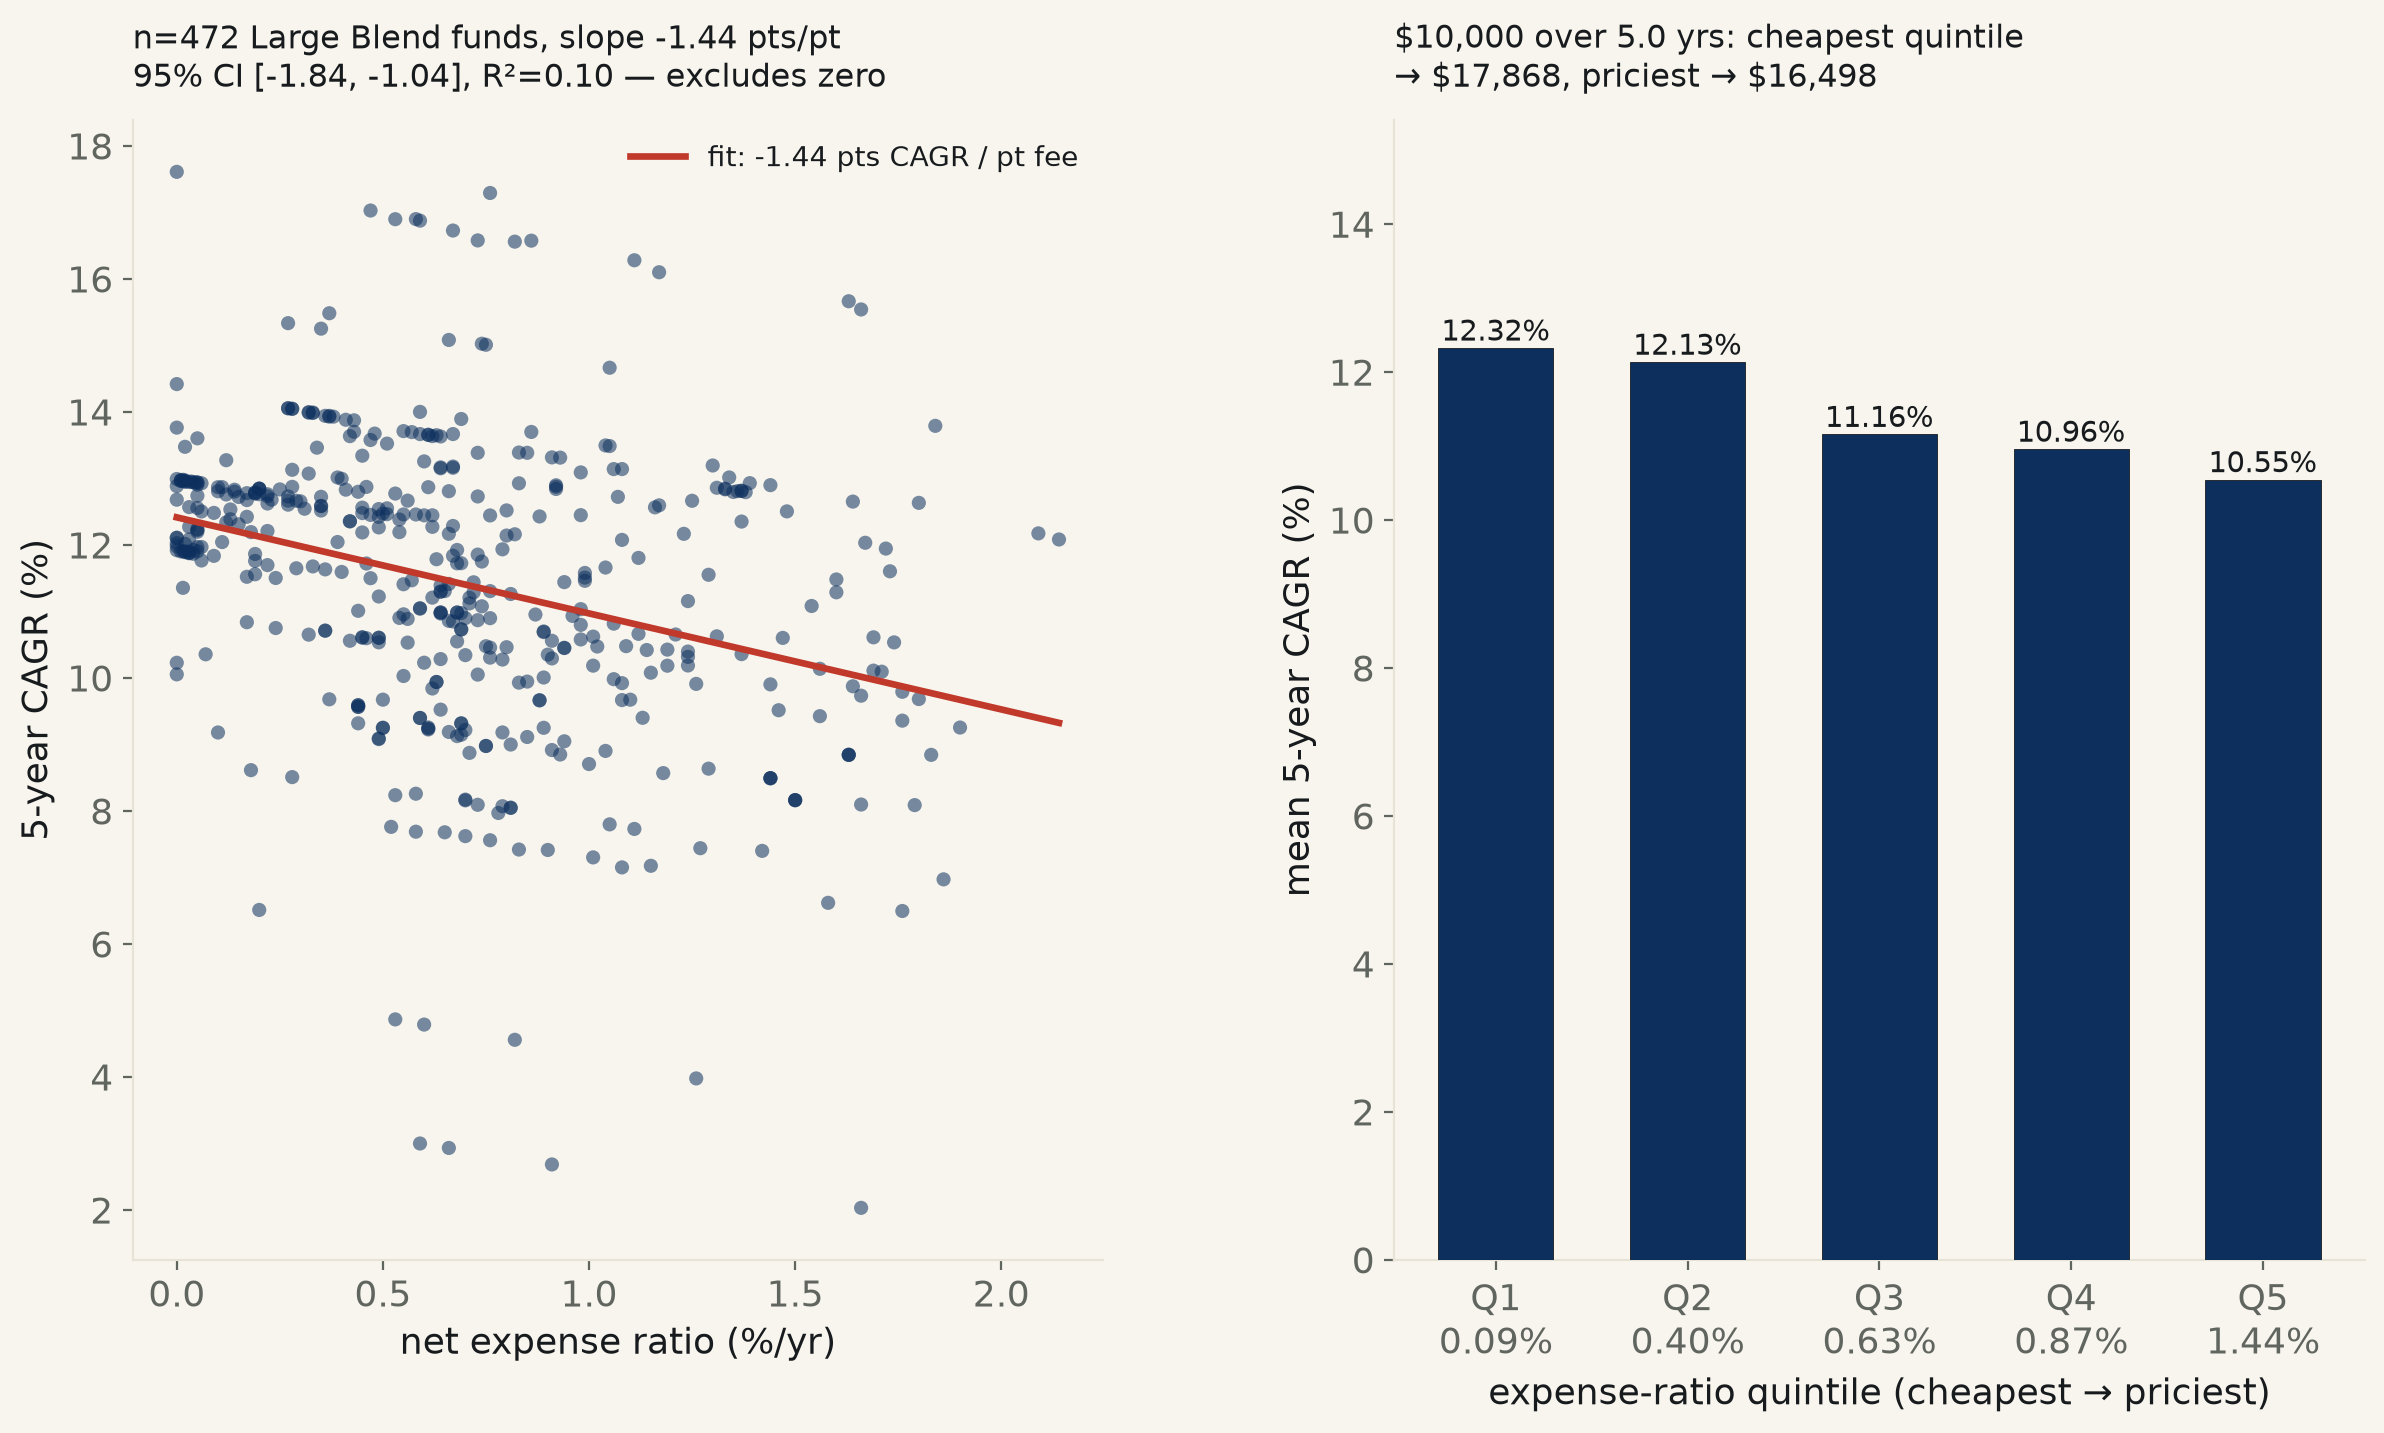
472 US "Large Blend" mutual funds -- same category, same broad market exposure -- matched on their own net expense ratio and their own 5-year total return, computed from each fund's dividend-adjusted daily NAV. Every extra point of annual fee tracks with -1.44 points less annual return (95% CI [-1.84, -1.04], p=4.9e-12) -- and it survives controlling for the obvious confound, fund size, at -1.07 points (p=4.3e-07).
"Expensive funds underperform" is one of the oldest, best-supported claims in personal finance -- Kenneth French's 2008 Presidential Address to the American Finance Association, "The Cost of Active Investing," argued that fees are close to a mechanical drag on what an investor keeps, since a dollar paid to a manager is a dollar that cannot compound. The cleanest test holds the asset class fixed, so the comparison is fees within the same market exposure rather than fees confounded with what a fund actually invests in. This run restricts to Morningstar's own "Large Blend" category -- funds mandated to track something close to the broad US large-cap market -- pulled from Yahoo Finance's own fund screener without any performance-rating filter (Yahoo's predefined "top funds" screens pre-select on 4-5 star ratings, which would select on the very outcome this run tests), and computes each fund's own 5-year CAGR directly from its dividend-adjusted daily NAV history rather than trusting a summary field.
The naive relationship is real and not small. Across 472 Large Blend funds, regressing 5-year CAGR on net expense ratio: every additional percentage point of annual fee tracks with -1.44 points less annual return, 95% CI [-1.84, -1.04], p=4.9e-12 -- excludes zero, agreeing under an HC3 heteroskedasticity-robust check (p=3.5e-13) and a distribution-free Spearman rank test (ρ=-0.36, p=3.4e-16). R²=0.097 -- fees explain roughly a tenth of the spread in returns, real but far from the whole story.
The obvious confound is fund size, and it only partly explains the gap. Bigger funds do have lower fees (-0.26 points of expense ratio per 10× in assets, CI excludes zero, p=2.3e-13) and, separately, bigger funds return more (+0.90 points of CAGR per 10× in assets once expense ratio is held fixed, p=1.2e-07) -- a textbook setup for scale to be doing the work fee alone gets credit for. Add log(net assets) to the regression and the fee penalty survives: -1.07 points, 95% CI [-1.49, -0.66], p=4.3e-07 -- still excludes zero, at 74% of the naive slope. Unlike run 532's inequality/income result, size attenuates this effect only modestly; it does not explain it away.
No regression needed: sorted into fifths by expense ratio, mean 5-year CAGR falls in a straight line from the cheapest group to the priciest -- 12.32% down to 10.55%, every step in between ordered the same direction. $10,000 held for the sample's median 5.0-year window at the cheapest quintile's average return grows to $17,868; the identical $10,000 at the priciest quintile's average return reaches $16,498 -- a $1,369 gap from fees alone, on funds competing for the same market.
Named, and a caveat the R² already warns about: Fidelity's zero-fee index funds -- FNILX (Fidelity ZERO Large Cap Index) and FZROX (Fidelity ZERO Total Market Index), both 0.00% -- returned 12.68% and 12.10% respectively, both above the sample mean. But the single cheapest fund in the whole sample by fee, AFEGX (American Century Large Cap Equity G, 0.00%), returned only 10.05% -- below average -- while the single priciest, JLPCX (JPMorgan US Large Cap Core Plus C, 2.14%), returned a perfectly respectable 12.08%. R²=0.097 means fees are a real average tax, not a guarantee about any one fund: the 13 zero-fee funds in this sample average 12.67% against 11.39% for everyone else, but individual results inside that group still range widely.
Pearson r=-0.311, Spearman ρ=-0.364 (naive spec, n=472).
| Spec | n (funds) | pts CAGR / pt fee | 95% CI | R² | Verdict |
|---|---|---|---|---|---|
| Naive, all funds | 472 | -1.44 | [-1.84, -1.04] | 0.097 | excludes zero, p=4.9e-12 |
| Controlling for fund size (log net assets) | 472 | -1.07 | [-1.49, -0.66] | 0.149 | excludes zero, p=4.3e-07 |
| Outlier-trimmed (drop top/bottom 5% by CAGR) | 424 | -1.20 | [-1.49, -0.91] | 0.134 | excludes zero, p=7.5e-15 |
| Quintile | n | Mean expense ratio | Mean 5yr CAGR | Median 5yr CAGR |
|---|---|---|---|---|
| Q1 | 95 | 0.09% | +12.32% | +12.53% |
| Q2 | 94 | 0.40% | +12.13% | +12.54% |
| Q3 | 94 | 0.63% | +11.16% | +11.08% |
| Q4 | 94 | 0.87% | +10.96% | +10.81% |
| Q5 | 95 | 1.44% | +10.55% | +10.42% |
Method. Yahoo Finance's fund screener (yfinance FundQuery, keyless), category="Large Blend", exchange="NAS", 500 funds pulled across two 250-row pages sorted by net assets descending, deliberately built without Yahoo's own performance-rating filter (which would select on the outcome tested here). Net expense ratio and net assets are the screener's own fields. Five-year CAGR is computed from each fund's own daily dividend-adjusted close (yfinance, auto_adjust=True) between the first and last valid trading day in a 5-year window, not from a Yahoo summary return field. 472 of 500 pulled funds had both a published expense ratio and at least 1,150 of ~1,255 possible trading days of history; the rest are excluded and counted, not silently dropped (see fetch_expenseratio_540.py).
Limits, stated plainly. R²=0.097 means expense ratio is one real input among many to a fund's return, not close to the whole story -- active managers with genuine skill, sector tilts within the "Large Blend" label, and plain noise over a 5-year window all move individual funds far more than their fee does, as the cheapest- and priciest-single-fund comparison above shows directly. Five years is one specific market window (2021-2026, including 2022's drawdown and the subsequent recovery); a different 5-year window could shift the level of every fund's CAGR even if the fee relationship held. This run tests Large Blend funds only -- the category chosen specifically to hold market exposure fixed -- and says nothing about whether the same fee penalty holds in categories with more return dispersion to explain.
fund_expense_returns_540.csv (symbol, long_name, net_expense_ratio_pct, net_assets_usd, start_date, end_date, n_trading_days, years_elapsed, cagr_pct) · fit output (JSON).
