3,854 House district-races with exactly one incumbent on the general-election ballot, 2004–2022, FEC's own compiled results. Winning margins fall -0.359 points/year (95% CI excludes zero, clustered by seat) — but aggregated to 10 cycle-level points instead of 3,854 races, the identical decline can't clear this desk's bar (CI contains zero). The win rate itself hasn't moved at all (CI contains zero): incumbents are winning by less, not losing more.
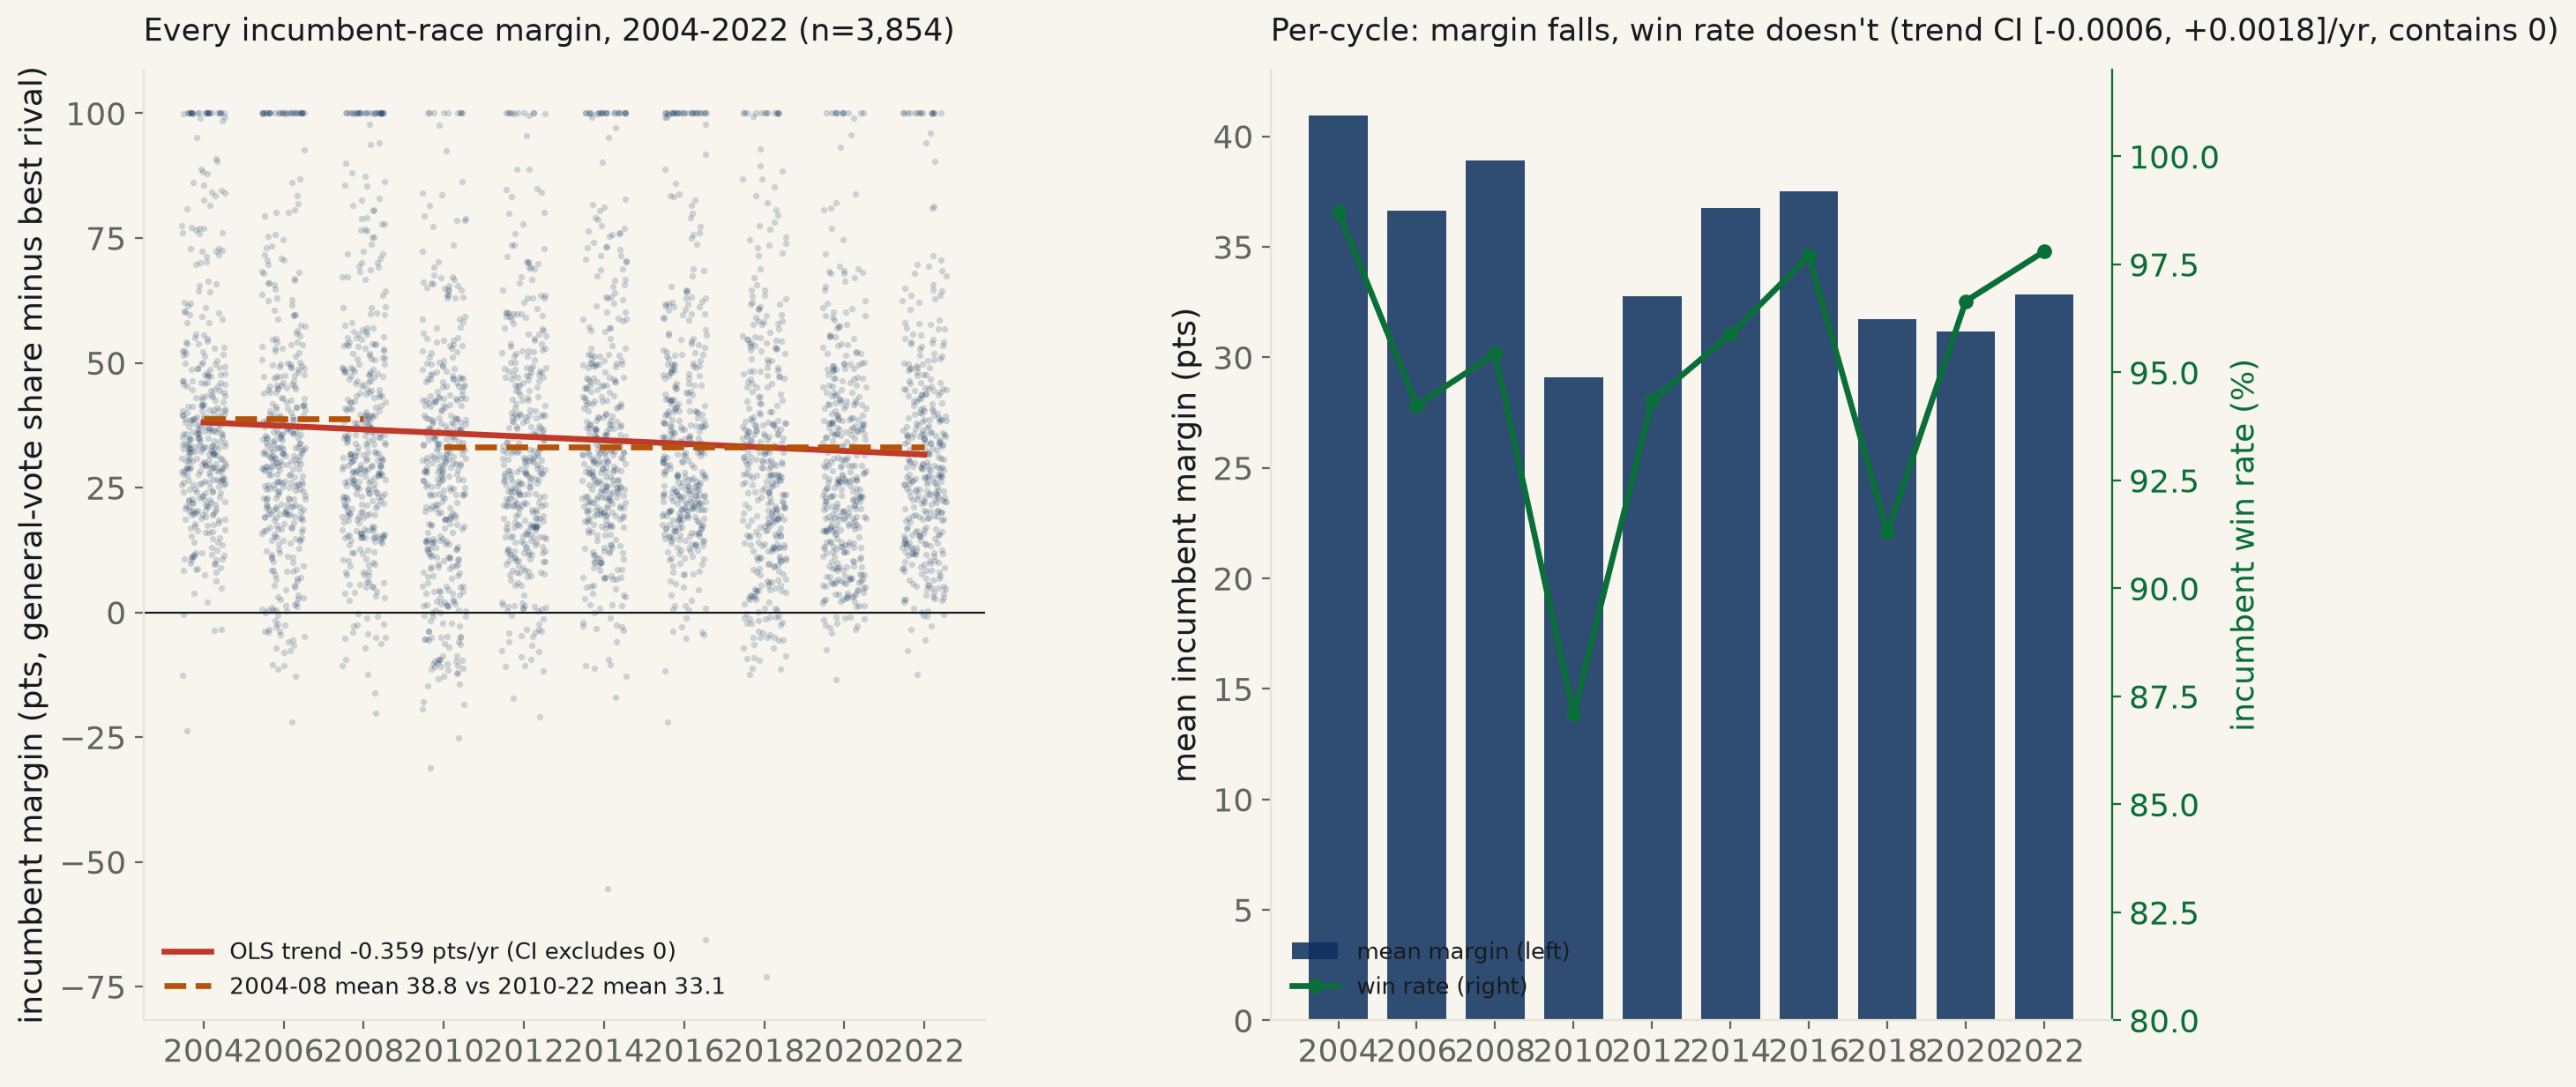
"The incumbency advantage is eroding" has become as common a claim as the advantage itself once was — nationalized politics, straight-ticket voting and a shrinking pool of split-ticket districts are all cited as reasons a sitting House member's personal brand should count for less than it used to. This run tests it directly on the FEC's own compiled election results: every general-election House race, 2004–2022, in which exactly one FEC-flagged incumbent appeared on the ballot (3,854 district-races across 10 cycles). margin is that incumbent's share of the general vote minus the best of every other candidate on the same ballot — a real number even for a literal walkover (an unopposed incumbent's margin is whatever's left after write-ins, not fabricated as 100 flat).
The race-level trend is real and survives the obvious objections. Regressing margin on year, clustering standard errors by seat (state, district) since the same district recurs across cycles and plain OLS would otherwise overstate the precision: -0.359 points/year, 95% CI [-0.510, -0.208] — excludes zero, p=3.3e-06. Dropping the 177 literal walkovers (best_other_pct ≤ 1%, margin near 100 by construction) to check that a shifting unopposed share isn't driving the result: -0.277 points/year, CI [-0.408, -0.146] — still excludes zero, p=3.3e-05. The effect isn't an artifact of who ran unopposed.
The same claim, aggregated down to 10 cycle-level points, can no longer clear this desk's bar — and that is the invariant this desk exists to say out loud. Averaging margin within each cycle first and regressing those 10 means on year returns -0.358 points/year, 95% CI [-0.784, +0.069] — contains zero, p=0.089. That point estimate is within a rounding error of the race-level one (-0.359); nothing about the underlying effect changed. What changed is n: 3,854 races carry the trend past zero with room to spare, 10 cycle-means do not have the power to, even measuring the identical decline. A reader skimming only "10 elections, not significant" would conclude nothing is happening here; a reader with the race-level data would conclude the opposite. Both readings are honest about what their own sample size can support.
Is it a slide, or a step? The by-cycle numbers below bunch high in 2004-08 (37-41 points) and sit lower and choppier from 2010 on (29-37). A dummy for year≥2010 instead of a continuous slope fits slightly better (R²=0.0106 vs 0.0065) and is itself decisive: pre-2010 mean +38.83 (1,188 races) vs 2010-22 mean +33.13 (2,666 races), a gap of -5.69 points, 95% CI [-7.46, -3.92] — excludes zero, p=2.9e-10. Both descriptions of the same data clear zero; this run does not adjudicate which mechanism is right, only that "incumbents win by less than they used to" is true under either one.
What hasn't moved: whether incumbents win at all. Race-level win probability on year, same clustering: +0.060 points/year, 95% CI [-0.060, +0.180] — contains zero, p=0.30. Across the full window 94.9% of incumbents on the ballot won re-election; 196 lost. Those losses cluster hard in one cycle: 51 of the 395 incumbents on the 2010 ballot lost — more than the next two worst cycles (2018: 32, 2006: 23) combined — against single digits in 2004, 2016 and 2022. Shrinking margins and a flat win rate are not the same claim: an incumbent who used to win by 40 points and now wins by 30 still wins, and the data say that is the more common story than an incumbent actually losing.
Classical (unclustered) race-level SE for comparison: slope -0.359, CI [-0.499, -0.219], p=5.1e-07 — narrower than the clustered CI above, as expected once same-seat repetition across cycles is accounted for, but the clustered interval is the one this run trusts.
| Specification | n | Slope | 95% CI | R² | Verdict |
|---|---|---|---|---|---|
| Race-level, all incumbents (clustered by seat) | 3,854 | -0.359 | [-0.510, -0.208] | 0.0065 | excludes zero, p=3.3e-06 |
| Race-level, contested only (drops walkovers) | 3,677 | -0.277 | [-0.408, -0.146] | 0.0054 | excludes zero, p=3.3e-05 |
| Cycle-level, n=10 (same claim, aggregated) | 10 | -0.358 | [-0.784, +0.069] | 0.3188 | contains zero, p=0.089 |
| Win rate trend (race-level, clustered) | 3,854 | +0.060 | [-0.060, +0.180] | 0.0003 | contains zero, p=0.3 |
| Cycle | Incumbents on ballot | Win rate | Mean margin | Median margin |
|---|---|---|---|---|
| 2004 | 395 | 98.7% | +40.95 | +35.10 |
| 2006 | 399 | 94.2% | +36.62 | +32.28 |
| 2008 | 394 | 95.4% | +38.92 | +33.92 |
| 2010 | 395 | 87.1% | +29.09 | +29.15 |
| 2012 | 372 | 94.3% | +32.78 | +28.38 |
| 2014 | 388 | 95.9% | +36.77 | +31.75 |
| 2016 | 391 | 97.7% | +37.49 | +32.01 |
| 2018 | 368 | 91.3% | +31.74 | +27.75 |
| 2020 | 388 | 96.7% | +31.16 | +27.27 |
| 2022 | 364 | 97.8% | +32.84 | +29.18 |
Method. The FEC's own compiled "Federal Elections" workbook for each cycle, 2004–2022 (the 2010–2022 files are the identical source run 505 used for its money join; 2004/2006/2008 come from the same publication's earlier editions). Race identity is the sheet's own STATE ABBREVIATION and DISTRICT columns, not the district digits embedded in a candidate's FEC ID — those are assigned once, the first time a candidate files, and are not updated when redistricting later moves them into a differently numbered district; trusting the ID inflated the 2010 race count past the 441-seat ceiling before this was caught and fixed. Fusion-voting states (New York, Connecticut, South Carolina) print one row per party line for the same candidate plus a combined-party row; every candidate's true vote total is recovered by collapsing to the max vote count across their own rows, since the combined row's count is always the sum of, and therefore at least as large as, any single line. A district-cycle is kept only when exactly one candidate carries the FEC's own incumbent flag; open seats and the rare case of two redistricted incumbents sharing a ballot are excluded, not resolved by guessing. All 5 self-checks in fetch_incumbency_537.py (valid IDs, no duplicate candidates, plausible per-cycle race counts, ID-vs-sheet state agreement ≥95%, all 10 cycles present) passed before this data was fit.
Limits, stated plainly. R² on every race-level fit is small (0.005-0.011) — year alone explains a sliver of why any one race's margin lands where it does; most of the variance is which seat and which candidates, not when. Clustering by seat corrects for the same district recurring across cycles but does not model who the incumbent actually is, so an incumbent's own personal strength or weakness carrying across their multiple re-election bids is not separately partialled out. 2010-22 is 7 cycles against 3 for 2004-08, so the "step" model's post-2010 mean is a longer, more representative window than its pre-2010 one — stated as an asymmetry in the comparison, not something the fit corrects for. This is margin and win rate only; it says nothing about why (nationalization, polarization, redistricting, or some mix), a causal question this run does not attempt.
house_incumbency_margins_537.csv (year, state, district, fec_id, party, incumbent_pct, best_other_pct, margin, n_candidates, won) · fit output (JSON).
