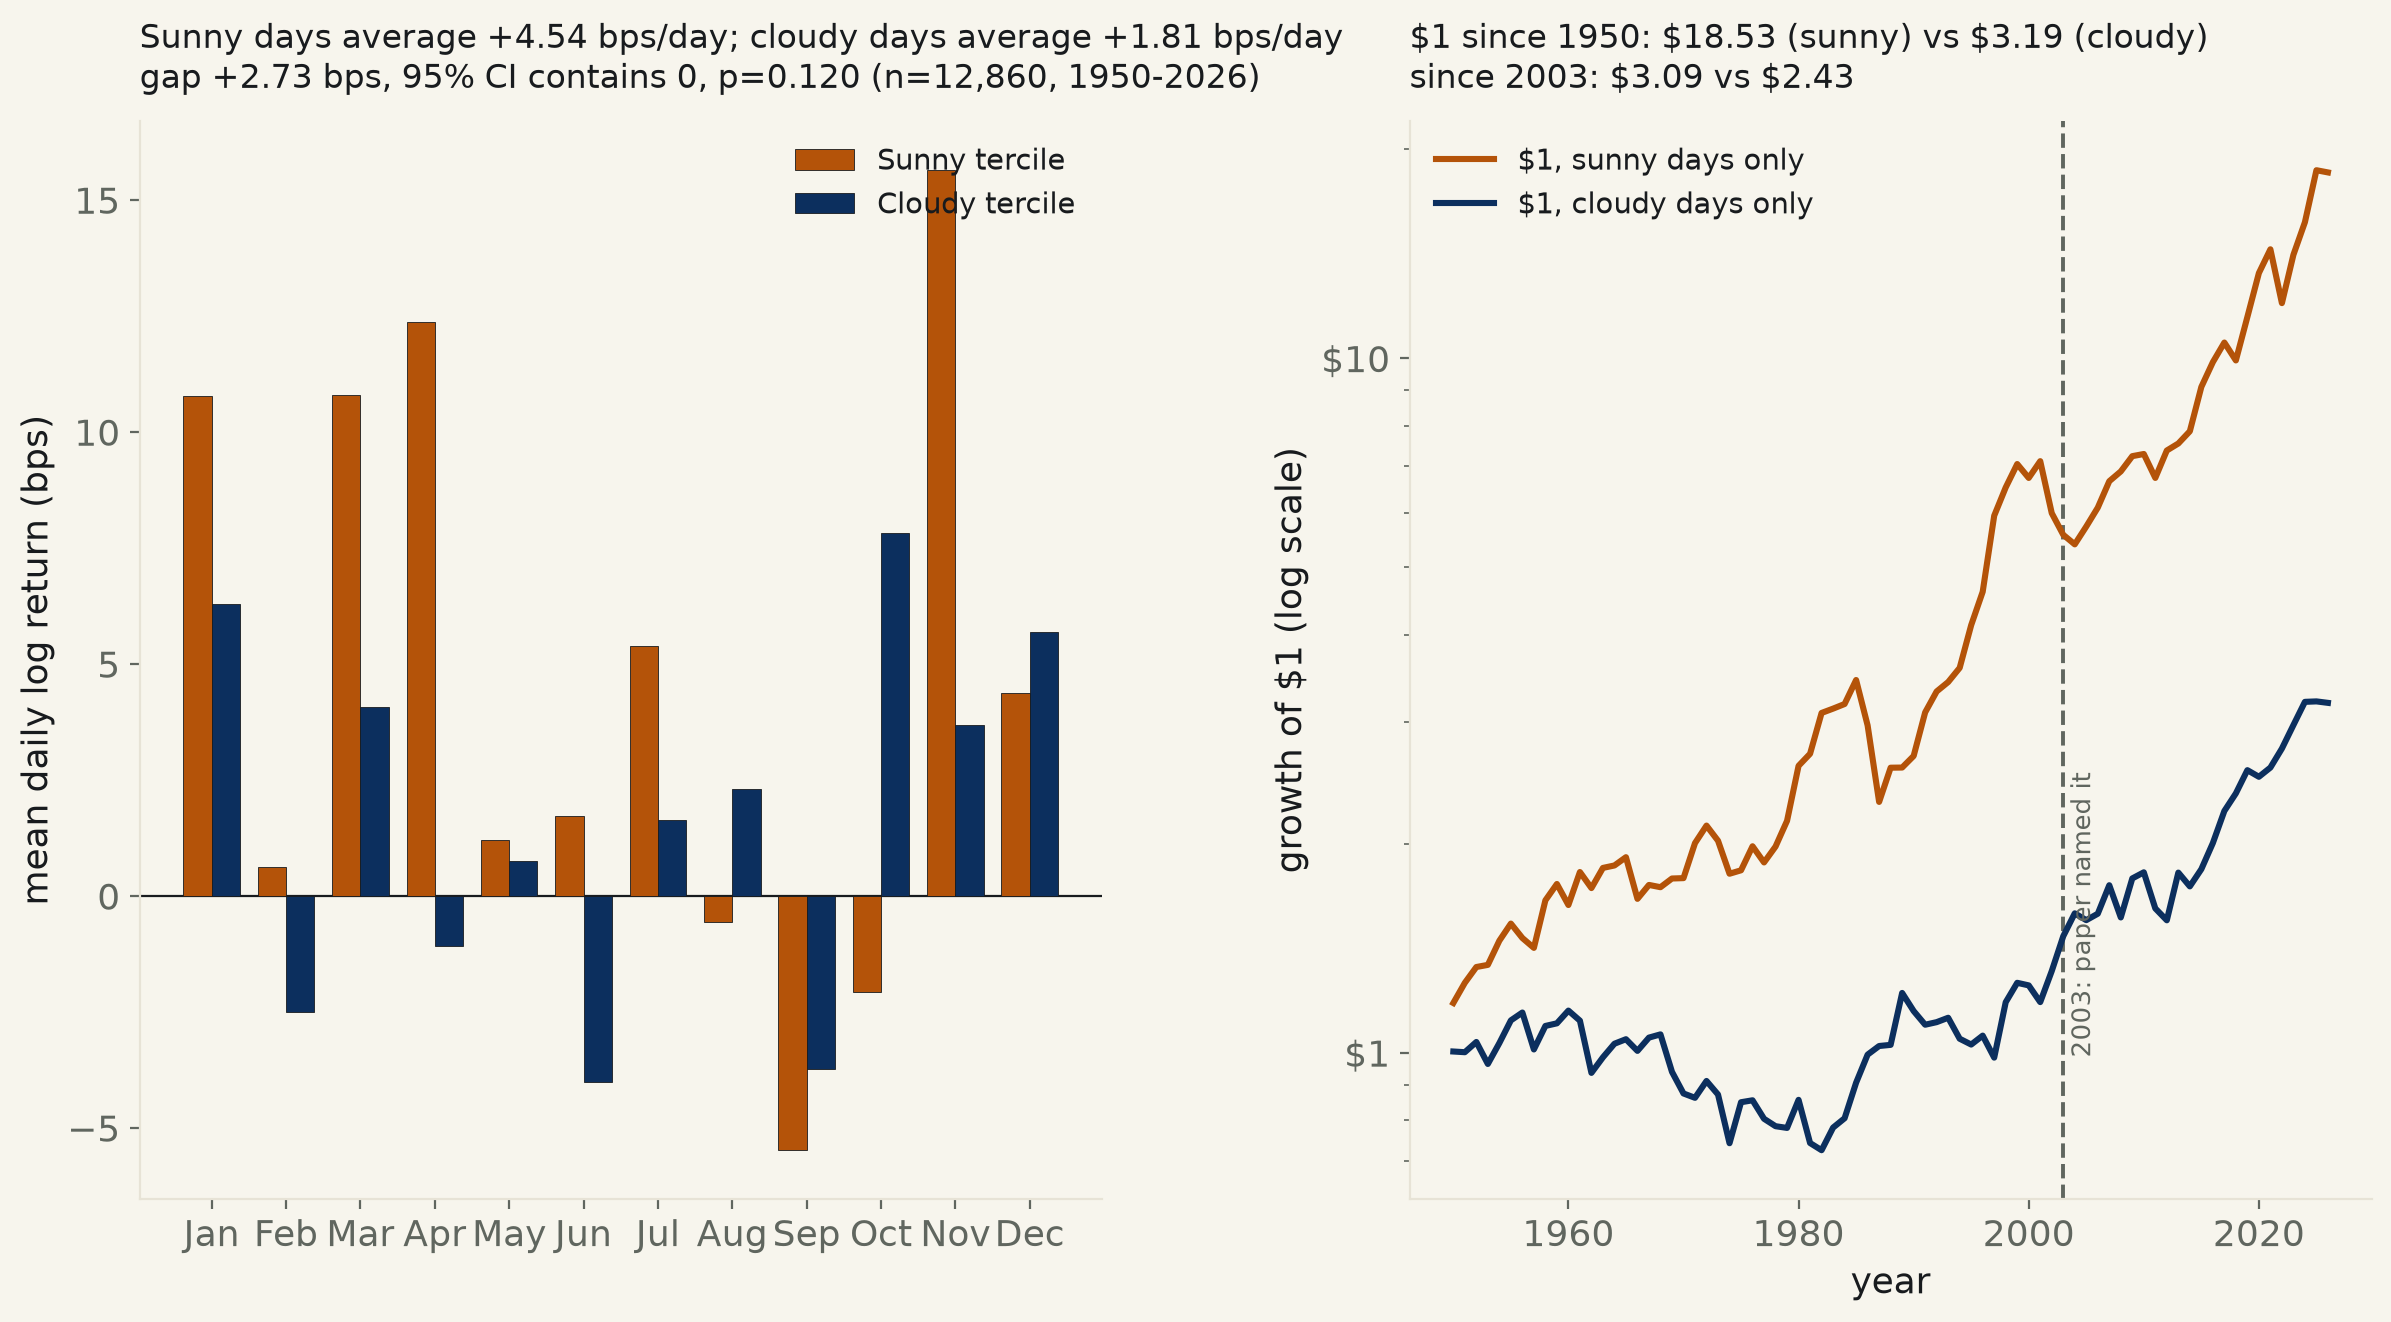
12,860 tercile-extreme trading days out of 19,292 total, 1950–2026. New York City's sunniest third of days (ranked within each calendar month, so the season itself can't drive it) average +4.54 bps; the cloudiest third average +1.81 bps — a gap of +2.73 bps that leans the direction Hirshleifer & Shumway's 2003 "Good Day Sunshine" paper found, but whose 95% interval cannot exclude zero (p=0.120).
Hirshleifer and Shumway's "Good Day Sunshine: Stock Returns and the Weather" (Journal of Finance, 2003) tested 26 international stock exchanges against the morning cloud cover in each exchange's home city and found sunny days beat cloudy ones, on average, across the whole panel — a widely cited crack in the idea that markets run on information alone, not mood. This run isolates the single case a US reader would ask about first: does it hold for the S&P 500 and New York City, tested honestly, on the full run of data available rather than the paper's original 1982–1997 window?
Sunshine has its own enormous seasonal cycle, and so do stock returns — this desk's own runs 531 and 533 already found real May–Oct and January patterns unrelated to weather. Comparing raw sunshine to raw returns would just pit two unrelated calendar cycles against each other. So every test here ranks each day's sunshine fraction (measured sunlight ÷ total daylight that day) only against other days in the same calendar month, pooled across all 76 years — a within-month comparison that cannot be driven by the season itself. The top third of each month's sunniest days are tagged "sunny," the bottom third "cloudy," the middle third set aside for the headline test.
The full 76-year record leans the paper's direction and can't confirm it. Sunny-tercile days average +4.54 bps; cloudy-tercile days average +1.81 bps — a gap of +2.73 bps, 95% CI [-0.71, +6.17], p=0.120, Newey-West HAC agreeing (p=0.137) — contains zero. A 4,000-draw year-block bootstrap puts 95.9% of resamples on the positive side, just short of this desk's 95% bar. A continuous robustness check — every one of the 19,292 fitted days, not just the two extreme terciles, ranked by within-month sunshine percentile — agrees in size and significance: the full swing from a month's cloudiest to its sunniest day predicts +4.67 bps, p=0.060, also contains zero.
Split at 2003, the paper's own publication year, and the lean gets weaker, not stronger. Pre-2003 (8,766 tercile-days): +3.40 bps, CI [-0.47, +7.28], p=0.085 — the era the paper's own sample overlaps, still contains zero but closer to the desk's bar than the full sample. Since 2003 (4,094 tercile-days): +1.43 bps, CI [-5.49, +8.34], p=0.69 — the gap nearly disappears. A formal interaction test on whether the gap itself changed: -1.98 bps, 95% CI [-9.36, +5.41], p=0.60 — also contains zero, so the honest statement is narrow: this test cannot confirm a weather effect in either era alone, and it cannot confirm the two eras are different from each other either.
Concrete, no regression needed — and a caution about what it does and doesn't show: $1 that earns the S&P 500's log return only on sunny-tercile days and sits at 0% the rest of the time compounds, 1950–2026, to $18.53. The identical $1 restricted to cloudy-tercile days compounds to $3.19. Restricted to the 2003–2026 window alone: $3.09 (sunny) vs. $2.43 (cloudy). These numbers are real arithmetic on real data, but they are not evidence of a tradeable edge the daily regression itself failed to find — compounding a small, statistically unconfirmed daily average over thousands of trading days will always look dramatic in dollar terms even when the underlying per-day gap cannot be distinguished from noise. The dollar figures illustrate what a persistent 2.7 bp/day edge would be worth if it were real; the p-values above are the desk's actual verdict on whether it is.
Point-biserial r=+0.0137 (full sample). Continuous check on all 19,292 fitted days (within-month sunshine percentile, centered): slope +4.67 bps across the full range, p=0.060. Pre-2003 n=8,766, post-2003 n=4,094. Era interaction coefficient -1.978 bps, 95% CI [-9.363, +5.406], p=0.599.
| Year | Sunny mean (bps) | Cloudy mean (bps) | n sunny | n cloudy | Which led |
|---|---|---|---|---|---|
| 1950 | +25.86 | +0.45 | 64 | 105 | Sunny |
| 1951 | +9.04 | -0.27 | 74 | 87 | Sunny |
| 1952 | +5.89 | +4.59 | 89 | 74 | Sunny |
| 1953 | +0.80 | -9.73 | 89 | 75 | Sunny |
| 1954 | +8.62 | +10.67 | 93 | 65 | Cloudy |
| 1955 | +5.97 | +10.59 | 95 | 71 | Cloudy |
| 1956 | -6.21 | +2.80 | 77 | 93 | Cloudy |
| 1957 | -3.51 | -15.69 | 93 | 78 | Sunny |
| 1958 | +21.59 | +8.20 | 73 | 95 | Sunny |
| 1959 | +5.90 | +0.98 | 92 | 88 | Sunny |
| 1960 | -8.30 | +5.95 | 84 | 71 | Cloudy |
| 1961 | +13.34 | -4.28 | 82 | 78 | Sunny |
| 1962 | -5.92 | -20.61 | 90 | 84 | Sunny |
| 1963 | +6.96 | +7.94 | 96 | 65 | Cloudy |
| 1964 | +0.89 | +5.70 | 91 | 79 | Cloudy |
| 1965 | +3.05 | +2.05 | 90 | 73 | Sunny |
| 1966 | -17.06 | -4.78 | 81 | 81 | Cloudy |
| 1967 | +6.61 | +5.18 | 70 | 85 | Sunny |
| 1968 | -1.03 | +1.53 | 73 | 70 | Cloudy |
| 1969 | +3.17 | -15.53 | 91 | 80 | Sunny |
| 1970 | +0.17 | -8.53 | 76 | 84 | Sunny |
| 1971 | +13.34 | -1.66 | 87 | 87 | Sunny |
| 1972 | +8.67 | +6.00 | 67 | 93 | Sunny |
| 1973 | -6.52 | -5.28 | 77 | 85 | Cloudy |
| 1974 | -13.03 | -19.94 | 84 | 81 | Sunny |
| 1975 | +1.89 | +14.62 | 60 | 93 | Cloudy |
| 1976 | +8.31 | +0.87 | 96 | 74 | Sunny |
| 1977 | -6.88 | -7.86 | 78 | 78 | Sunny |
| 1978 | +5.73 | -3.03 | 92 | 81 | Sunny |
| 1979 | +8.89 | -0.72 | 96 | 79 | Sunny |
| 1980 | +20.25 | +13.30 | 90 | 70 | Sunny |
| 1981 | +4.65 | -18.35 | 86 | 78 | Sunny |
| 1982 | +20.20 | -2.88 | 67 | 83 | Sunny |
| 1983 | +2.04 | +7.89 | 70 | 95 | Cloudy |
| 1984 | +2.07 | +3.65 | 74 | 85 | Cloudy |
| 1985 | +9.70 | +14.91 | 82 | 79 | Cloudy |
| 1986 | -18.35 | +10.46 | 82 | 89 | Cloudy |
| 1987 | -25.89 | +3.71 | 98 | 77 | Cloudy |
| 1988 | +11.82 | +0.49 | 96 | 77 | Sunny |
| 1989 | +0.06 | +17.56 | 81 | 98 | Cloudy |
| 1990 | +4.22 | -7.67 | 91 | 78 | Sunny |
| 1991 | +17.41 | -6.15 | 83 | 74 | Sunny |
| 1992 | +11.98 | +0.90 | 58 | 95 | Sunny |
| 1993 | +3.76 | +1.79 | 83 | 81 | Sunny |
| 1994 | +5.59 | -7.72 | 84 | 90 | Sunny |
| 1995 | +14.92 | -2.64 | 95 | 73 | Sunny |
| 1996 | +17.27 | +2.82 | 64 | 105 | Sunny |
| 1997 | +28.34 | -10.42 | 89 | 70 | Sunny |
| 1998 | +11.42 | +20.41 | 82 | 90 | Cloudy |
| 1999 | +7.92 | +8.36 | 98 | 77 | Cloudy |
| 2000 | -5.36 | -1.05 | 86 | 81 | Cloudy |
| 2001 | +5.40 | -7.81 | 103 | 71 | Sunny |
| 2002 | -17.76 | +13.03 | 97 | 79 | Cloudy |
| 2003 | -9.21 | +11.79 | 78 | 98 | Cloudy |
| 2004 | -3.68 | +8.16 | 86 | 93 | Cloudy |
| 2005 | +6.22 | -2.64 | 95 | 86 | Sunny |
| 2006 | +6.95 | +2.73 | 90 | 78 | Sunny |
| 2007 | +10.43 | +9.74 | 84 | 97 | Sunny |
| 2008 | +3.78 | -13.36 | 86 | 80 | Sunny |
| 2009 | +6.94 | +13.48 | 73 | 96 | Cloudy |
| 2010 | +0.83 | +2.63 | 86 | 77 | Cloudy |
| 2011 | -9.78 | -14.25 | 81 | 84 | Sunny |
| 2012 | +10.21 | -4.75 | 89 | 83 | Sunny |
| 2013 | +2.50 | +18.40 | 93 | 86 | Cloudy |
| 2014 | +5.13 | -4.87 | 79 | 94 | Sunny |
| 2015 | +18.16 | +6.14 | 81 | 93 | Sunny |
| 2016 | +8.84 | +10.96 | 93 | 79 | Cloudy |
| 2017 | +9.02 | +11.20 | 72 | 95 | Cloudy |
| 2018 | -8.72 | +5.03 | 68 | 116 | Cloudy |
| 2019 | +17.37 | +7.86 | 83 | 98 | Sunny |
| 2020 | +19.93 | -2.29 | 73 | 96 | Sunny |
| 2021 | +8.47 | +3.47 | 93 | 88 | Sunny |
| 2022 | -19.83 | +7.69 | 90 | 82 | Cloudy |
| 2023 | +18.00 | +9.27 | 89 | 84 | Sunny |
| 2024 | +12.43 | +10.00 | 87 | 77 | Sunny |
| 2025 | +19.81 | +0.17 | 87 | 87 | Sunny |
| 2026 | -1.24 | -0.93 | 59 | 52 | Cloudy |
Method. Daily sunshine_duration and daylight_duration for New York City (40.7128, -74.0060), 1950-01-01 to yesterday, pulled from Open-Meteo's historical archive (ERA5 reanalysis), the same city Hirshleifer & Shumway used as their NYSE weather proxy. Sunshine fraction = sunshine_duration ÷ daylight_duration, clipped to [0,1]. Joined on calendar date to daily ^GSPC closes from Yahoo Finance back to 1950-01-03 (inner join, so only actual trading days survive; weather exists for weekends and holidays too but there is no return to pair it with). 19,292 trading days after the first day (no prior close) is dropped. Within each calendar month, every day's sunshine fraction is ranked against every other day in that same month across all 76 years (percentile 0-100), then split into thirds: top third "sunny" (6,434 days), bottom third "cloudy" (6,426 days), middle third excluded from the headline test. HAC standard errors use 5 lags, since cloudy weather clusters across consecutive days even though daily returns themselves barely autocorrelate.
Limits, stated plainly. This is one city and one index, where the original paper pooled 26 exchanges specifically because any single market's daily weather-return link is weak and noisy — this run's inability to clear its own bar on NYC alone does not refute the original panel finding, it only means a single-city replication on this much data cannot independently confirm it. R²=0.0002 on the headline regression is small by design; sunshine is not remotely a dominant driver of any day's return. "Sunshine" here is measured for the whole day (ERA5's daily total), not the pre-market morning weather Hirshleifer & Shumway actually used, which could in principle mute or shift the relationship in either direction; testing morning-only weather against the same-day close would need sub-daily reanalysis data this run did not pull. Trading on same-day weather would also face real transaction costs and the practical problem of knowing the day's full sunshine total before the close — this run reports the ex-post statistical relationship, not a backtested strategy.
sunshine_stocks_535.csv (full daily pull) · fit output (JSON) · table above is the full 77-year sunny-vs-cloudy mean comparison (bold rows are since the 2003 paper).
^GSPC daily history via yfinance, keyless · the claim itself: David Hirshleifer & Tyler Shumway, "Good Day Sunshine: Stock Returns and the Weather," Journal of Finance 58(3), 2003.
