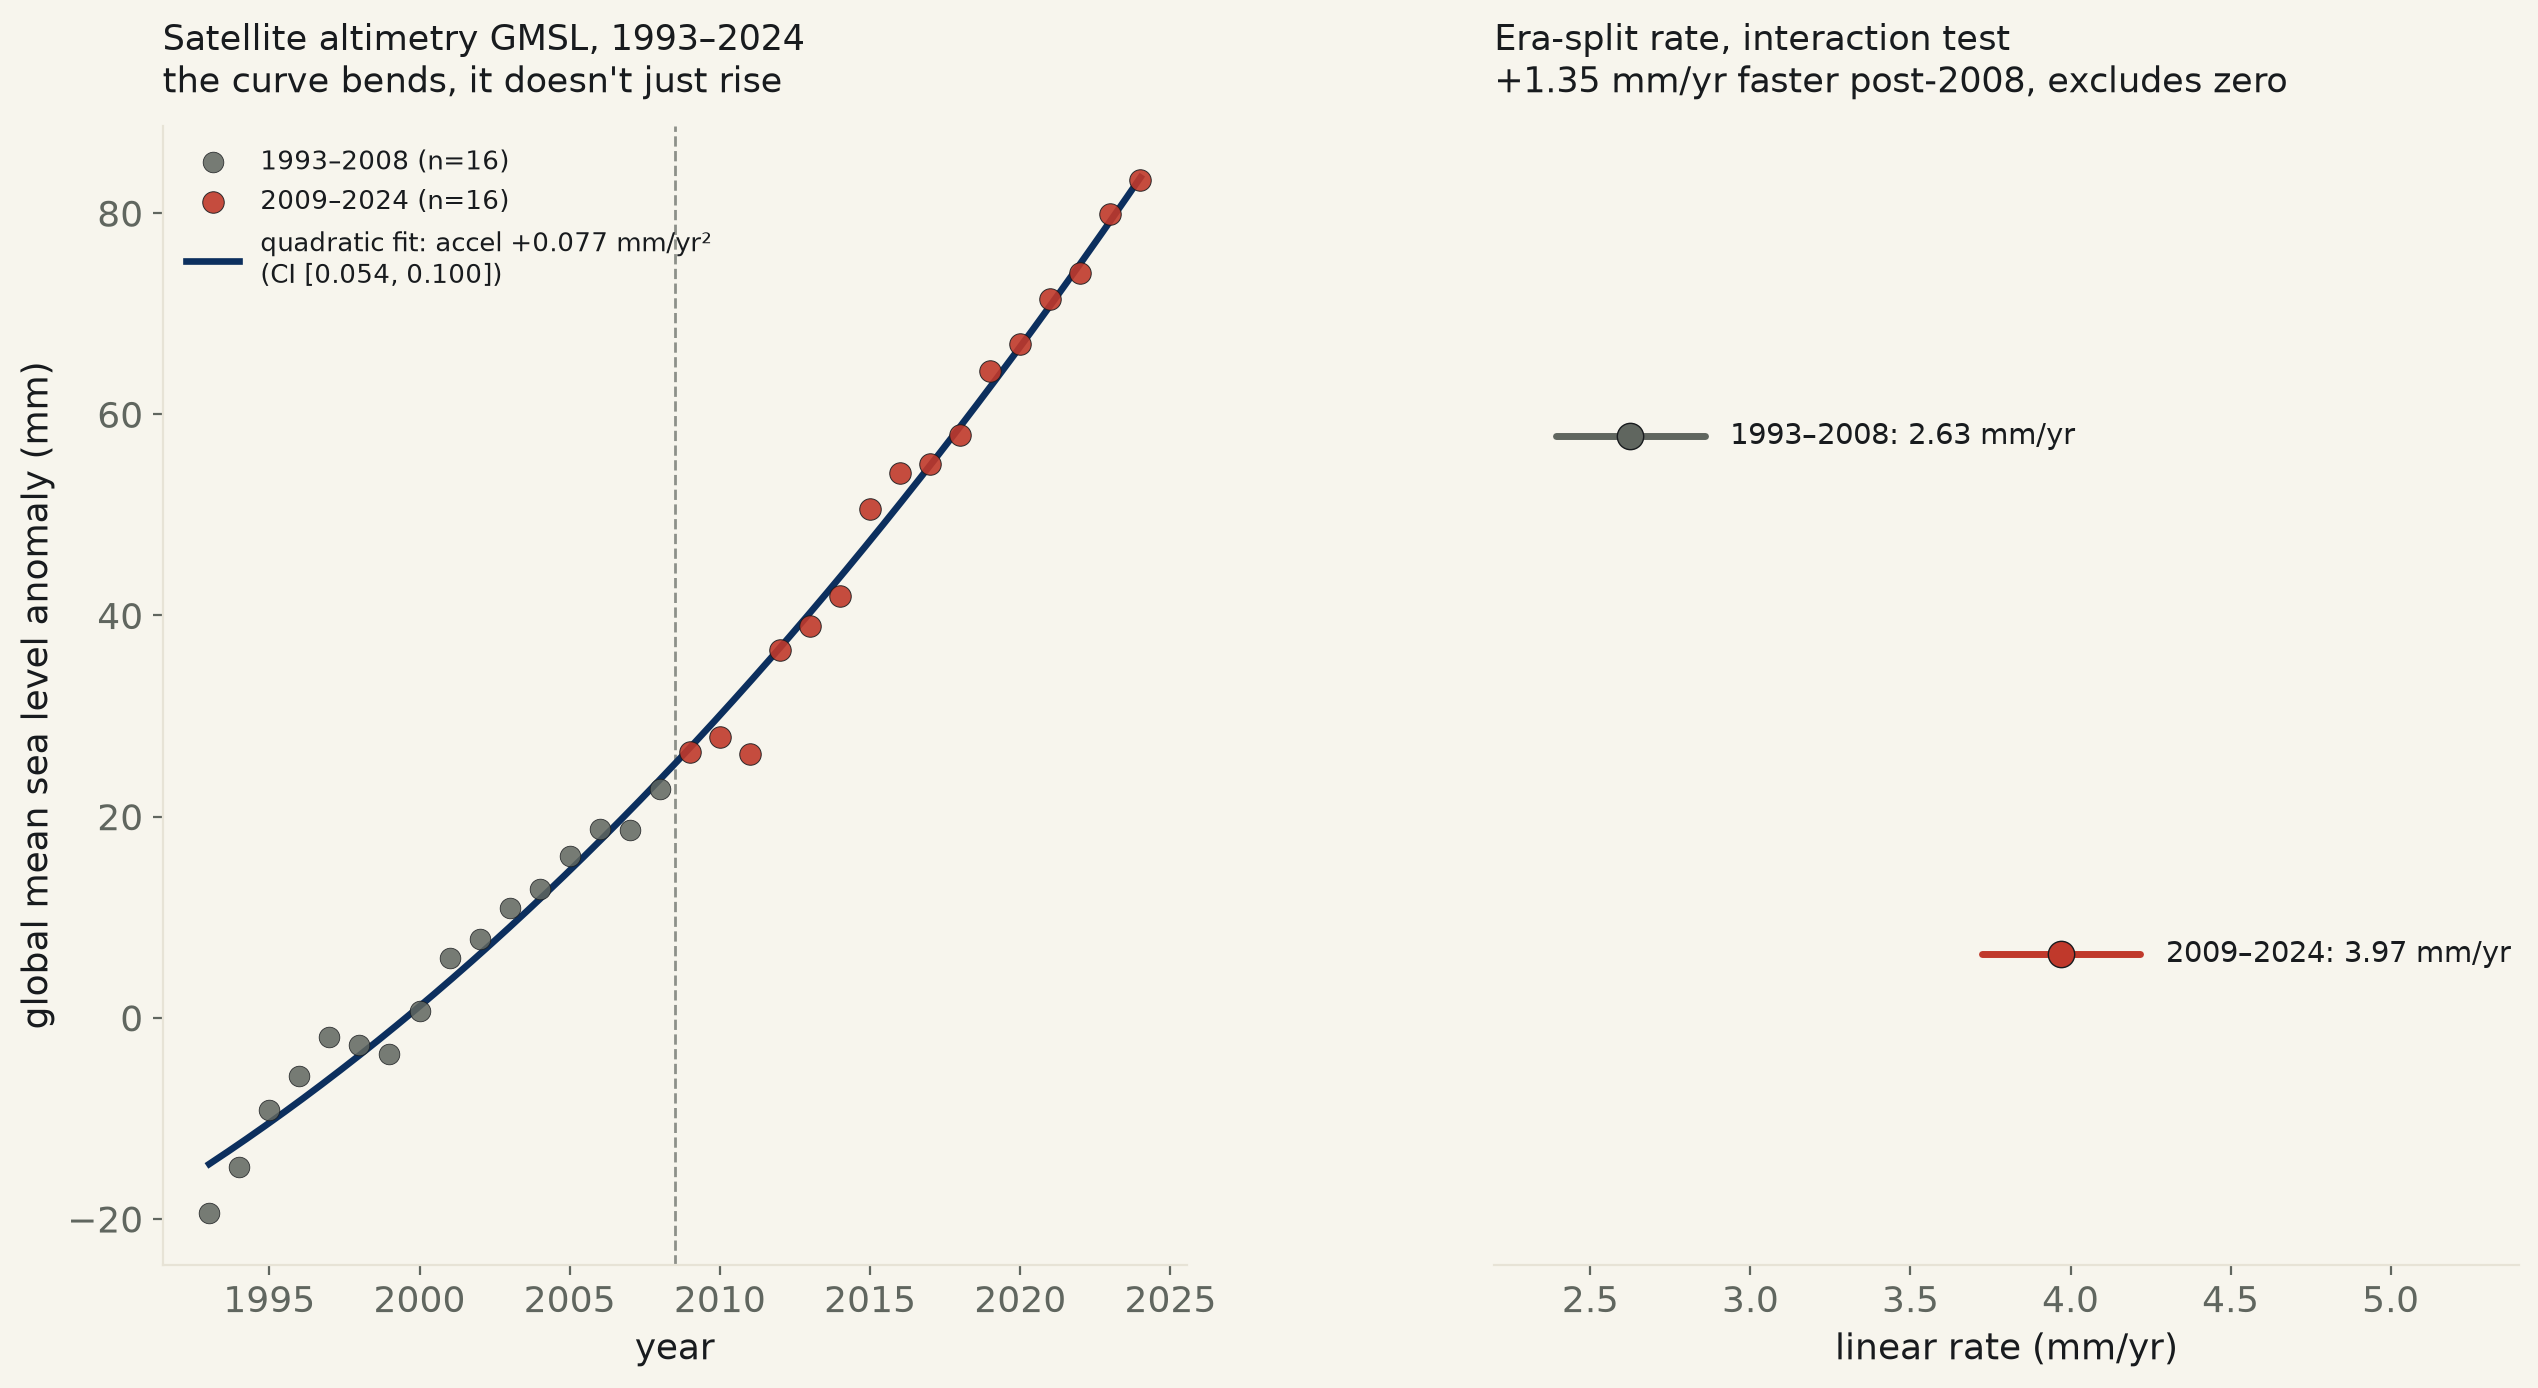
32 years of NOAA’s own satellite altimetry record, five missions spliced into one series, 1993–2024. Raw trend 3.23 mm/yr matches the source file’s own stated 3.17 mm/yr. The acceleration term clears zero three independent ways: annual quadratic +0.077 mm/yr², CI [0.054, 0.100]. Split at 2008: the rate itself rose from 2.63 to 3.97 mm/yr, an interaction test confirming the change (p=2.9e-09).
“Sea level is accelerating” has circulated since Nerem et al.’s 2018 PNAS paper found a satellite-era acceleration of 0.084 mm/yr² and warned it could double the total 21st-century rise projected from a straight line. That estimate corrects for ENSO and volcanic noise this run does not attempt to remove — so the test here is a plainer one: does an uncorrected quadratic term, fit three independent ways on NOAA’s own public altimetry record, agree it isn’t zero?
First, the sanity check. This run’s own splice of five altimetry missions (TOPEX/Poseidon through Sentinel-6MF, 100 handover cycles averaged where two missions briefly overlap) reproduces NOAA’s own header trend almost exactly: 3.23 mm/yr (HAC 95% CI [3.05, 3.41]) against the source file’s own stated 3.17 mm/yr. The splicing method holds up before anything else is asked of it.
The acceleration term clears zero all three ways. A quadratic fit on the 32 annual means returns +0.077 mm/yr², 95% CI [0.054, 0.100] — excludes zero (p=1.4e-07). The identical fit on all 1,549 raw ~10-day cycles with Newey-West HAC errors agrees, +0.082 mm/yr² (CI [0.055, 0.108]). A 4,000-draw year-block bootstrap agrees closely (CI [0.056, 0.107], 100% of resamples positive). All three intervals sit close to Nerem’s own published 0.084 mm/yr² despite this run applying no ENSO or volcanic correction at all.
Made visible without a curve: split the 32 years at their own median, 2008 (mechanical, not cherry-picked) — 16–2008 rises at 2.63 mm/yr (CI [2.39, 2.86]); 2009–2024 rises at 3.97 mm/yr (CI [3.72, 4.22]). A formal interaction test on the pooled annual series confirms the two rates are genuinely different, not two halves of noise: +1.35 mm/yr faster in the second half, 95% CI [1.02, 1.67] — excludes zero (p=2.9e-09).
Concrete, no regression needed: global mean sea level rose 103 mm (4.0 inches) from 1993 to 2024, 31 years, averaging 3.31 mm/yr — but the quadratic fit’s own implied instantaneous rate nearly doubles across that span, from 1.97 mm/yr at the record’s start to 4.36 mm/yr by its end.
| Linear trend specification | slope (mm/yr) | 95% CI | R² |
|---|---|---|---|
| Raw ~10-day cycles, HAC SE (n=1,549) | +3.231 | [+3.047, +3.414] | 0.976 |
| Annual means, plain OLS (n=32) | +3.164 | [+3.014, +3.315] | 0.984 |
| Acceleration test (mm/yr²) | point estimate | 95% CI | note |
|---|---|---|---|
| Annual quadratic term (n=32) | +0.077 | [+0.054, +0.100] | p=1.4e-07 |
| Raw quadratic term, HAC SE (n=1,549) | +0.082 | [+0.055, +0.108] | p=1.1e-09 |
| Year-block bootstrap (4,000 draws) | — | [+0.056, +0.107] | 100.0% of draws positive |
The raw-cycle fits use Newey-West HAC standard errors (73-cycle window, roughly two years) because consecutive 10-day altimetry cycles are not independent draws. The annual-mean fits treat each calendar year as one observation, the same discipline this desk applies to any yearly-resolution trend claim.
Method. Every row is NOAA/STAR's own published cycle-mean sea level anomaly for the global ocean between 66°S and 66°N, seasonal (annual) signal already removed by the source, no glacial isostatic adjustment applied (matching the source file's own stated convention — GIA is a near-constant offset that does not affect a trend or acceleration estimate). Five altimetry missions (TOPEX/Poseidon, Jason-1, Jason-2, Jason-3, Sentinel-6MF) are spliced into one continuous series by averaging whichever mission column(s) report a value for a given cycle; 100 of 1,557 raw cycles have two missions reporting during a handover and are averaged, not chosen between. 1992 (2 cycles, Sept–Dec only) and 2025 (6 cycles, through mid-February only) are partial calendar years, excluded from every annual fit and every year-count above, kept in the raw series, reason stated here rather than silently dropped. The 2008 split point is the annual series' own median year, fixed by that mechanical rule before any interaction test ran, not chosen after seeing which split looked best.
Limits, stated plainly. This run applies no correction for ENSO or volcanic aerosol forcing, the two dominant sources of year-to-year noise in a global sea level record; Nerem et al. 2018's own 0.084 mm/yr² estimate is corrected for both, and this run's uncorrected estimates landing close to that number is suggestive agreement, not a replication of their exact method. The satellite altimetry era is the whole available record here, 32 years — this run says nothing about whether the rate before 1993 (tide-gauge era) was different, only about the shape within the era it can measure. Sampling density itself rises across the record (31–36 cycles/year in the 1990s to 67–74/year by the 2020s, as more altimeters fly concurrently) since annual averaging is not density-weighted to correct for it; this is a property of the mission manifest, not of the ocean, and is disclosed rather than adjusted away.
gmsl_noaa_529.csv (full 1,557-cycle pull, 1992–2025) · fit output (JSON).
| Year | altimetry cycles | mean GMSL anomaly (mm) |
|---|---|---|
| 1993 | 34 | -19.46 |
| 1994 | 34 | -14.81 |
| 1995 | 31 | -9.22 |
| 1996 | 34 | -5.82 |
| 1997 | 33 | -1.88 |
| 1998 | 33 | -2.72 |
| 1999 | 33 | -3.57 |
| 2000 | 34 | +0.63 |
| 2001 | 36 | +5.97 |
| 2002 | 59 | +7.81 |
| 2003 | 61 | +10.93 |
| 2004 | 61 | +12.79 |
| 2005 | 58 | +16.12 |
| 2006 | 36 | +18.78 |
| 2007 | 37 | +18.70 |
| 2008 | 43 | +22.78 |
| 2009 | 71 | +26.45 |
| 2010 | 74 | +27.86 |
| 2011 | 73 | +26.19 |
| 2012 | 69 | +36.55 |
| 2013 | 52 | +38.95 |
| 2014 | 36 | +41.94 |
| 2015 | 37 | +50.61 |
| 2016 | 54 | +54.19 |
| 2017 | 51 | +55.06 |
| 2018 | 37 | +57.94 |
| 2019 | 37 | +64.33 |
| 2020 | 37 | +67.02 |
| 2021 | 49 | +71.43 |
| 2022 | 67 | +74.06 |
| 2023 | 74 | +79.87 |
| 2024 | 74 | +83.27 |
