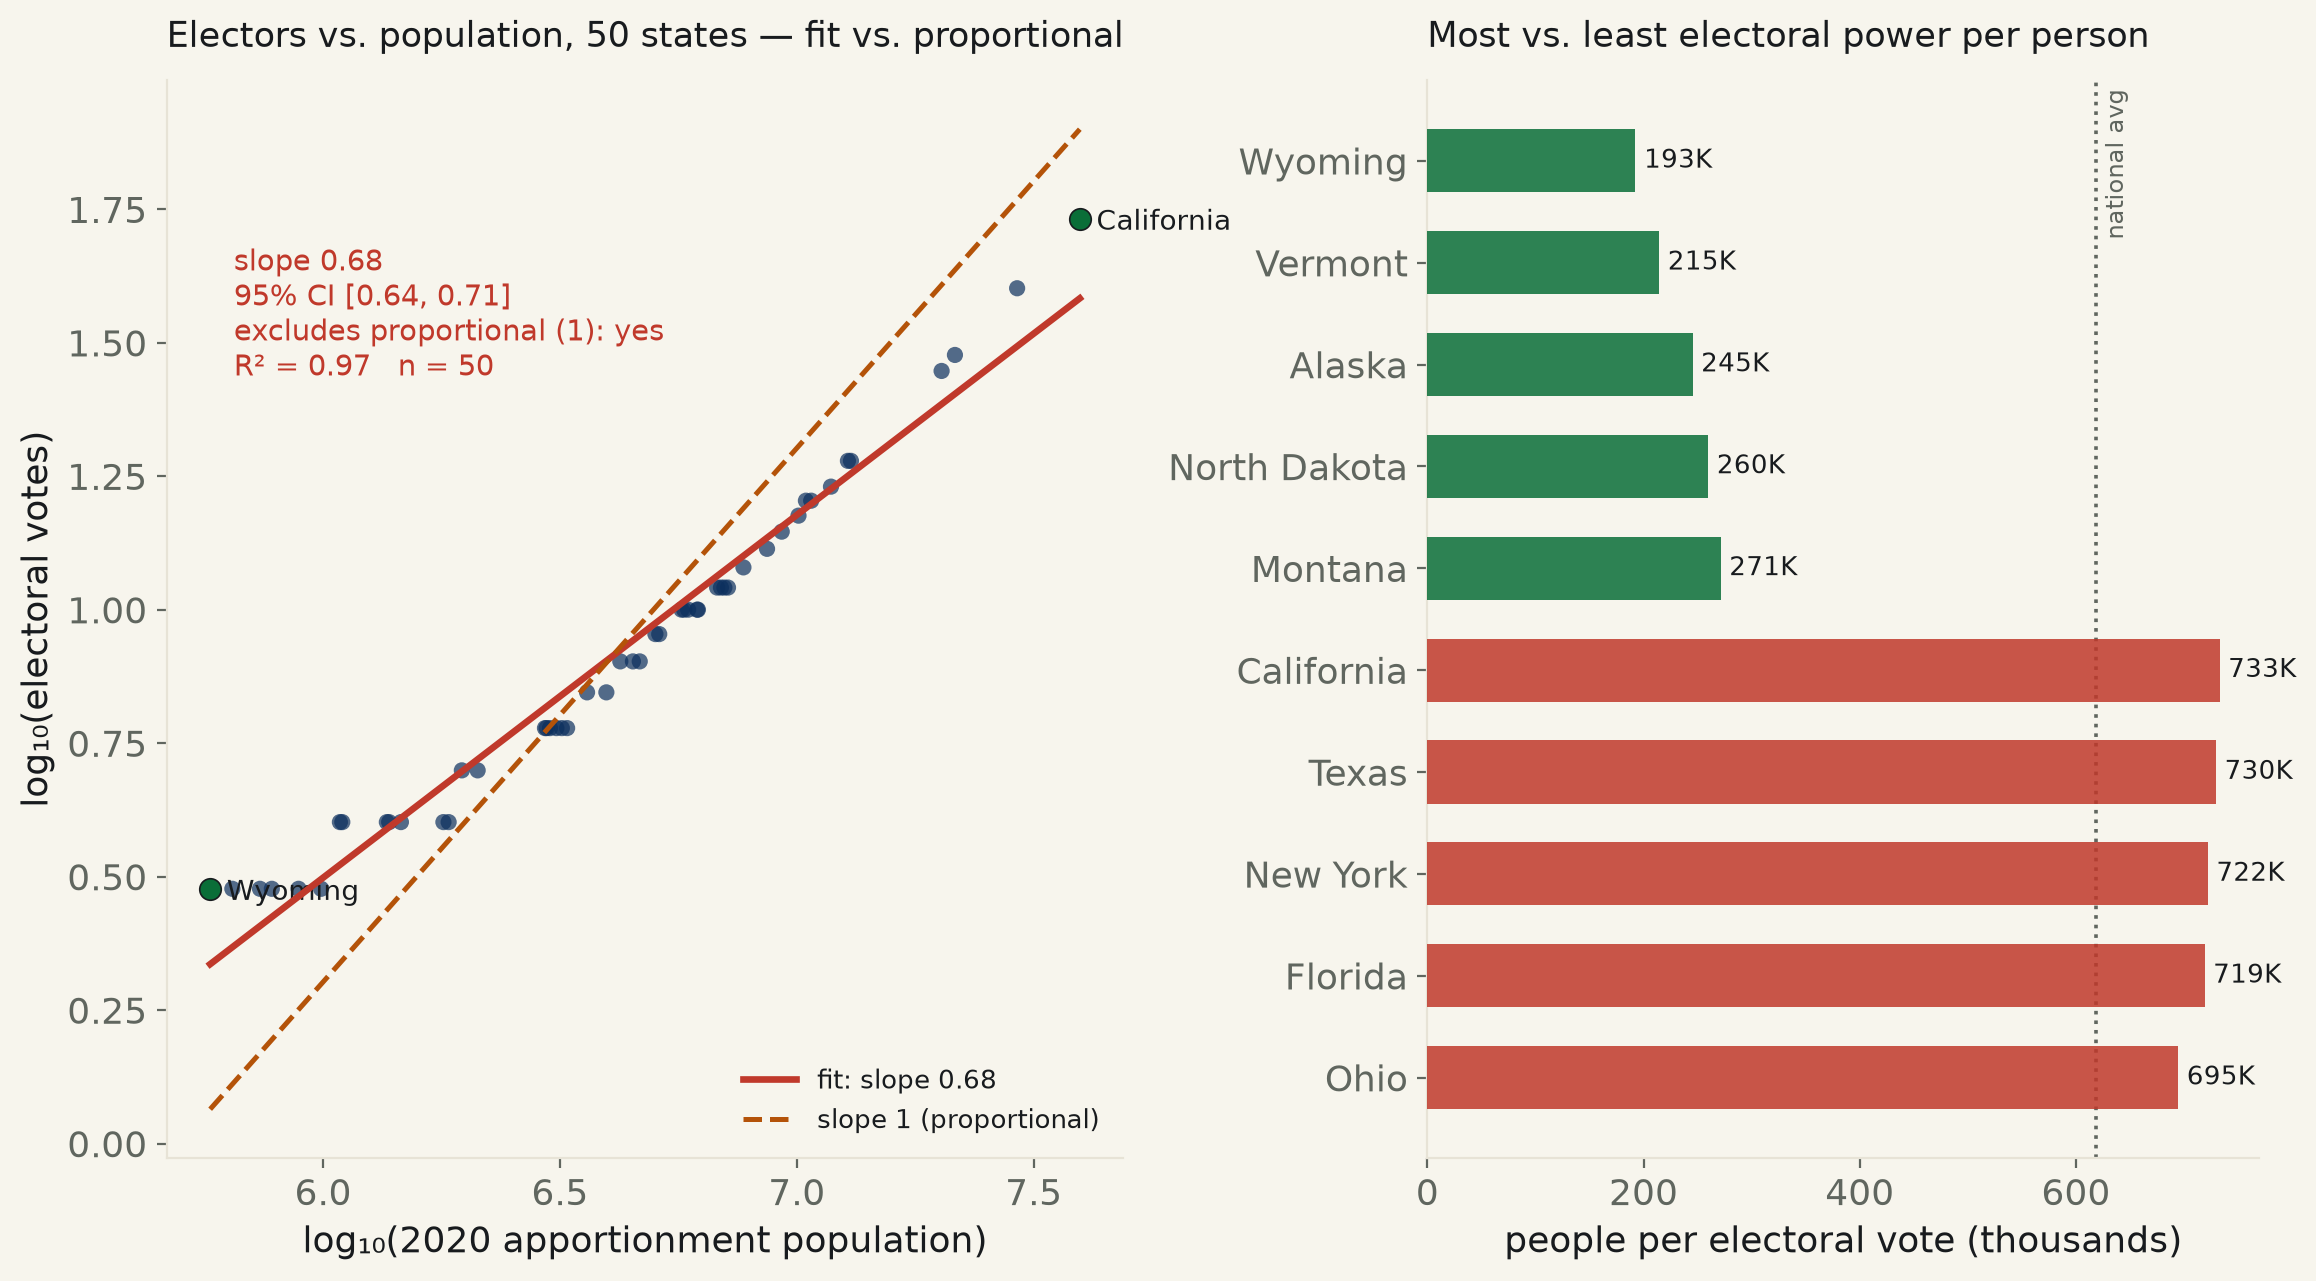
All 50 states, 2020 Census apportionment. House seats alone track population closely — slope 0.97, 95% CI [0.94, 1.00], contains the proportional value of 1 (p=0.07). Add the Constitution's fixed +2 Senate seats to get real electors and the slope falls to 0.68, CI [0.64, 0.71] — excludes 1. Population per electoral vote: 192,573 in Wyoming vs. 732,903 in California, a 3.8× gap. In the Senate alone, fixed at 2 seats per state with no fit needed: 68.5×.
“A Wyoming vote counts for more than a California vote” circulates every four years, usually with no number attached. There is a real, citable number, and the US Census Bureau's own 2020 apportionment table — the count that sets both the House and, by extension, the Electoral College for the decade — is enough to compute it without touching a poll or a model. Every one of the 50 states' apportionment population and House seat count comes straight from the Bureau's own release; electoral votes are not a Census number but are not invented either — they are the House seat count plus a fixed 2, written into the US Constitution (Article II and the 12th and 23rd Amendments), applied here as a formula, not a lookup.
The House itself comes close to proportional — close enough that this run can't rule out perfect proportionality at conventional significance. Regressing log₁₀(House seats) on log₁₀(population) across all 50 states: slope 0.973, 95% CI [0.943, 1.002], R²=0.989. Tested against the null that the slope is exactly 1 — what perfect proportional representation would look like — the interval's own upper bound just barely reaches 1.00 (p=0.07): contains 1, not confirmed different from proportional. The reason it isn't exactly 1: every state gets a floor of one House seat no matter how small, which is the only thing bending the House's own Method of Equal Proportions away from strict population-proportionality.
Bolt on the fixed two Senate seats every state gets, and the picture flips hard. The same regression on electoral votes (House seats + 2) returns slope 0.679, 95% CI [0.644, 0.715], R²=0.969 — a 4,000-draw bootstrap agrees almost exactly (CI [0.626, 0.733], 0% of resamples above 1.0). This interval excludes 1 by a wide margin (t=-18.3 vs. the proportional null). The disproportion the House itself avoids is entirely reintroduced by a flat, population-blind add-on applied equally to Wyoming and California alike.
Named, in people per vote. Wyoming, the smallest state, has 577,719 people and 3 electoral votes — 192,573 people per electoral vote. California has 39,576,757 people and 54 electoral votes — 732,903 people per electoral vote. A Californian's electoral share is diluted 3.8× further than a Wyomingite's. Ohio, Florida, New York and Texas sit in the same diluted band as California — the five biggest states are the five least electorally weighted per person, and the four smallest (Wyoming, Vermont, Alaska, North Dakota, all frozen at the 1-seat floor) are the five most weighted.
The Senate needs no regression at all — it's the structural extreme the House and Electoral College sit between. Every state gets exactly 2 senators regardless of population, by the Constitution's own text; that's not a slope to estimate, it's a fact to divide by. Wyoming: 288,860 people per senator. California: 19,788,378 people per senator. Ratio: 68.5× — roughly 18 times more lopsided than the Electoral College figure, because the Electoral College at least partially inherits the House's near-proportional seats before the fixed +2 is added, while the Senate is 100% fixed add-on and 0% population-weighted.
| Regression | n | slope | 95% CI | R² | p vs. slope=1 | excludes 1? |
|---|---|---|---|---|---|---|
| House seats alone | 50 | +0.973 | [+0.943, +1.002] | 0.989 | 0.067 | no |
| Electors (House + fixed 2) | 50 | +0.679 | [+0.644, +0.715] | 0.969 | 0 | yes |
“Excludes 1” means the 95% CI does not contain slope=1 (perfect proportionality). The Senate row isn't in this table because it needs no regression: every state gets exactly 2 senators by the Constitution's text, so log(senators) vs. log(population) has a slope of exactly 0 by construction.
Method. Every row comes from the US Census Bureau's own "Table 1. Apportionment Population and Number of Representatives by State: 2020 Census" — the official release that reapportions the House (and thus the Electoral College) for the decade, computed under the Method of Equal Proportions (2 U.S.C. §§2a, 2b). Electoral votes are computed as House seats + 2, the fixed Senate-seat add-on set by Article II and the 12th/23rd Amendments — a formula applied to the Bureau's own seat counts, not a separately sourced or estimated number. Both regressions are ordinary least squares in log-log space, tested against the null that the slope equals 1 (what an exactly population-proportional system would produce), not the trivial null of zero — of course seats and electors rise with population; the question worth asking is whether they rise at the same rate.
Limits, stated plainly. The Bureau's own apportionment population figure "excludes the population of the District of Columbia" by definition — DC gets 3 electoral votes under the 23rd Amendment despite having no House seats and appearing nowhere in this table, so it is left out of both regressions entirely rather than patched in from a different, non-apportionment population source. All 50 states are used, not a sample — there is no sampling uncertainty in the ordinary sense; the confidence intervals here describe how much the fitted slope could plausibly differ under a different draw of the same underlying apportionment rule, cross-checked with a case-resampling bootstrap that agrees closely. This run measures the mechanical seat-and-elector math only: it says nothing about voter turnout, ballot access, or whether cast votes actually convert to electoral outcomes at the rate the seat counts imply.
apportionment_2020_527.csv · fit output (JSON).
| State | 2020 population | House seats | Electors | Pop. / elector | Pop. / senator |
|---|---|---|---|---|---|
| California | 39,576,757 | 52 | 54 | 732,903 | 19,788,378 |
| Texas | 29,183,290 | 38 | 40 | 729,582 | 14,591,645 |
| Florida | 21,570,527 | 28 | 30 | 719,018 | 10,785,264 |
| New York | 20,215,751 | 26 | 28 | 721,991 | 10,107,876 |
| Pennsylvania | 13,011,844 | 17 | 19 | 684,834 | 6,505,922 |
| Illinois | 12,822,739 | 17 | 19 | 674,881 | 6,411,370 |
| Ohio | 11,808,848 | 15 | 17 | 694,638 | 5,904,424 |
| Georgia | 10,725,274 | 14 | 16 | 670,330 | 5,362,637 |
| North Carolina | 10,453,948 | 14 | 16 | 653,372 | 5,226,974 |
| Michigan | 10,084,442 | 13 | 15 | 672,296 | 5,042,221 |
| New Jersey | 9,294,493 | 12 | 14 | 663,892 | 4,647,246 |
| Virginia | 8,654,542 | 11 | 13 | 665,734 | 4,327,271 |
| Washington | 7,715,946 | 10 | 12 | 642,996 | 3,857,973 |
| Arizona | 7,158,923 | 9 | 11 | 650,811 | 3,579,462 |
| Massachusetts | 7,033,469 | 9 | 11 | 639,406 | 3,516,734 |
| Tennessee | 6,916,897 | 9 | 11 | 628,809 | 3,458,448 |
| Indiana | 6,790,280 | 9 | 11 | 617,298 | 3,395,140 |
| Maryland | 6,185,278 | 8 | 10 | 618,528 | 3,092,639 |
| Missouri | 6,160,281 | 8 | 10 | 616,028 | 3,080,140 |
| Wisconsin | 5,897,473 | 8 | 10 | 589,747 | 2,948,736 |
| Colorado | 5,782,171 | 8 | 10 | 578,217 | 2,891,086 |
| Minnesota | 5,709,752 | 8 | 10 | 570,975 | 2,854,876 |
| South Carolina | 5,124,712 | 7 | 9 | 569,412 | 2,562,356 |
| Alabama | 5,030,053 | 7 | 9 | 558,895 | 2,515,026 |
| Louisiana | 4,661,468 | 6 | 8 | 582,684 | 2,330,734 |
| Kentucky | 4,509,342 | 6 | 8 | 563,668 | 2,254,671 |
| Oregon | 4,241,500 | 6 | 8 | 530,188 | 2,120,750 |
| Oklahoma | 3,963,516 | 5 | 7 | 566,217 | 1,981,758 |
| Connecticut | 3,608,298 | 5 | 7 | 515,471 | 1,804,149 |
| Utah | 3,275,252 | 4 | 6 | 545,875 | 1,637,626 |
| Iowa | 3,192,406 | 4 | 6 | 532,068 | 1,596,203 |
| Nevada | 3,108,462 | 4 | 6 | 518,077 | 1,554,231 |
| Arkansas | 3,013,756 | 4 | 6 | 502,293 | 1,506,878 |
| Mississippi | 2,963,914 | 4 | 6 | 493,986 | 1,481,957 |
| Kansas | 2,940,865 | 4 | 6 | 490,144 | 1,470,432 |
| New Mexico | 2,120,220 | 3 | 5 | 424,044 | 1,060,110 |
| Nebraska | 1,963,333 | 3 | 5 | 392,667 | 981,666 |
| Idaho | 1,841,377 | 2 | 4 | 460,344 | 920,688 |
| West Virginia | 1,795,045 | 2 | 4 | 448,761 | 897,522 |
| Hawaii | 1,460,137 | 2 | 4 | 365,034 | 730,068 |
| New Hampshire | 1,379,089 | 2 | 4 | 344,772 | 689,544 |
| Maine | 1,363,582 | 2 | 4 | 340,896 | 681,791 |
| Rhode Island | 1,098,163 | 2 | 4 | 274,541 | 549,082 |
| Montana | 1,085,407 | 2 | 4 | 271,352 | 542,704 |
| Delaware | 990,837 | 1 | 3 | 330,279 | 495,418 |
| South Dakota | 887,770 | 1 | 3 | 295,923 | 443,885 |
| North Dakota | 779,702 | 1 | 3 | 259,901 | 389,851 |
| Alaska | 736,081 | 1 | 3 | 245,360 | 368,040 |
| Vermont | 643,503 | 1 | 3 | 214,501 | 321,752 |
| Wyoming | 577,719 | 1 | 3 | 192,573 | 288,860 |
