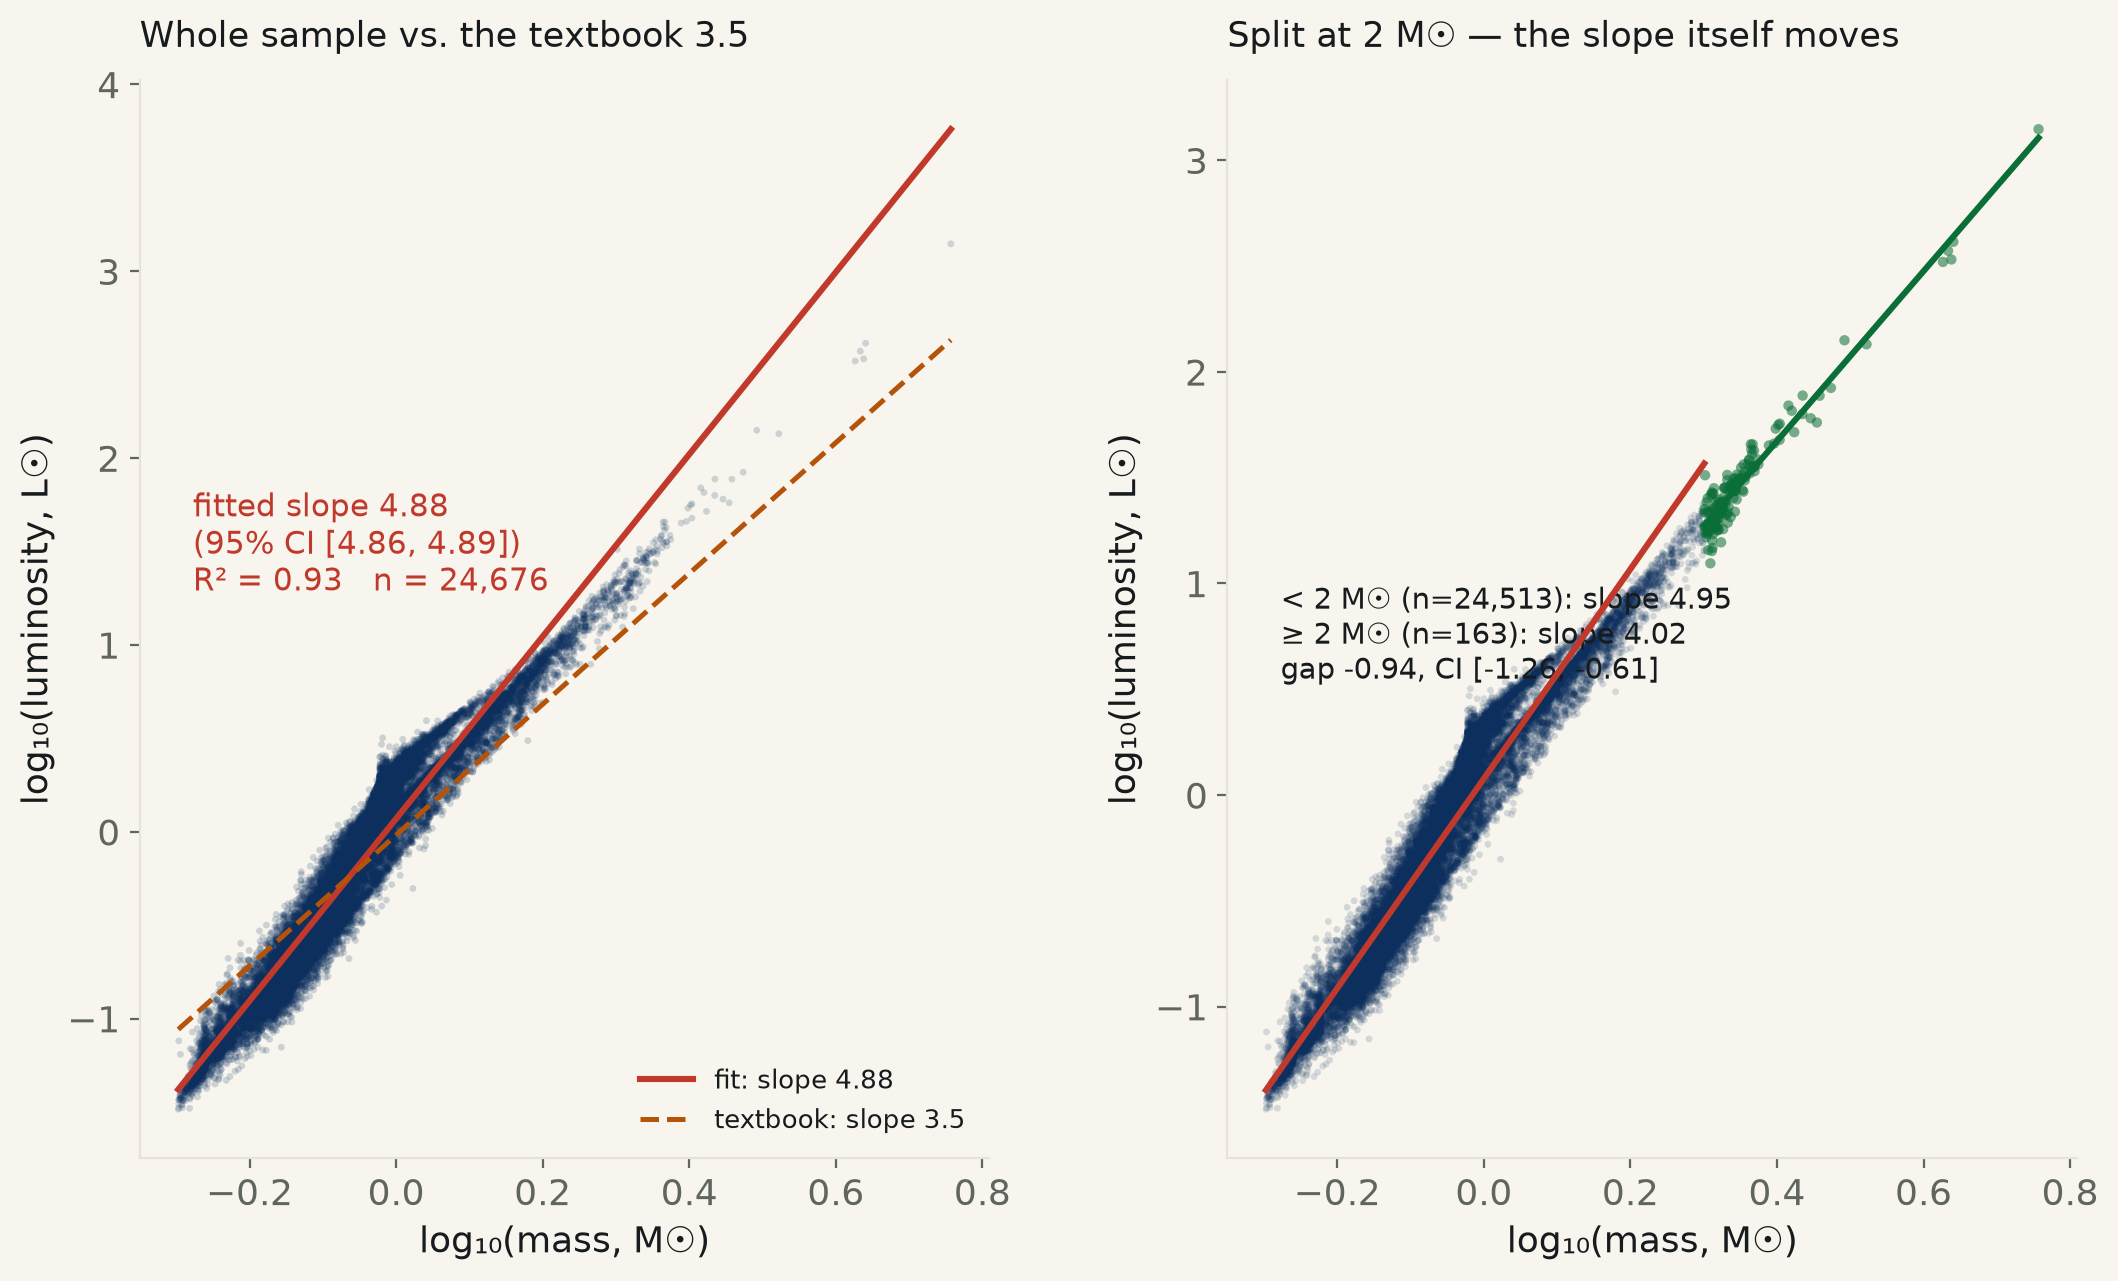
24,676 Gaia DR3 stars with FLAME-fitted mass and luminosity, best quality flag, dwarfs only (logg≥4.0). Whole sample: +4.88, 95% CI [+4.86, +4.89] — excludes both 3.5 and 4.0. Split at 2 M☉: +4.95 below it (n=24,513) vs +4.02 at or above (n=163) — an interaction test confirms the slope genuinely moves, -0.94, CI [-1.26, -0.61], excluding zero.
“Luminosity scales as mass to the 3.5” is one of the most quoted numbers in stellar astrophysics — the empirical mass-luminosity relation, L ∝ Mα, that appears in every intro textbook's treatment of main-sequence stars. It's rarely checked against a large, uniform, modern sample of the stars the rule is supposedly about. Gaia DR3's FLAME pipeline fits both mass and luminosity to every star with good enough photometry and parallax, so this run pulls 24,676 of them — quality-flagged to FLAME's own best bin, restricted to logg ≥ 4.0 (the standard dwarf/giant boundary, since the classic exponent describes main-sequence stars, not evolved giants), and down-sampled by a fixed modulus on Gaia's source ID (a deterministic, unbiased cut, not a selection on mass or luminosity) from the roughly 617,000 stars that pass the quality filter alone.
The whole-sample slope is real, and steeper than advertised. log₁₀(L) regressed on log₁₀(M) across all 24,676 stars: +4.88, 95% CI [+4.86, +4.89] (R²=0.93), agreeing almost exactly with a 4,000-draw bootstrap (CI [+4.86, +4.89]). That interval excludes not just the textbook 3.5 but also 4.0 — the exponent most often cited for solar-type stars specifically. Nearly 40% steeper than the number in circulation, on a sample two orders of magnitude larger than most textbook calibration sets.
Split the sample and the slope itself moves. Stars under 2 M☉ — 24,513 of the 24,676, essentially the whole thing, since this Gaia sample tops out at 5.7 M☉ and only 163 stars clear the 2 M☉ line at all — fit +4.95, CI [+4.93, +4.97]: essentially the whole-sample number, since they are essentially the whole sample. The 163 stars at or above 2 M☉ fit a visibly shallower +4.02, CI [+3.86, +4.17] — closer to the textbook figure, but its interval still excludes 3.5 outright; a bootstrap check puts the slope roughly split on whether it clears 4.0 at all (59% of 4,000 resamples land above 4.0, essentially a coin flip on that specific threshold, even as both the OLS and bootstrap intervals cleanly exclude 3.5). A formal interaction test, run on the full sample with a mass-regime indicator and its own slope term, confirms the two fitted slopes are not the same line by chance: -0.94 log-units, 95% CI [-1.26, -0.61] — excludes zero (p=2.3e-08). The exponent genuinely flattens as mass climbs past the Sun's; it does not flatten all the way to 3.5 within the mass range this pull actually covers.
Forcing the textbook number onto the data costs real fit quality. Pin the slope to exactly 3.5 and re-solve only for the intercept: the residual sum of squares is 1,110, more than double the 529 the freely-fit slope achieves on the identical 24,676 stars — not a rounding difference, a fit that is measurably worse by the desk's own numbers. The free fit's residuals are tight (std 0.146 dex, 84.6% of stars land within 50% of their predicted luminosity, 98.7% within a factor of two) — this is not a noisy relationship struggling to find any slope; it is a clean relationship whose actual slope is not 3.5.
Named check, and the sample's own bias. Set M=1 (a Sun-mass star) in the whole-sample fit and it predicts L=1.17 L☉ — the Sun's own true luminosity is 1 L☉ by definition, so this is a +17% miss on the one star in the universe whose mass and luminosity are not in dispute. That is not the Sun being an outlier; it is this sample's own selection speaking. Gaia's FLAME masses and luminosities are derived from photometry and parallax fit against stellar-evolution model grids, run on whichever stars have the cleanest astrometry and spectrophotometry — a mix skewed toward the sample's more numerous F/G-type field stars, not a magnitude-matched solar-twin census. Named plainly as a limit, not smoothed over: the sample's own median mass sits below one solar mass, and the fit is dominated by that population, not tuned to reproduce the Sun exactly.
| Specification | slope (dlogL/dlogM) | 95% CI (OLS) | 95% CI (bootstrap) | R² | verdict (vs. 3.5 / 4.0 / 0) |
|---|---|---|---|---|---|
| Whole sample (n=24,676) | +4.875 | [+4.859, +4.891] | [+4.856, +4.894] | 0.932 | excludes 3.5; excludes 4.0 |
| < 2 M☉ (n=24,513) | +4.952 | [+4.935, +4.969] | [+4.933, +4.970] | 0.930 | excludes 3.5; excludes 4.0 |
| ≥ 2 M☉ (n=163) | +4.016 | [+3.864, +4.169] | [+3.876, +4.199] | 0.944 | excludes 3.5; contains 4.0 |
| Interaction: does the slope differ between regimes? (n=24,676) | -0.935 | [-1.263, -0.607] | — | — | excludes 0 |
Bootstrap = 4,000-draw case resample. “Excludes 3.5 / 4.0 / 0” means the 95% CI does not contain that value. Forcing the whole-sample slope to exactly 3.5 (refitting only the intercept) gives RSS=1,110 vs. RSS=529 for the freely-fit slope on the identical 24,676 stars.
Method. Every row is pulled live from the ESA Gaia archive's own TAP sync endpoint, table gaiadr3.astrophysical_parameters: mass and luminosity as fitted by Gaia's FLAME pipeline (Fundamental parameters from a Bayesian evolutionary track fit to photometry, parallax and, where available, spectroscopy), restricted to flags_flame = '00' (FLAME's own best-quality bin, no flags raised), logg_gspphot ≥ 4.0 (the standard surface-gravity boundary separating main-sequence dwarfs from evolved giants and subgiants, computed independently by the GSP-Phot pipeline), and MOD(source_id, 50000) = 0 — a fixed-modulus down-sample of the roughly 617,000 stars that pass the quality and gravity cuts alone, to a checkable 24,676. Gaia's own source_id encodes HEALPix sky position plus a running counter, not any stellar property, so this is an unbiased, deterministic thinning, not a selection on mass or luminosity. The 2 M☉ split point is a round, literature-standard boundary near where several published multi-segment mass-luminosity calibrations place a break, fixed before the interaction test ran, not searched for in this data.
Limits, stated plainly. FLAME mass and luminosity are model-fitted quantities — the output of comparing a star's photometry and parallax against stellar-evolution model grids — not direct dynamical masses from binary-star orbits, the gold-standard calibration method for the classical mass-luminosity relation. This run cannot rule out that some of the steepness relative to 3.5 reflects a property of the FLAME model grid rather than the stars themselves; no independent, non-Gaia mass source was cross-matched in a day's pull. The sample is bounded 0.50–5.7 M☉ by what FLAME actually reports at this quality level — it contains essentially no low-mass M dwarfs and only 163 stars above 2 M☉, so the “high-mass” fit here is thin and does not reach the O/B-star regime (tens of solar masses) where the exponent is known to flatten further still. The quality and gravity cuts are also a selection: they favor stars bright and nearby enough for Gaia to resolve well, not a volume- or magnitude-complete census, which is the most likely reason the fit overpredicts the Sun's own luminosity by roughly a fifth at M=1.
gaia_mass_luminosity_526.csv (full 24,676-star pull) · fit output (JSON).
| Gaia source_id | mass (M☉) | luminosity (L☉) | Teff (K) | log g |
|---|---|---|---|---|
| 1315871674761200128 | 0.504 | 0.0327 | 3687 | 4.84 |
| 5647604955969599488 | 0.552 | 0.0581 | 3980 | 4.23 |
| 6746790299372000256 | 0.586 | 0.0684 | 3589 | 4.33 |
| 3847509498499999744 | 0.618 | 0.0735 | 4046 | 4.39 |
| 6453113187429199872 | 0.650 | 0.1135 | 4162 | 4.65 |
| 6648027015303199744 | 0.670 | 0.1186 | 4250 | 4.66 |
| 537945547180000000 | 0.684 | 0.1236 | 4311 | 4.67 |
| 4114836917369600000 | 0.696 | 0.1868 | 4259 | 4.82 |
| 5544190699066000384 | 0.707 | 0.1642 | 4431 | 4.51 |
| 6122939260176799744 | 0.715 | 0.1719 | 4475 | 4.63 |
| 4040709492960000000 | 0.725 | 0.2168 | 4477 | 4.66 |
| 6355183500673999872 | 0.736 | 0.2288 | 4503 | 4.43 |
| 3044202729838400000 | 0.749 | 0.2081 | 4646 | 4.74 |
| 5947809112532799488 | 0.762 | 0.2461 | 4731 | 4.72 |
| 2706347781853199872 | 0.773 | 0.3173 | 4660 | 4.47 |
| 2225023376954400000 | 0.786 | 0.3392 | 4908 | 4.74 |
| 5538437848067200000 | 0.797 | 0.5257 | 5060 | 4.66 |
| 3396493363545999872 | 0.810 | 0.5590 | 5125 | 4.64 |
| 5337931006400000000 | 0.823 | 0.3901 | 5067 | 4.63 |
| 6724656481788800000 | 0.836 | 0.4667 | 5097 | 4.64 |
| 1775373453911600128 | 0.849 | 0.5276 | 5176 | 4.58 |
| 6075554226048400384 | 0.862 | 0.5957 | 4880 | 4.71 |
| 4037496479196400128 | 0.875 | 0.8058 | 5467 | 4.40 |
| 6386621729271199744 | 0.891 | 0.7915 | 5516 | 4.42 |
| 2939271490477599744 | 0.908 | 1.1290 | 5557 | 4.53 |
| 248875904356400000 | 0.926 | 1.1448 | 5364 | 4.60 |
| 3049192829003599872 | 0.939 | 0.8107 | 5600 | 4.48 |
| 5529703052817600512 | 0.949 | 1.1921 | 4958 | 4.34 |
| 5944785391134000128 | 0.958 | 1.7391 | 5215 | 4.39 |
| 156361960904400000 | 0.971 | 1.5166 | 5812 | 4.60 |
| 2307994070570399744 | 0.990 | 0.7828 | 5658 | 4.48 |
| 5215538805132399616 | 1.015 | 1.7217 | 5841 | 4.17 |
| 4123081403547599872 | 1.046 | 2.5608 | 5560 | 4.16 |
| 928740743085600000 | 1.086 | 1.9928 | 5971 | 4.16 |
| 5248957907005200384 | 1.135 | 1.4256 | 6200 | 4.40 |
| 1783550624967200000 | 1.206 | 2.2032 | 6309 | 4.46 |
| 5231110294970800128 | 1.293 | 3.5702 | 6454 | 4.31 |
| 2035532065587599872 | 1.403 | 5.1640 | 6568 | 4.08 |
| 2081333596805199872 | 1.588 | 8.5747 | 6956 | 4.08 |
| 468612169299600000 | 5.714 | 1402.4729 | 16778 | 4.02 |
gaiadr3.astrophysical_parameters (FLAME pipeline masses/luminosities, GSP-Phot surface gravity), TAP sync endpoint — keyless.
