55 Congresses of the Senate's own Rule XXII cloture count, 1917–2026. Motions filed grew 5.87%/yr compounding, 95% CI [5.30%, 6.44%] — excludes zero, the folklore holds. But a formal test finds no confirmed change in that growth rate since 1971's one-time level jump, and growth since the 2013 “nuclear option” can't clear zero at all. What did change: cloture's own success rate, from 20% in 1975 to 88% in 2025 — excludes zero.
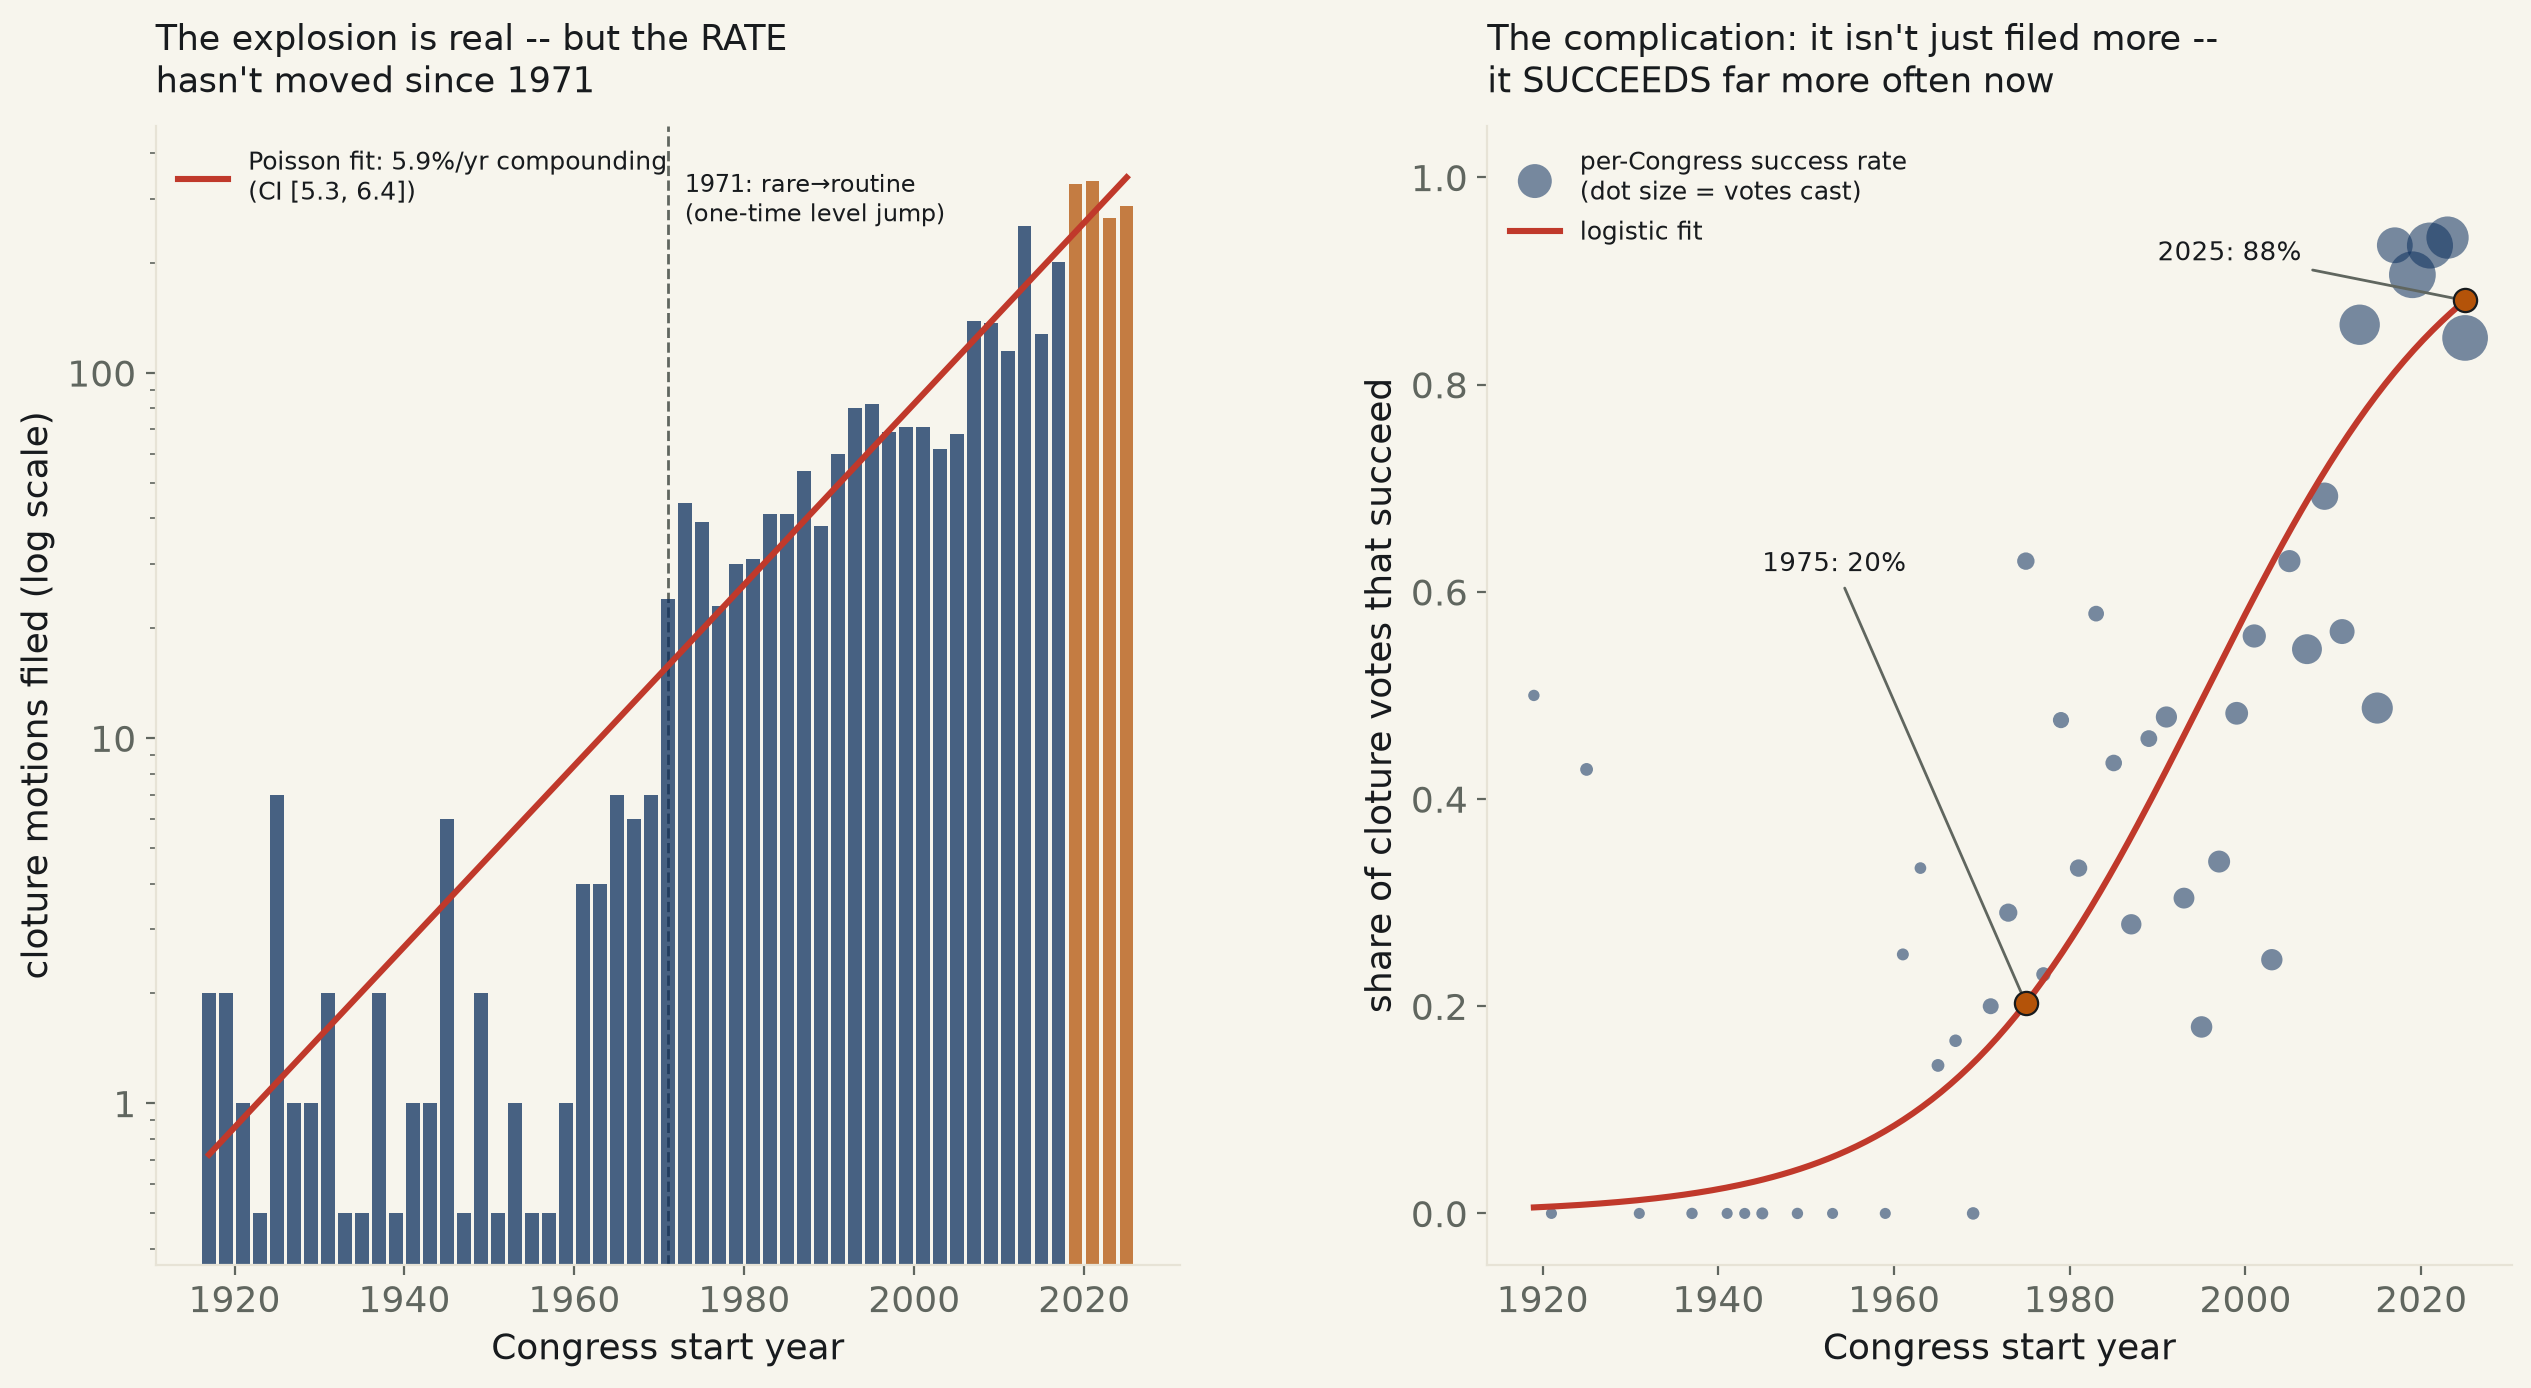
“The filibuster has exploded” is one of the most confidently repeated claims about the modern Senate, and Rule XXII — adopted in 1917, the mechanism that ends unlimited debate by cloture — is unusual among Senate folklore in having a clean, official paper trail: the Senate's own historical office publishes every cloture motion filed, every vote taken, and every cloture actually invoked, one row per Congress, back to the rule's first year. 55 Congresses, 1917–2026, no gaps, no synthetic rows.
The raw claim holds, decisively. A plain linear fit across all 55 Congresses: +2.16 more motions filed per year, 95% CI [+1.69, +2.62], R²=0.619, p=1.0e-12 — excludes zero by a wide margin. But “motions per Congress” is a count that sat at 0–2 for the record's first half-century and then grew multiplicatively, which a straight line through raw counts badly misrepresents (it predicts negative motions before 1965). The model that actually fits a zero-heavy, compounding count series is a Poisson trend in log space, and it says the same thing more precisely: 5.87% per year, compounding, for the full 108-year record (95% CI [5.30%, 6.44%], pseudo-R²=0.903, a 4,000-draw bootstrap agreeing at 100% of resamples positive).
What hasn't moved: the rate itself. The record's real discontinuity sits at 1971, when filing went from a once-a-Congress rarity to a routine double-digit occurrence — a genuine, statistically sharp level jump (Poisson level coefficient +1.59, p=4.4e-06). What did not demonstrably change at that same point is the compounding rate: pre-1971 Congresses grew filings at 2.7%/year on their own trend; since 1971 the rate is 5.21%/year (CI [4.55%, 5.88%]) — nearly double the pre-1971 point estimate, but a formal interaction test on that gap returns +0.0239 log-units/yr, 95% CI [-0.0053, +0.0531], p=0.108 — contains zero. This run cannot confirm the Senate's underlying rate of escalation actually accelerated in 1971; what is confirmed is a one-time regime change (rare→routine) followed by a remarkably stable compounding rate for over fifty years.
And very recently, growth itself goes quiet. Restrict the same Poisson trend to the 14-Congress span since 2013 — the year Senate Democrats lowered the cloture threshold from 60 to a simple majority for most executive and judicial nominations (extended to Supreme Court nominees in 2017) — and the growth rate is +3.65%/year, 95% CI [-0.35%, +7.81%], p=0.074: contains zero, a near-miss a 4,000-draw bootstrap puts at 97.5% positive resamples — short of the desk's 95% bar, reported as a genuine disagreement between methods rather than rounded up. Concretely, the last four Congresses filed 328 (2019), 336 (2021), 266 (2023), and 286 (2025) motions — a peak, a drop, and a partial rebound, not a continued climb. Seven Congresses (n=7) is too thin a slice to certify a plateau, but the arithmetic will not certify continued exponential growth either.
The real complication is what changed instead: cloture stopped failing. Restricting to the 44 Congresses where at least one cloture vote actually happened, the share of votes that succeed climbs steeply with year (binomial/logistic trend, log-odds +0.0675/yr, 95% CI [+0.0477, +0.0873], p=2.4e-11 — excludes zero comfortably, bootstrap 100% positive) — from a predicted 20% success rate in 1975 to 88% in 2025. The table doesn't split cloture on legislation from cloture on nominations, so this run cannot directly attribute the jump to the 2013/2017 threshold changes — but the direction is exactly what a lower bar predicts, and it reframes the whole story: today's cloture explosion is not measuring escalating obstruction that keeps failing against a fixed supermajority wall. It is measuring a tool that, once filed, now succeeds almost every time.
| Specification | coefficient (varies, see row) | 95% CI | pseudo-R² | p | verdict |
|---|---|---|---|---|---|
| Full history, plain OLS on raw counts (n=55) | +2.156 | [+1.690, +2.621] | 0.6195 | 1.04e-12 | excludes 0 |
| Full history, Poisson exponential trend (n=55) | +5.87% | [+5.299, +6.442] | 0.9025 | 3.48e-95 | excludes 0 |
| Since 1971 only, Poisson (n=28) | +5.21% | [+4.551, +5.880] | 0.8177 | 4.57e-56 | excludes 0 |
| Era interaction: did the RATE change after 1971? (n=55) | +0.0239 | [-0.005, +0.053] | — | 0.1082 | contains 0 |
| Since 2013 (post-nuclear-option), Poisson (n=7) | +3.65% | [-0.352, +7.810] | 0.1953 | 0.0743 | contains 0 |
| Specification | coefficient (log-odds/yr) | 95% CI | p | verdict |
|---|---|---|---|---|
| Cloture success rate given a vote occurs, binomial/logistic trend (n=44) | +0.0675 | [+0.0477, +0.0873] | 2.45e-11 | excludes 0 |
HC3 = heteroskedasticity-robust standard errors (all Poisson/binomial fits). Pseudo-R² = McFadden's (1 − log-likelihood ratio vs. intercept-only). Bootstrap = 4,000-draw case resample of Congresses. "Excludes 0" means the 95% CI does not contain zero.
Method. Every row comes from the Senate's own historical office table at senate.gov/legislative/cloture/clotureCounts.htm: Congress number, motions filed, votes on cloture, and cloture invoked, 65th Congress (1917–18, the Congress that adopted Rule XXII) through the sitting 119th (2025–26). The page's own running-total footer row is dropped before fitting. Motions filed is modeled two ways: a plain OLS line on the raw counts (the naive, commonly-seen version of this claim) and a Poisson GLM in log space (the model actually suited to a non-negative, zero-heavy count that grows multiplicatively), both with HC3 robust standard errors since consecutive Congresses are plausibly not independent draws. The 1971 era boundary is the data's own first year of sustained double-digit filing, fixed before any interaction test ran; the 2013 boundary is the well-documented date of the Senate's first "nuclear option" (54-45 vote lowering the cloture threshold for most executive and judicial nominations from 60 to a simple majority), extended to Supreme Court nominees in April 2017 — both boundaries are public Senate history, not fit to the data. Cloture success rate is modeled as a binomial GLM (successes = cloture invoked, trials = votes on cloture) restricted to the 44 Congresses where at least one vote actually occurred.
Limits, stated plainly. n=55 (44 for the success-rate fit) Congresses is a real ceiling; each Congress spans two years of decisions by 100 senators under changing rules and party control, not independent trials, and HC3 corrects for heteroskedasticity but not for whatever serial correlation exists between one Congress's total and the next's. The senate.gov table does not distinguish cloture on legislation from cloture on nominations, so the success-rate climb is reported as consistent with, not proven to be caused by, the 2013/2017 threshold changes — no motion-level breakdown was reachable in a day. The since-2013 plateau rests on n=7 Congresses, thin enough that both "growth stopped" and "growth continues at a slower pace" remain live readings; this run reports the interval it got (contains zero) rather than picking one. Nothing here measures whether cloture reflects genuine minority obstruction, routine "filling the amendment tree" procedure, or some mix of both — only how often it is filed and how often it succeeds.
