130 months of Bitcoin, the S&P 500, real gold futures, and CPI inflation, 2015-09-30–2026-07-31. Bitcoin's monthly return tracks the stock market’s: +1.49 per unit of S&P return, 95% CI [+0.76, +2.22] — excludes zero. Gold, on the identical months, shows no such tie (CI [-0.06, +0.28], contains zero). And against inflation, Bitcoin doesn’t sit out or hedge — it runs the wrong way, -2.47 points of return per point of CPI inflation, CI excluding zero on the losing side; gold’s identical test contains zero.
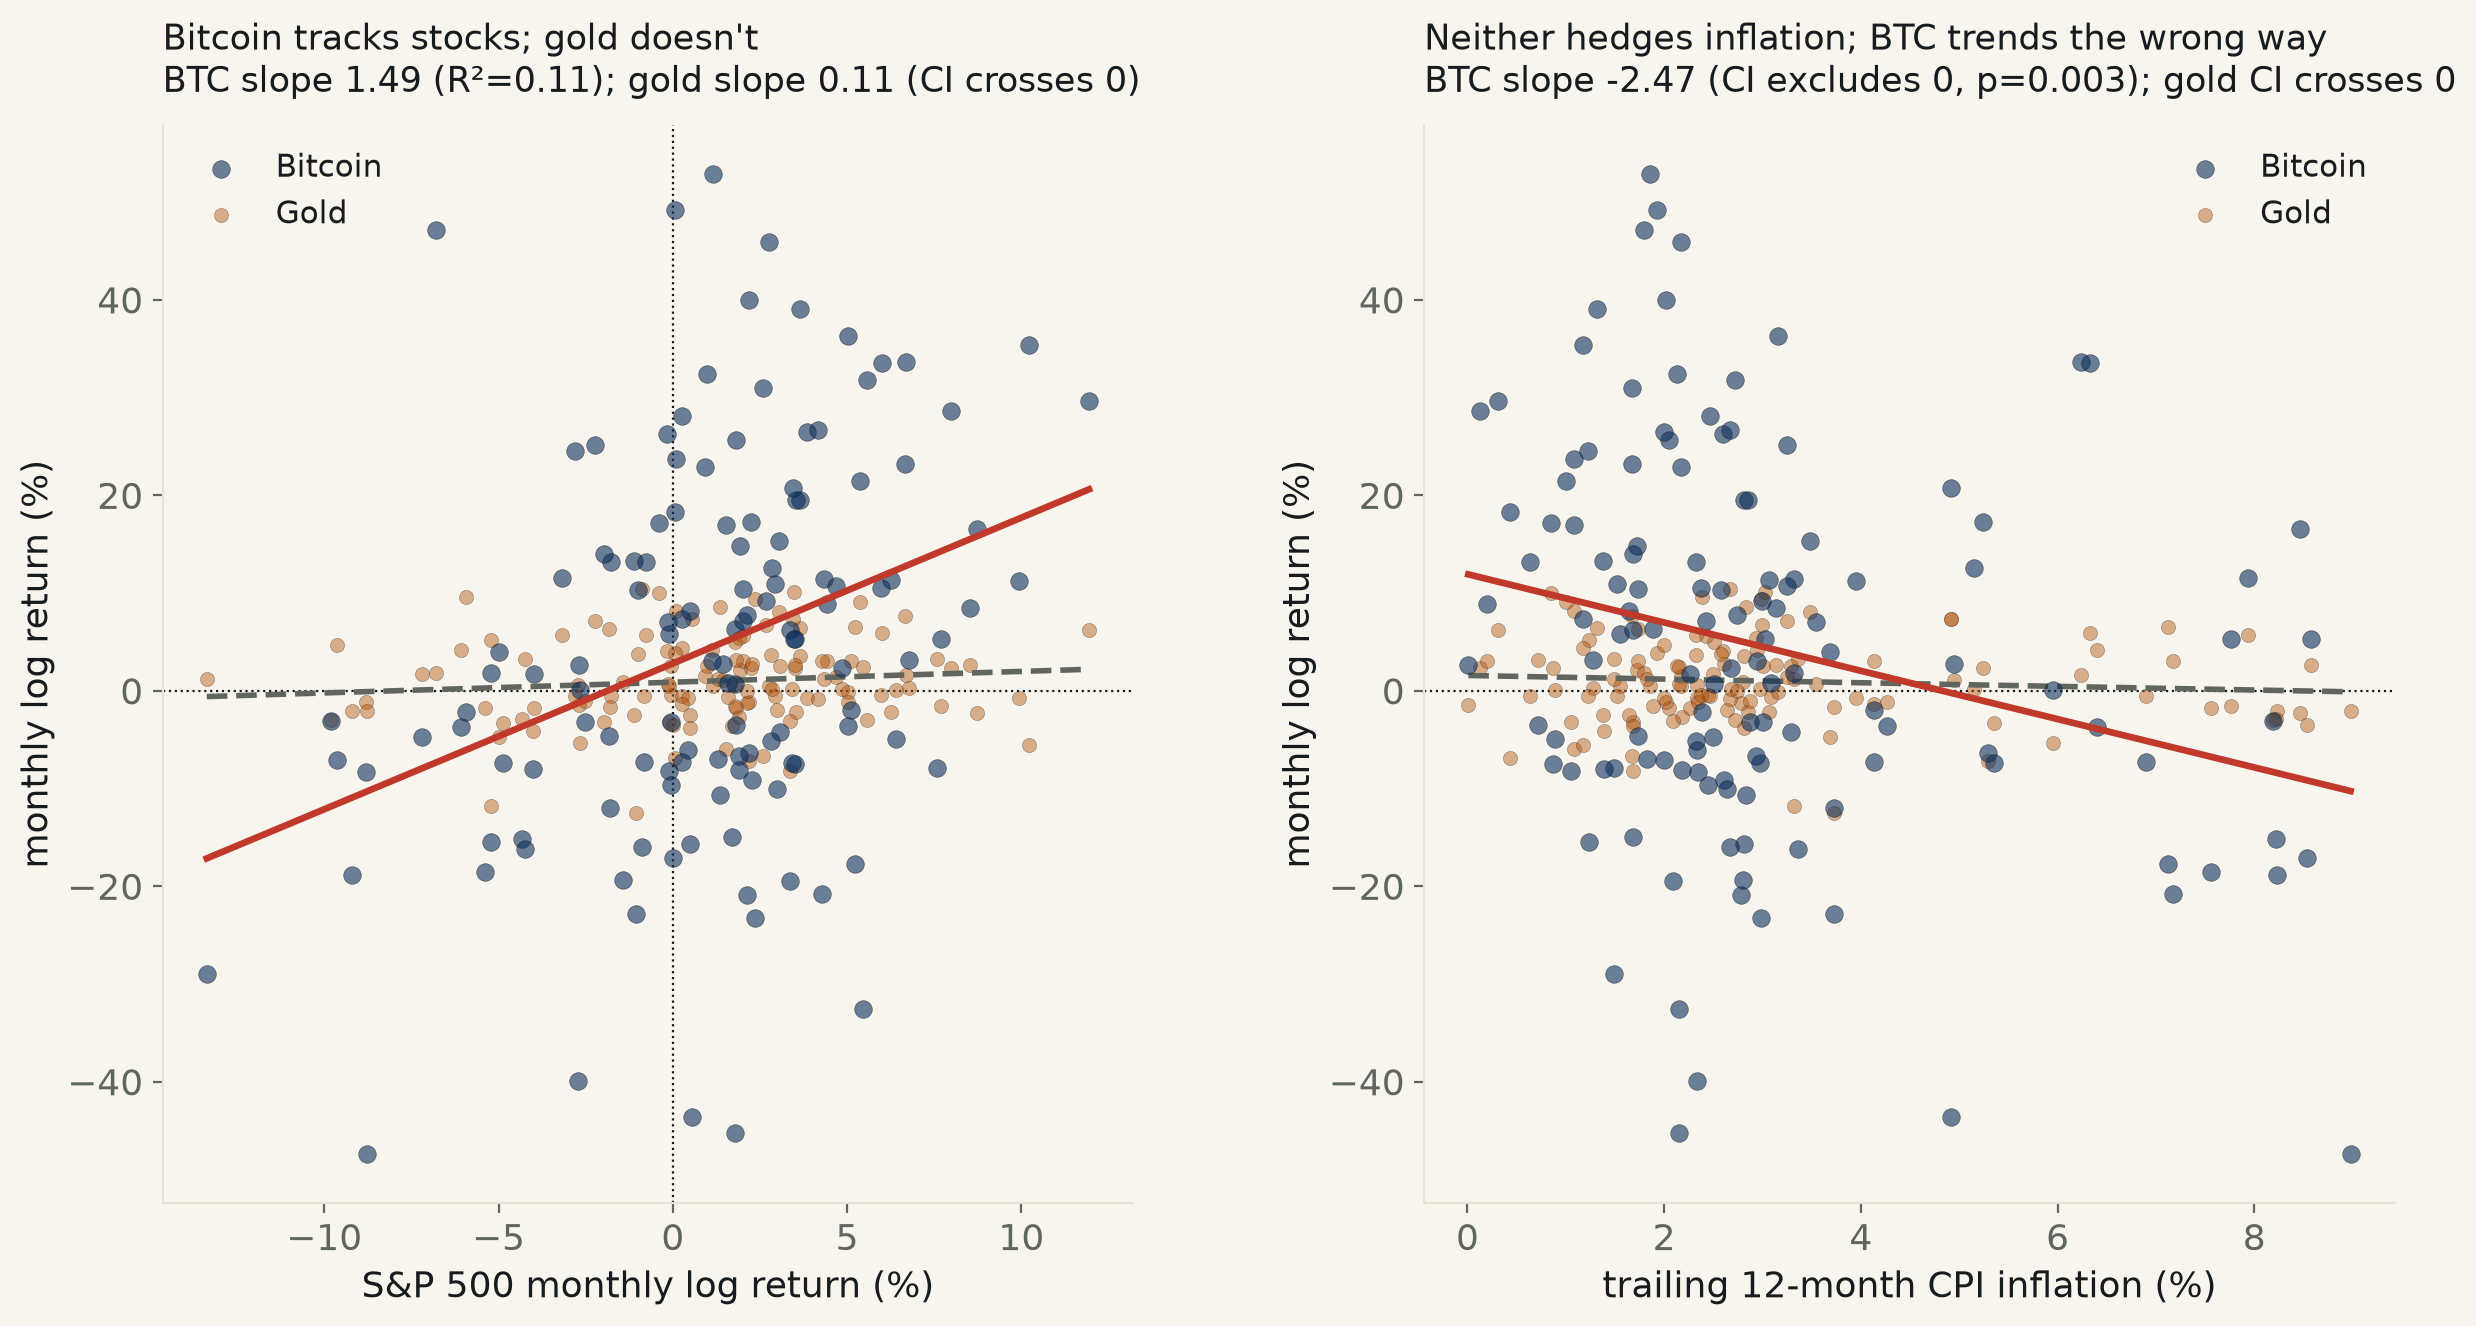
"Digital gold" is a claim with two separate parts, and this run keeps them apart on purpose: that Bitcoin should behave as a safe haven, moving independently of the stock market's swings, and that it should behave as an inflation hedge, holding or gaining value as prices rise. Real gold (COMEX futures, ticker GC=F) is fitted on the identical 130 months as the literal benchmark the label invokes — not just asserted about, measured against, on the same window BTC-USD's own Yahoo Finance history sets: 2015-09-30 to 2026-07-31. Inflation is measured as trailing 12-month CPI-U percent change, to avoid manufacturing a spurious relationship out of two things that have both simply trended for a decade.
The safe-haven half fails outright. Bitcoin's monthly return moves with the S&P 500's: slope +1.492 log-return units of BTC per unit of S&P return, 95% CI [+0.759, +2.225], R²=0.112, p=9.6e-05 — a Newey-West check agrees (HAC CI [+0.868, +2.116]), and a 4,000-draw bootstrap puts 100.0% of resampled slopes above zero. Gold, on the identical months, shows no such relationship: slope +0.110, CI [-0.061, +0.282] — contains zero on both HC3 (p=0.21) and HAC (p=0.10), and its own bootstrap only reaches 91.7% positive, short of the desk's 95% bar. Bitcoin correlates with equities the way a leveraged equity position would; gold, over the same eleven years, does not.
The inflation-hedge half doesn't just fail to appear — it runs backward. Bitcoin's return against trailing CPI inflation: slope -2.47 points of BTC return per point of inflation, 95% CI [-4.06, -0.88] — excludes zero (p=0.0025, HAC p=0.0003) in the negative direction: hotter inflation months have gone with worse Bitcoin returns, the opposite of what a hedge should do. Gold's identical test contains zero (-0.19, CI [-0.55, +0.18], p=0.31) — not a confirmed hedge either, on this particular decade of monthly data, but at least not measurably wrong-signed. Concrete case, the hottest inflation print in the sample: 2022-06, CPI running 9.0% year over year — Bitcoin fell -47.4% that month, more than five times the S&P's own -8.8% decline, while gold moved only -2.1%.
One robustness question worth asking directly: has Bitcoin's correlation with stocks strengthened as institutional adoption grew? Split mechanically at the sample's own median month (2021-02-14), not cherry-picked: the early half's BTC–S&P slope is +1.163 (CI [-0.033, +2.358], p=0.056 — contains zero on OLS, though a HAC check clears it at p=0.014); the late half is +1.831 (CI [+0.984, +2.677], p=5.6e-05 — excludes zero comfortably). The point estimate moved the direction the "Bitcoin is becoming a mainstream risk asset" story predicts, nearly 60% larger — but a formal interaction test on the gap between the two eras returns +0.668, 95% CI [-0.779, +2.116], p=0.363: contains zero. This run cannot confirm the correlation actually strengthened at conventional significance — only that the later half, considered alone, is where the relationship is unambiguous.
| Specification | coefficient | 95% CI | R² | p | verdict |
|---|---|---|---|---|---|
| Bitcoin vs S&P 500, monthly return, HC3 (n=130) | +1.492 | [+0.759, +2.225] | 0.1125 | 0.0001 | excludes 0 |
| Bitcoin vs S&P 500, Newey-West HAC(3) (n=130) | +1.492 | [+0.868, +2.116] | 0.1125 | 0.0000 | excludes 0 |
| Gold vs S&P 500, monthly return, HC3 (n=130) | +0.110 | [-0.061, +0.282] | 0.0125 | 0.2056 | contains 0 |
| Gold vs S&P 500, Newey-West HAC(3) (n=130) | +0.110 | [-0.020, +0.240] | 0.0125 | 0.0971 | contains 0 |
| Bitcoin vs trailing 12mo CPI inflation, HC3 (n=130) | -0.0247 | [-0.041, -0.009] | 0.0689 | 0.0025 | excludes 0 |
| Bitcoin vs trailing 12mo CPI inflation, Newey-West HAC(3) (n=130) | -0.0247 | [-0.038, -0.011] | 0.0689 | 0.0003 | excludes 0 |
| Gold vs trailing 12mo CPI inflation, HC3 (n=130) | -0.0019 | [-0.005, +0.002] | 0.0079 | 0.3139 | contains 0 |
| Gold vs trailing 12mo CPI inflation, Newey-West HAC(3) (n=130) | -0.0019 | [-0.005, +0.001] | 0.0079 | 0.2765 | contains 0 |
| Bitcoin vs S&P, early half, 2015-09–2021-02, HC3 (n=65) | +1.163 | [-0.033, +2.358] | 0.0565 | 0.0565 | contains 0 |
| Bitcoin vs S&P, late half, 2021-02–2026-07, HC3 (n=65) | +1.831 | [+0.984, +2.677] | 0.2287 | 0.0001 | excludes 0 |
| Era interaction (late minus early slope), HC3 (n=130) | +0.668 | [-0.779, +2.116] | — | 0.3627 | contains 0 |
HC3 = heteroskedasticity-robust standard errors. HAC = Newey-West heteroskedasticity-and-autocorrelation-consistent standard errors, 3-month bandwidth. Bootstrap = 4,000-draw case resample. "Excludes 0" means the 95% CI does not contain zero.
Method. Bitcoin (BTC-USD), the S&P 500 (^GSPC), and COMEX gold futures (GC=F) pulled daily from Yahoo Finance via yfinance, resampled to the last trading day of each calendar month; CPI-U (CPIAUCSL) pulled from FRED's keyless CSV endpoint, the same pull pattern used on runs 028/110/501/522/523. The window is set by BTC-USD's own Yahoo Finance history, which begins 2014-09-17; the first 12 months are dropped because trailing 12-month CPI inflation needs a prior year to compute, leaving 130 fitted months. All three assets' monthly returns are natural-log differences of month-end closing price. The era split for the strengthening-correlation check falls at the sample's own median month, fixed mechanically before any regression ran, not chosen to flatter either half.
Limits, stated plainly. Eleven years is Bitcoin's entire tradable history on this exchange series, not a design choice — it is a real ceiling on how much this run can say about behavior across multiple full monetary or business cycles, and contains at most one clear Fed hiking-and-cutting cycle. Trailing 12-month CPI is the realized inflation rate, not the unexpected or surprise inflation component that monetary theory says a hedge should be tested against (markets price in expected inflation ahead of time); no consensus-forecast inflation-surprise series was reachable keylessly in a day, so this run tests the coarser, more commonly cited number instead and says so. Nothing here identifies a causal mechanism for Bitcoin's stock-market correlation, only that it exists and is measurable; the era-strengthening question is reported as a real point-estimate movement that the desk's own interaction test cannot confirm at conventional significance, not as a confirmed trend.
yfinance ·
FRED CPIAUCSL (CPI-U, BLS original) — all keyless endpoints.
