78 years of FRED's own federal deficit, CPI, unemployment, and M2 money-stock series, 1948–2025. The deficit itself, against same-year inflation: +0.014, 95% CI [-0.150, +0.179] — contains zero, and stays there at every lag, control, and era split tried. The actual "printing money" mechanism, M2 growth, does clear zero — but only a year later, and it explains about a tenth of the variance.
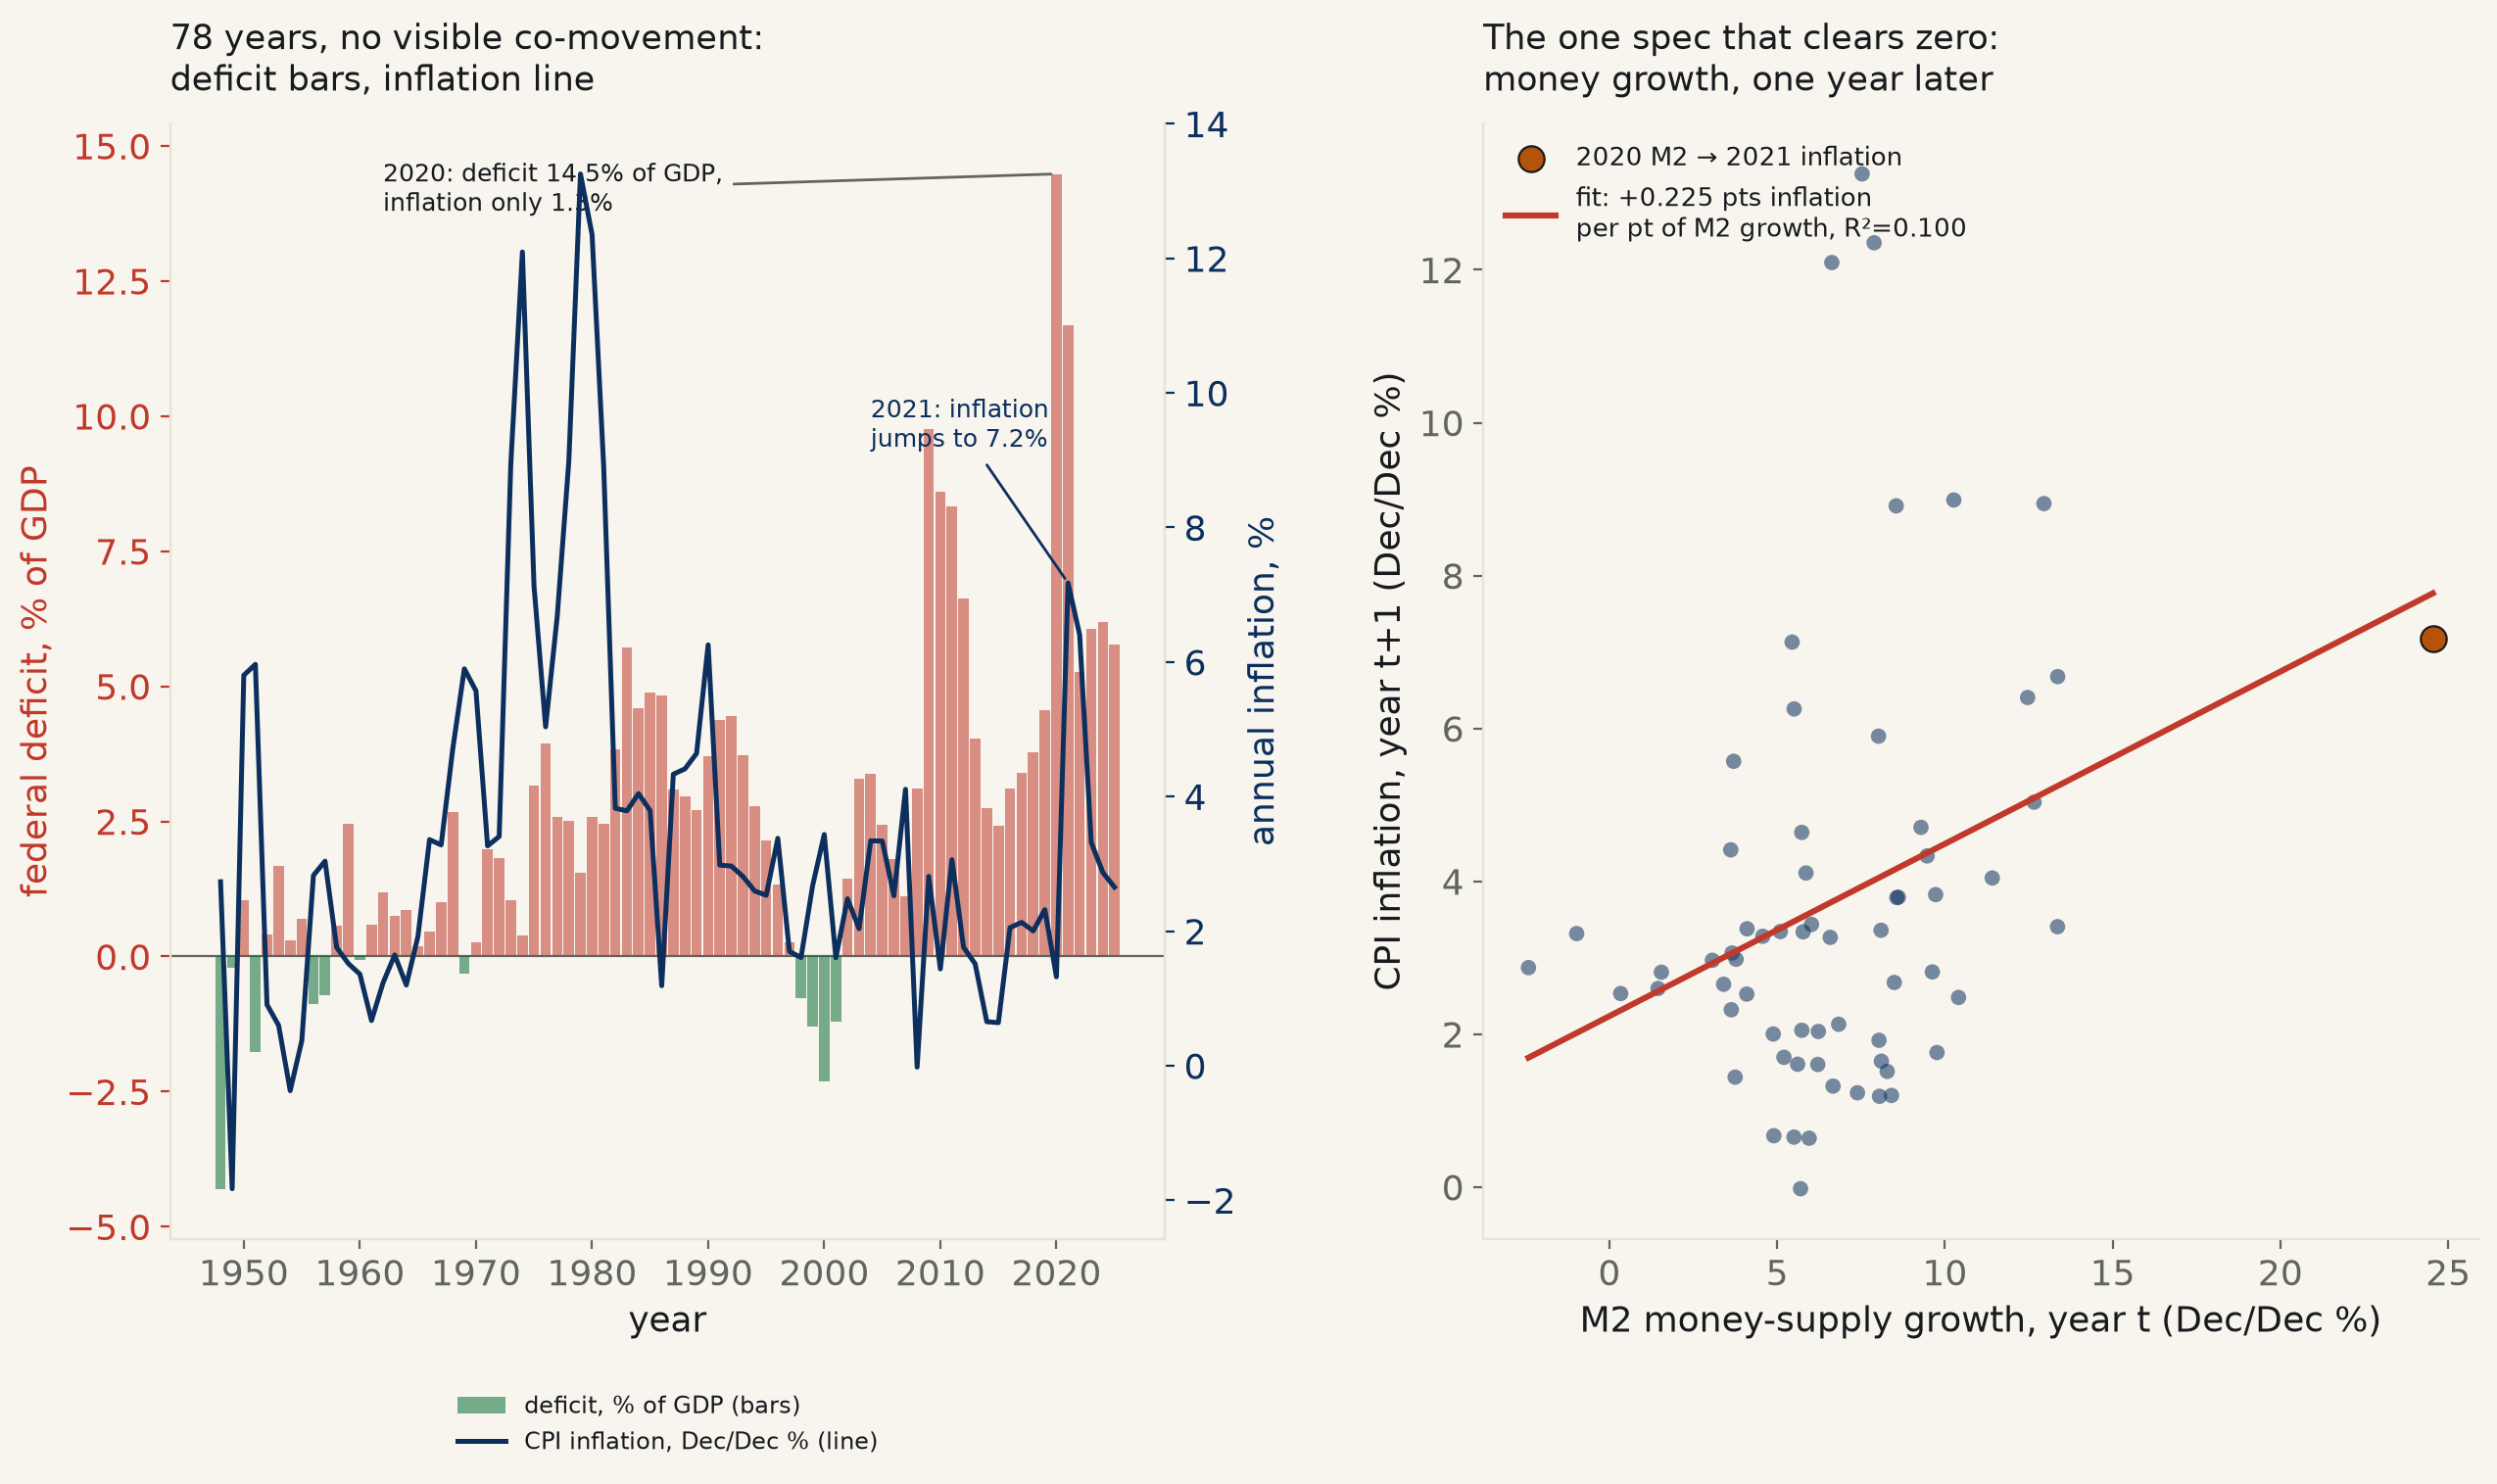
The claim comes in two flavors that get run together: that a big federal deficit itself pushes prices up, and the more specific "the government is printing money" story, which is really a claim about the money supply, not the budget line. They are not the same transaction — a deficit financed by selling bonds to savers moves no new money into circulation; one financed by the central bank buying those bonds does. This run tests both, separately, on FRED's own keyless series: the federal deficit as a percent of GDP (FYFSGDA188S), CPI-U inflation (CPIAUCSL, measured Dec-over-Dec, the common "inflation for the year" convention), the unemployment rate (UNRATE, the business-cycle confound), and M2 money-stock growth (M2SL) — 78 years of deficit/inflation data, 1948–2025, and 66 years of M2 data, 1960–2025.
The deficit itself cannot clear zero, at any horizon or control tried. Same-year: +0.014 points of inflation per point of deficit/GDP (95% CI [-0.150, +0.179], R²=0.0002, p=0.86) — a flat line, confirmed by Spearman rank correlation (ρ=0.109, p=0.34) so the null isn't an artifact of the linear assumption. Giving the deficit a year, or two years, to show up in prices doesn't help: +1-year lag +0.138 (CI [-0.058, +0.334], p=0.17), +2-year lag +0.050 (CI [-0.133, +0.233], p=0.59). Controlling for unemployment — the obvious confound, since recessions widen deficits through automatic stabilizers and usually bring disinflation with them — flips the point estimate negative but the interval only grows: -0.032 (CI [-0.298, +0.234], p=0.81). Splitting at 1971, when the last formal link between the dollar and gold ended, finds no era where the relationship is any different: pre-1971 -0.208 (p=0.51), post-1971 -0.135 (p=0.32), and a formal interaction test on the gap between them contains zero by a wide margin (p=0.83).
The money-supply channel the deficit claim is usually gesturing at is real — but it shows up a year late, not the same year. M2 growth in the same calendar year as inflation also contains zero (+0.032, CI [-0.110, +0.173], p=0.66). Shift M2 growth forward one year and it clears zero cleanly: +0.225 points of next year's inflation per point of this year's M2 growth (95% CI [+0.135, +0.316], p=1.04e-06, R²=0.100) — a 4,000-draw bootstrap agrees almost exactly (CI [+0.129, +0.364], 100% of resamples positive) and a Spearman check, independent of the linear-model assumption, agrees too (ρ=0.295, p=0.017). It is not just 2020 driving it: dropping that single year, the relationship survives at +0.241 (CI [+0.095, +0.388], p=0.0012). A two-year lag is, if anything, a little stronger: +0.284 (CI [+0.084, +0.485], R²=0.160, p=0.0054). This is the textbook Friedman shape — monetary policy works "with a lag that is both long and variable" — not a same-year mechanical translation of dollars printed into prices paid.
The concrete case is 2020–21, and it illustrates exactly why the two claims need to be kept separate. The federal deficit hit a record 14.5% of GDP in 2020, and that year's inflation was ordinary, 1.3% — if the deficit number itself were the mechanism, this is the year it should have shown up most. It didn't. What also hit a record in 2020 was M2 growth, 24.5%, the Federal Reserve's own pandemic-era balance-sheet expansion running alongside the fiscal deficit but conceptually distinct from it — and that number's effect landed on schedule, one year later: inflation reached 7.2% in 2021. For contrast, the 2009 deficit was almost as large by historical standards (9.8% of GDP, financed with comparatively modest and gradual Fed asset purchases at the time) and produced nothing unusual in prices at all (2.8%). Same-sized deficit, two different monetary responses, two different outcomes — the deficit line predicts neither.
| Specification | coefficient | 95% CI | R² | p | verdict |
|---|---|---|---|---|---|
| Contemporaneous, deficit → same-year inflation, HAC(2) (n=78) | +0.014 | [-0.150, +0.179] | 0.0002 | 0.8630 | contains 0 |
| +1-year lag, deficit → next year's inflation, HAC(2) (n=77) | +0.138 | [-0.058, +0.334] | 0.0217 | 0.1690 | contains 0 |
| +2-year lag, deficit → inflation two years later, HAC(2) (n=76) | +0.050 | [-0.133, +0.233] | 0.0030 | 0.5908 | contains 0 |
| Unemployment-controlled, contemporaneous, HAC(2) (n=78) | -0.032 | [-0.298, +0.234] | 0.0067 | 0.8145 | contains 0 |
| Pre-1971 era only, HC3 (n=23) | -0.208 | [-0.819, +0.404] | 0.0191 | 0.5058 | contains 0 |
| Post-1971 era only, HC3 (n=55) | -0.135 | [-0.401, +0.130] | 0.0191 | 0.3172 | contains 0 |
| Era interaction (post-1971 minus pre-1971 slope), HC3 (n=78) | +0.072 | [-0.594, +0.739] | — | 0.8318 | contains 0 |
| M2 growth, contemporaneous, HAC(2) (n=66) | +0.032 | [-0.110, +0.173] | 0.0019 | 0.6633 | contains 0 |
| M2 growth, +1-year lag, HAC(2) (n=65) | +0.225 | [+0.135, +0.316] | 0.0999 | 0.0000 | excludes 0 |
| M2 growth, +1-year lag, excl. 2020, HAC(2) (n=64) | +0.241 | [+0.095, +0.388] | 0.0796 | 0.0012 | excludes 0 |
| M2 growth, +2-year lag, HAC(2) (n=64) | +0.284 | [+0.084, +0.485] | 0.1602 | 0.0054 | excludes 0 |
HAC = Newey-West heteroskedasticity-and-autocorrelation-consistent standard errors, 2-year bandwidth. HC3 = heteroskedasticity-robust standard errors. Bootstrap = 4,000-draw case resample. "Excludes 0" means the 95% CI does not contain zero.
Method. All four series pulled from FRED's keyless CSV endpoint (fred.stlouisfed.org/graph/fredgraph.csv?id=<SERIES>), the same pull pattern used for runs 028, 110, 501, and 522: FYFSGDA188S (federal surplus/deficit as % of GDP, annual since 1929, sign-flipped here so positive = a bigger deficit), CPIAUCSL (CPI-U, monthly since 1947), UNRATE (civilian unemployment rate, monthly since 1948), M2SL (M2 money stock, monthly since 1959). Annual inflation and M2 growth are both December-over-December percent change, the common "headline inflation for the year" convention; unemployment is the calendar-year average. The four series inner-join to 78 years, 1948–2025 (M2 growth is only defined from 1960 onward, 66 years, since it needs a prior December to compute a change from). The era split falls at 1971, the year the US left the last remnant of the Bretton Woods gold link (the "Nixon shock"), on the theory that deficit financing works differently once the currency floats freely.
Limits, stated plainly. FYFSGDA188S is a fiscal-year figure (Oct–Sep for the modern era; earlier fiscal years ran on other calendars), dated by FRED to January 1 of the fiscal year it covers, matched here against calendar-year inflation — a real mismatch, not patched, that blurs the timing of any true effect by up to several months. n=78 (66 for the M2 specifications) is a real ceiling: annual data since 1948 gives roughly 78 independent business-cycle-scale observations, not enough to rule out small effects the way a monthly panel could, and the Newey-West correction only handles serial correlation, not the small-sample problem itself. The money-supply result is a lagged correlation, not a controlled experiment: M2 growth and the deficit share causes (a Fed easing cycle and a fiscal expansion often arrive together, especially in recessions), so this run cannot rule out that some third factor drives both the money growth and the inflation that follows it. Only two lags (one and two years) and one control (unemployment) were tested for the deficit specifications, and both era boundaries and lag lengths were fixed before any regression ran, to avoid the specification-search trap this desk names on other runs.
